


 English (pdf)
 Article in xml format
 Article references
 Send this article by e-mail
 Cited by SciELO
  Cited by Google
  Similars in
SciELO
Similars in
SciELO  Similars in Google
 Permalink
Introduction
COVID-19 is a disease caused by the SARS-CoV-2 coronavirus and the first cases were reported in Wuhan, China, in December 2019.1 This disease has had serious consequences worldwide due to its rapid spread, so, since it was first identified, multiple investigations have been carried out to establish its clinical-epidemiological profile, which has not been clearly defined yet despite the significant advances in this regard.
In the pediatric population, COVID-19 was first described as a respiratory infection similar to seasonal influenza outbreaks, where most patients present with mild to moderate respiratory symptoms and occasional respiratory failure, and people with comorbidities are affected the most.2
Current data indicate that COVID-19 affects children and young people less frequently and less intensely, which could be explained by the reduced expression of the angiotensin-converting enzyme 2 (ACE2) receptor in this population, as it is used by SARS-CoV2 to enter the host cells from the nasal epithelium.3
In the lungs, SARS-CoV2 can cause alveolar damage by desquamation of pneumocytes, edema with mononuclear inflammatory cell infiltrate, and membrane deposit on the gas-exchange surface, resulting in ground-glass opacities patterns.4-6
Although respiratory conditions are most commonly observed, COVID-19 may also present with gastrointestinal symptoms such as abdominal pain, vomiting and diarrhea,7 rash-like skin lesions, and even Kawasaki syndrome (a systemic vasculitis of unknown origin associated with bacterial or viral infections) as reported in the pediatric population.8 Moreover, it has been reported that groups of children present with cardiac involvement, gastrointestinal symptoms, and significantly elevated markers of inflammation 2 to 4 weeks after developing SARS-CoV-2 infection. This form of presentation is known as multisystem inflammatory syndrome in children and adolescents temporally related to COVID-19.9
Similarly, laboratory findings are variable and depend on the availability of tests in each hospital facility; for example, variations in blood count, blood chemistry, markers of inflammation and infection, among others, have also been reported.5,10
In this context, the objective of this review is to estimate the epidemiological profile of pediatric patients with COVID-19, as well as their clinical, laboratory and radiological characteristics.
Materials and methods
A living systematic review was carried out after being granted technical approval by the Obstetrics Program Council of the Universidad Central del Ecuador. The study registration and protocol are available at https://osf.io/y43wm and https://osf.io/r8ktv, respectively.
Search strategy
The acronym POT was considered for preparing this review as follows: P: patients under 19 years of age; O: outcome, which refers to the clinical, radiological, and laboratory characteristics of patients with a confirmed diagnosis of COVID-19; and T: types of studies required, which for this review were cross-sectional and cohort studies, case series, and systematic reviews, all of them observational.
A living systematic search was carried out in the PubMed, Scopus and SciELO databases using the following search strategy: publication period: January 1, 2020 to July 20, 2020; types of study: government and epidemiological reports and pre-print articles describing clinical, radiological, and laboratory characteristics in the pediatric population with COVID-19; language: unrestricted; search terms: "2019-nCoV disease", "2019-nCoV infection", "SARS-CoV-2 infection", "coronavirus disease-19", "Child", "Children", "Pediatrics", "Infant", "Infants", "Adolescent" and "Preschool", which were combined with the operators "OR" and "AND" to establish the search equations.
Inclusion criteria, quality of studies, risk of bias, and quality of evidence
According to the tools published by the Joanna Briggs Institute for critical appraisal of scientific literature,11,12 studies that met the requirements to be classified as case series, cross-sectional studies, systematic reviews, and cohort studies were included.
By definition, observational studies provide low-quality evidence and, therefore, have a high risk of bias. To minimize this problem, the present study included only articles that scored ≥70% after the critical appraisal and were performed on at least 101 patients. The parameter to calculate the minimum sample size that the articles should have to be included in the present review was that fever and cough are found in approximately 50% of cases;13 a precision of 10% with a 95% confidence was applied, thus resulting in a minimum number of 101 patients. The sample size was extrapolated for the rest of the studied variables.
To assess the quality of the evidence found, the GRADE handbook criteria were applied;14 this system classifies the certainty of the evidence into very low, low, moderate, and high.
Procedure for searching, extracting, and analyzing data
CV and SV conducted searches in the bibliographic databases, while SV and PT independently selected articles according to the title and reading of the abstract and applied inclusion criteria to select full-text articles; in case of disagreement, it was resolved by consensus by all authors. CV extracted the data and transferred them to the database format in a spreadsheet, and SV performed the frequentist and Bayesian statistical analyzes.
Statistical analysis
To estimate the overall proportion of clinical, radiological and laboratory characteristics in patients, a meta-analysis of single proportion, i.e., single-arm meta-analysis, was performed using the frequentist method. In this way, data on variables of interest and sample size were extracted from the included studies, but interventions were not analyzed. For this meta-analysis, the statistical program R version 3.6.1,15,16 which uses the inverse variance method and the generalized linear mixed model, was utilized. The random effects model was also applied because it assumes that the included studies are a random sample of the universe of possibilities, making it more conservative.16
To identify and measure heterogeneity, the interpretation thresholds described in the Cochrane handbook were considered:17 0-40%: might not be important, 30-60%: may represent moderate heterogeneity, 5090%: may represent substantial heterogeneity, and 75-100%: considerable heterogeneity. The results of the meta-analyzes were not considered when heterogeneity in a data group was ≥60%.
Subgroup analyzes were also performed according to the origin of the patients. To calculate publication bias, the Egger's linear regression test was applied. It was adjusted to be used with a minimum of 4 studies, establishing that p<0.1 suggested the presence of bias.
On the other hand, to estimate the Odds Ratio (OR), a meta-analysis of two proportions was performed using the Bayesian method. It has multiple advantages over the frequentist method; for example, the graphs accurately explain each parameter with the corresponding differences and the number of patients or sample size do not influence the results. It is also a model that is robust compared to atypical or heterogeneous values and determines that high heterogeneity leads to a greater variance of the subsequent estimate, which is easy to detect and therefore unlikely to lead to bias.18
The Bayesian model was applied using the Markov chain Monte Carlo (MCMC) method. To calculate these chains, the initial values of the variables under study were run 1 000 adaptation steps; then, in order for the chains to advance from their non-representative initial values to the area where the values of the later probability were found, another 1 000 steps were run -phase known as burn-in period-, and finally 30 000 steps were saved. The validity of the model was tested using the Heidelberger and Welch convergence diagnostic tests. For more information on the Bayesian model, see Achar et al.19 and Kruschke.20
The programs used for data processing in this study are those employed by Kruschke & Liddell.18Data were analyzed using the R Project for Statistical Computing 3.6.1 program and rjags and coda packages.21,22
Living systematic review
Due to its nature, the present living systematic review will be updated every six months according to the recommendations of Elliott et al.,23 who indicate that when new studies or data are identified for inclusion, these data can be incorporated into the review as a brief communication or an editorial if the new information does not make negligible difference to summary estimates and has no effect on the findings of the review. In contrast, if new studies or data are identified that result in significant changes to summary estimates or the conclusions of the review, they should be submitted to a rapid editorial and peer review prior to publication.
Results
The initial database search yielded 458 results, of which 131 were removed because they were duplicates, 231 were not related to the research subject, 75 did not meet the inclusion criteria, and 8 had poor quality or non-minimum sample compliance (101 patients). Finally, 13 studies were included for full analysis: 1 cross-sectional study, 1 cohort study, and 11 case series, which together described a total of 9 152 patients. Not all variables had the same number of cases, so statistical analyzes were made with the available data. The study selection flowchart is summarized in Figure 1.
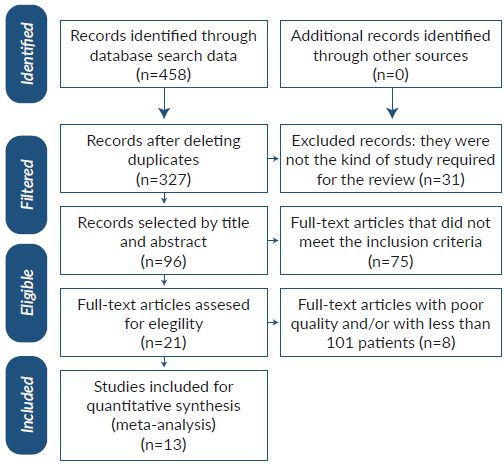
Table 1 presents a summary of the demographic characteristics of each of the articles included. Sex was described in 9 019 patients and the total number of men affected was 4 867 (53.9%).
Table 1 Distribution of patients according to sex and age groups in each study.
| ID | Author | Average age * | Total patients | Male (%) | Country-region | Type of study | Features | Critical appraisal0/) |
|---|---|---|---|---|---|---|---|---|
| 1 | Lu et al.24 | 6 years | 110 | 59 (53.63) | China | Case series | Single center | 80 |
| 2 | Xiong et al.25 | 3 years and 8 months | 244 | 120 (62.17) t | China | Cross-sectional | Single center | 75 |
| 3 | Wu et al.26 | 84 months (IQR: 18123 months) | 148 | 60 (40.54) | China | Case series | Single center | 70 |
| 4 | Li et al.27 | 6 years (IQR: 1-9 years) | 125 | 71 (56.8) | China | Case series | Single center | 80 |
| 5 | Dong et al.28 | 7 years (IQR: 2-13 years) | 731 | 420 (57.45) | China | Case series | Multicenter | 80 |
| 6 | Lu et al.10 | 6.7 years (R: 1 day - 15 years) | 171 | 104 (60.81) | China | Case series | Single center | 80 |
| 7 | DeBiasi et al.29 | 9.6 years | 177 | 92 (51.97) | USA Washington, District of Columbia | Cohorts | Single center | 75 |
| 8 | CDC COVID-19 Response Team30 | 11 years (R: 0-17 years) | 2 572 | 1 408(56.54) * | USA | Case series | Multicenter | 70 |
| 9 | Bellino et al.31 | 11 years (IQR: 5-15 years) | 3 836 | 1 970 (51.35) | Italy | Case series | Multicenter | 70 |
| 10 | Garazzino et al.32 | 5 years (IQR: 0.3-9.6 years) | 168 | 94 (55.95) | Italy | Case series | Multicenter | 80 |
| 11 | Armann et al.33 | - | 128 | 64 (50) | Germany | Case series | Multicenter | 80 |
| 12 | Gaborieau et al.34 | 1 year (R: 0.12-10 years) | 157 | 94 (59.87) | France | Case series | Multicenter | 80 |
| 13 | Götzinger et al.35 | 5 years (IQR: 0.5-12 years) | 585 | 311 (53.16) | Europe | Case series | Multicenter | 80 |
ID=study identification number; R: range; IQR: interquartile range.
* Maximum and minimum values are included in the studies. When the study reported the median age, the interquartile range was included. Some data were converted from months to years.
† This study describes sex in only 193 participants.
‡ This study describes sex in only 2 490 participants.
Source: Own elaboration.
Table 2 presents in detail each of the clinical laboratory and radiological variables, with their partial and total values.
Table 2 Distribution of participants according to clinical, laboratory and radiological characteristics.
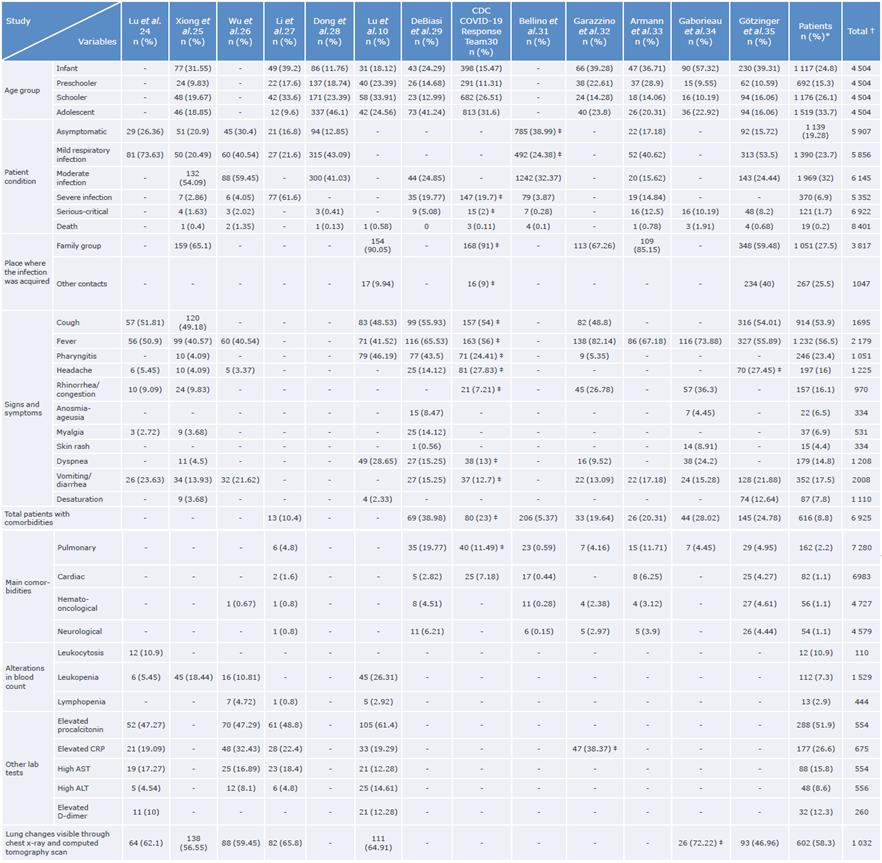
CRP: C-reactive protein; AST: aspartate aminotransferase; ALT: alanine aminotransferase; LDH: lactic dehydrogenase.
* This column lists the number of patients who presented the event of interest. † This column lists the total number of patients described in each variable.
‡ The n value and the percentage correspond to the number of patients who presented the event of interest in the corresponding variable.
Source: Own elaboration.
According to the age group, patients classified as schoolers and adolescents account for almost 60% of those affected. When analyzing the condition of the patients, it was found that the majority were asymptomatic or had mild respiratory infections, followed by moderate infections; conversely, patients with severe infections or a serious/ critical condition represented low percentages (Table 2).
Regarding signs and symptoms, cough and fever were the most frequent and were found in more than half of the patients; other manifestations occurred in a smaller percentage (Table 2).
Meta-analysis results, heterogeneity, and publication bias
A meta-analysis of all clinical, laboratory and radiological variables was carried out. Table 3 reports the final results and shows the general proportion of the variables that presented heterogeneity <60% and were described in at least 4 articles. The results of the Egger's linear regression test did not show p-values <0.1, so there was no publication bias due to the effect of the small studies. Therefore, this criterion would only be valid for the variables cough, death and pulmonary alterations observed in imaging studies, which were the only ones found in 7 or more studies. In particular, the analysis of the variable death found significant heterogeneity (59%); however, most studies reported mortality <1%.
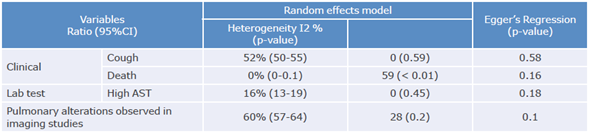
It should be noted that the level of heterogeneity found did not allow obtaining reliable results although the subgroups of the variable related to the place where the patient contracted the infection were analyzed. Nevertheless, the percentage of infected children within the family nucleus was higher in the Chinese population.
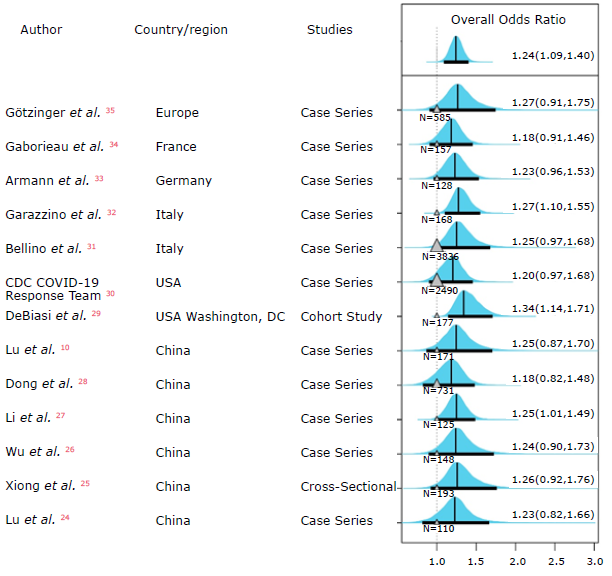
Figure 2 presents the tree diagram for the OR es timation. It plots the subsequent distribution of each parameter as a horizontal bar under the histogram; said bar represents the 95% (high probability density) HDI (highestdensity interval), which is the Bayesian analogue of the 95%CI (confidence interval). HDI comprises the set of values containing the estimated OR for each data set. The gray triangle represents the sample size (n=).
Source: Own elaboration.
Figure 2 Tree diagram for meta-analysis of two proportions according to sex.
All studies reported the sex of the patients, which allowed to estimate the overall OR, showing that the 95%HDI does not include 1 (although it is very close). The OR logarithm, which represents the difference in the probability of disease among men/women, showed a modal distribution of 0.24 (95%HDI: 0.10-0.37); these values do not include 0 and, therefore, indicate that there is a greater involvement of the male sex.
Quality of evidence
Table 4 summarizes the quality of evidence found according to the GRADE criteria.14
Table 4 Quality of evidence for articles found according to the GRADE criteria.
| Result | No. of | Study design | Factors that may reduce the certainty of the evidence | Certainty of evidence | ||||
|---|---|---|---|---|---|---|---|---|
| studies (No. of patients) | Risk of bias * | Indirect evidence t | Inconsistency * | Imprecision ** | Other considerations | |||
| Cough | 7 (914) | Observational | Serious | Serious | Not serious | Not serious | Publication bias not detected. | Moderate |
| Death | 10 (19) | Observational | Not serious | Not serious | Serious | Not serious | Publication bias not detected. | High |
| Elevated aspartate aminotransferase level | 4 (88) | Observational | Very serious | Very serious | Very serious | Very serious | Publication bias not detected. | Very low |
| Pulmonary alteration observed in imaging studies | 7 (602) | Observational | Serious | Serious | Not serious | Not serious | Publication bias not detected. | Moderate |
| Sex: more males affected | 13 (4 867) | Observational | Serious | Serious | Not serious | Not serious | Publication bias not detected. | Moderate |
* This factor qualified the design or execution of the study.
† This factor evaluated whether the evidence found responded directly to the objective or research question.
‡ This factor evaluated whether the results were consistent between studies.
** This factor evaluated whether the results were accurate enough.
Source: Elaboration based on Schünemann et al.14
When analyzing the variable death, a significant heterogeneity was found (59%), which was considered a serious inconsistency. However, evidence was eventually classified as high (Table 4) since all studies where this variable was described had a high quality and most reported mortality <1% (especially those that included a large number of patients).
Discussion
COVID-19 is a disease that has greatly impacted all the scenarios of human activity.36-38 Like any infection caused by other coronaviruses such as SARS-CoV (severe acute respiratory syndrome coronavirus) and MERS-CoV (Middle East respiratory syndrome coronavirus), SARS-CoV-2 affects the pediatric population in a smaller proportion.39,40 However, it has similar clinical presentation and mortality rates than those reported for the first two viruses.
When comparing COVID-19 with seasonal influenza, it is found that the clinical presentation of both diseases is variable and can range from asymptomatic cases, through mild cases, to serious infections. The population at highest risk of influenza virus infection are children, who are also the main transmitters, while, in the case of COVID-19, they seem to be the least affected.41
According to the results, COVID-19 occurs more frequently in males, which is consistent with the findings observed in adults, where the proportion of affected men is even higher. This increased susceptibility of the male sex may be due to multiple factors (biological and physiological) such as increased expression of the ACE2 receptor blockers or the presence of the double X chromosome to which a protective role is attributed.1 In this context, it should be borne in mind that, in most regions, it is still men who work the most out of their homes, which increases the likelihood of infection; this greater contact with people outside the home is also typical of schoolchildren and adolescents, which would explain why these age groups are more affected.4,42,43
Similarly, lockdowns have helped elucidate the source of the infection. In China, for example, the population was confined early, which is why it was established that most children were infected in their household, unlike populations where confinement started late and where most infections occurred is not clear.44
Underlying diseases condition susceptibility to infection by or worsening of COVID-19 symptoms. According to the studies analyzed, up to 50% of the severe or critical patients had comorbidities, mainly pulmonary, neurological, cardiovascular, or obesity, which is consistent with the reports in adults.10,45,46
COVID-19 may present with variable symptoms. In this regard, Wise47 analyzed the data obtained from a symptom tracking application and reported that there are six different "types" of COVID-19. Each type is characterized by a group of symptoms that are classified as follows: (i) "flu-like" without fever (headache, hyporexia, cough, odynophagia, myalgia, and chest pain); (ii) "flulike" with fever (headache, hyporexia, anosmia, cough, dysphonia, odinophagia); (iii) gastrointestinal (headache, anosmia, hyporexia, diarrhea, odinophagia, and severe chest pain); (iv) severe level one: fatigue (headache, chest pain, anosmia, cough, fever, and dysphonia; (v) severe level two: confusion (headache, chest pain, myalgia, odinophagia, anosmia, hyperexia, cough, fever, and fatigue); and vi) severe level three: abdominal and respiratory involvement (headache, odinophagia, chest pain, abdomen and muscles, anosmia, hyperexia, cough, fever, dysphonia, fatigue, confusion, respiratory distress, and diarrhea.) The same study reported that patients with clinical symptoms level 4 to 6 are more likely to be admitted to the hospital and need respiratory support,47 which also coincides with the reports in the adult population.
In this regard, Xiong et al.25 found that children with COVID-19 and gastrointestinal symptoms are prone to further deterioration of their clinical symptoms and alterations of lab test results. Moreover, several studies have reported the presence of SARS-CoV-2 in children's feces even up to 30 days after infection,48 although it is worth mentioning that the fecal-oral route has not yet been determined.49
It should be noted that cough and fever are the most common symptoms and that rates of up to 72.2% and 89.1%, respectively, have been reported in adults. In the pediatric population, the percentages are lower, which could be explained by the higher number of patients under 19 years of age who are asymptomatic or present with a mild infection.50
Laboratory test results are not conclusive since leukopenia is relatively frequent in viral processes in children;39 however, only lymphopenia yielded results with a constant proportion, even though the number of studies found was not sufficient to estimate its overall proportion. It should be noted that lymphopenia occurs in greater proportion in adults and is considered a critical factor associated with the severity and mortality of the disease.5 This may be related to both the characteristics of the immune system and the low percentage of severe/ critical patients reported in the studies analyzed here.
With respect to inflammation and infection markers, the overall proportion of patients with elevated C-reactive protein and procalcitonin levels could not be established in this study. However, it should be noted that the results of both tests may be normal in patients with mild infections and that the elevation of these markers is associated with more severe clinical manifestations or bacterial coinfections.10,39,45 The same occurs with the elevation of the D-dimer, which is usually accompanied by a systemic inflammatory response and coagulation activation in patients with severe symptoms.39,51
Lactate dehydrogenase and transaminases (aspartate aminotransferase and alanine aminotransferase) are elevated in infectious or inflammatory processes, and the latter increase even more when the liver is involved. Although the elevation of these enzymes is sometimes non-specific, measuring their increase can help assess systemic involvement when a patient is ill. 39,45,52
Pulmonary ground-glass opacities were found in 60% of the patients analyzed in the studies included in the present review; however, this same pattern has been described in up to 96.6% of cases in adults.40,49,50 In both groups, lung injury is most evident in computed tomography.5,53
The present work was prepared based on the best evidence available up to the date of the review, so it includes quality studies that are mostly multicenter. In addition, Bayesian methods were applied to calculate OR. Nevertheless, its limitations include that all data are reported in retrospective studies; the overall proportion in most variables presented high heterogeneity that may be associated with genetic, geographic or ethnic causes; there was a lack of stratification of the variables according to the different age groups since some symptoms can only be reported by patients older than five years, for example, headache or anosmia; and not all studies presented the variables analyzed and, therefore, the number of observations was not constant. Given these limitations, the results of this study should be contrasted with prospective randomized controlled studies with larger samples and a stricter design.
Conclusions
Clinical and epidemiological characteristics of COVID-19 in pediatric patients cannot yet be accurately described based on the current data. However, the male sex seems to be more affected and lung alterations in imaging studies are more frequent than clinical signs such as cough and fever. Laboratory results are not conclusive and reflect that different organs and systems are affected by the virus.
This meta-analysis was prepared based on the best data available up to the date of the review and on a rigorous analysis, so the data are credible and will serve as the basis for future comparisons between regions or age groups.

