English (pdf)
 Article in xml format
 Article references
 Send this article by e-mail
 Cited by SciELO
  Cited by Google
  Similars in
SciELO
Similars in
SciELO  Similars in Google
 Permalink
Introduction
Chronic obstructive pulmonary disease (COPD) is one of the most common chronic noncommunicable diseases of the lower airway,1,2 with an estimated prevalence of 15.7% in men and 9.93% in women worldwide. The Americas is the region with the highest reported figures, as 14.53% of the general population suffer from this disease,3 and they are associated mainly with exposure to risk factors particularly found in developing countries.4 Moreover, COPD is the third leading cause of early death at the global level, making it an important cause of morbidity and mortality.3,5
Over the years, it has become evident that there are many limitations to diagnose COPD, with an underdiagnosis rate of up to 70% in the Americas.6-8 This situation considerably increases the burden of the disease for health systems and generates a higher average annual cost per patient, mainly due to complications9-11 that bring along events such as decreased pulmonary function, deterioration of the health condition, increased number of hospitalizations,12,13 and a significant increase in mortality.14
Considering the possible underdiagnosis rates of COPD, multiple questionnaires have been used to screen or detect it in primary care services to improve diagnosis.15,16 Currently, the most commonly used questionnaires are COPD-PS (COPD Population Screener),12,17 CDQ (COPD Diagnostic Questionnaire),18,19 LFQ (Lung Function Questionnaire),20-22 EGARPOC (COPD screening questionnaire from Terrassa),23 IPAG (International Primary Care Airways Guidelines questionnaire),24-26 CAPTURE (COPD Assessment in Primary Care to Identify Undiagnosed Respiratory Disease and Exacerbation Risk),6,27,28 and CAT (COPD Assessment Test).29
These instruments' validity is variable because there is no uniformity in the questions or the target population, although most of them explore risk factors and clinical symptoms.30,31 Therefore, there is no consensus on which questionnaire is more suitable to diagnose this disease.25
Haroon et al.32 performed a systematic review in which the CDQ questionnaire was evaluated and five studies were included for the final meta-analysis. Sensitivity of 64.5% (95%CI: 59.9-68.8) and specificity of 65.2% (95%CI: 52.9-75.8), with a cut-off point of 19.5, were observed, as well as a change in sensitivity of 87.5% (95%CI: 83.1-90.9) and specificity of 38.8% (95%CI: 27.7-51.3), with a cut-off point of 16.5. These results showed that this instrument could be useful as a screening test and, eventually, optimize the use of spirometry by improving the diagnosis of COPD.
The present research work summarizes the available data on the use of questionnaires for the diagnosis and screening of COPD. To this end, instruments were analyzed globally and individually, always taking into account the variability of the parameters evaluated by each one of them. Thus, the objective of the review was to determine the validity of the use of different questionnaires for COPD diagnosis.
Materials and methods
Protocol and record keeping
The protocol followed the PRISMA-DTA (Preferred Reporting Items for Systematic Reviews and Meta-Analyses Protocols extension for Diagnostic Test Accuracy) guideline, which establishes screening and data extraction and analysis strategies. In addition, the study protocol was submitted to the Research Committee of the Universidad de la Sabana, in Colombia, which authorized it through institutional registration number MED-263-2019.
Eligibility criteria
The included studies were conducted in subjects who met the following criteria: being older than 30 years and being exposed to biomass and/or cigarettes, regardless of the number of packages per year; respondents in person to a survey/interview indicating the probability of having COPD, who were inpatients or outpatients regardless of the level of care provided; and patients with a confirmed diagnosis of COPD based on spirometric parameters such as FEV1 (forced expiratory volume in the first second) / FVC (forced vital capacity) <0.7 after using beta-2 receptor agonists (B2), FEV1/FVC6 (forced expiratory volume in 6 seconds) <0.7 after using B2, or FEV1/FVC <0.7 below the normal lower limit.
On the other hand, studies conducted in patients previously diagnosed with COPD who had exacerbations, that evaluated quality of life, and that included the diagnosis of other conditions such as lung cancer, or interstitial lung diseases such as sarcoidosis, were excluded. Likewise, studies in which spirometry was not performed after administering the questionnaires or that did not allow obtaining data directly or indirectly for the construction of 2x2 tables with their corresponding positive and negative test results frequencies were excluded.
Sources of information and search methodology
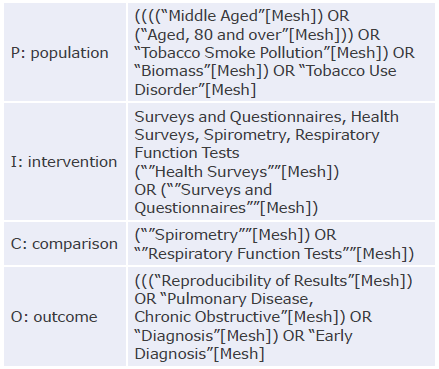
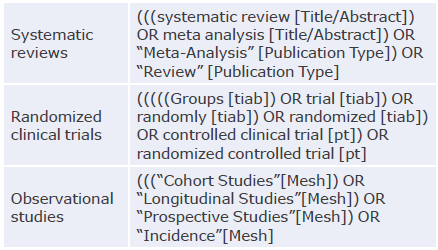
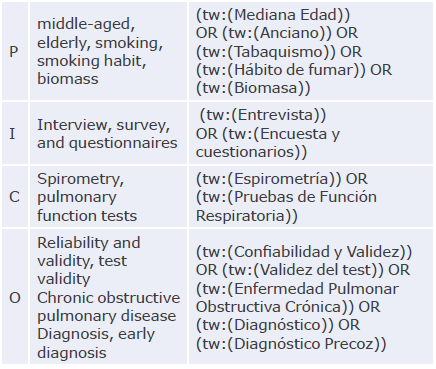
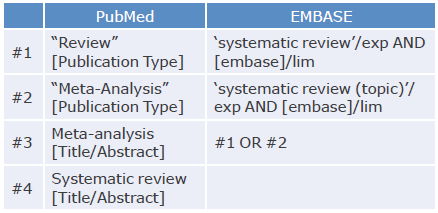
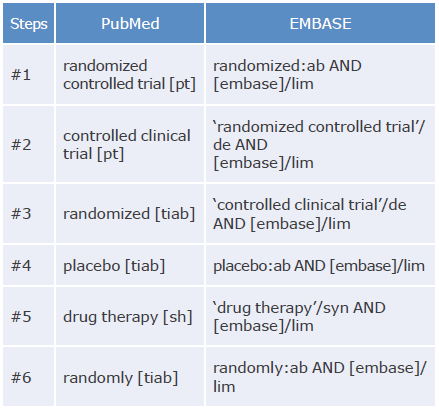
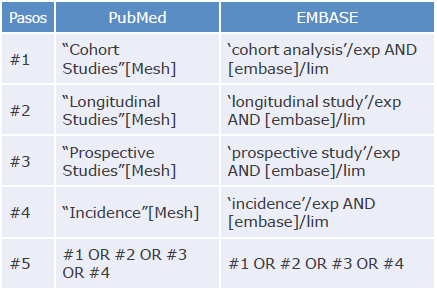
An exhaustive literature search was performed in PubMed, EMBASE and LILACS using the PICO (Patient, Intervention, Control, Outcomes) strategy and MeSH and DeCS terms. Studies published between July 1, 1997, and April 30, 2020, were included. The search strategy is described in Annex 1.
To select the studies, a group of researchers, composed of a team of experts in pulmonology and internal medicine, was created to review the titles and abstracts of the publications identified in the search. In addition, articles recommended by experts and others identified in the references of the selected articles were included.
Selection of studies
Based on the titles and abstracts identified, two reviewers independently screened potential eligible articles. In case of disagreements between the two reviewers regarding the decision to include or not an article, a third senior researcher made the decision.
Data collection
Two researchers independently extracted the relevant data from the studies and consolidated them into a single digital database. When necessary, the authors of the articles were contacted to clarify information. Data were recorded in contingency tables to establish the variables required to analyze the validity properties of the scales.
Definitions for data extraction
The following information was extracted from the selected studies: principal author, year of publication, number of participants, methods employed, diagnostic tests used, and variables analyzed (exposure to tobacco or biomass, COPD diagnosis, questionnaire administration).
Furthermore, the following information was obtained for the COPD screening scales included in the studies: method of administration, language, cut-off point, sensitivity, specificity, positive predictive value, negative predictive value, likelihood ratio, and receiver operating characteristic and area under the curve (ROC AUC).
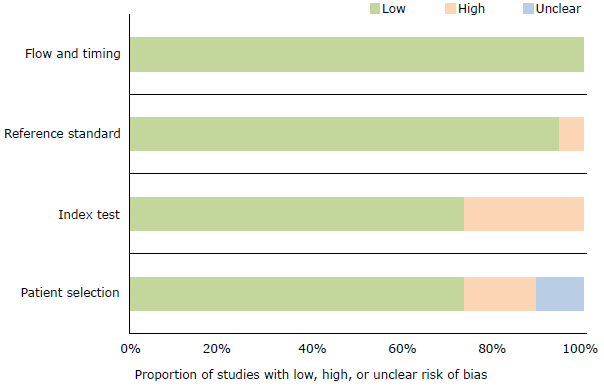
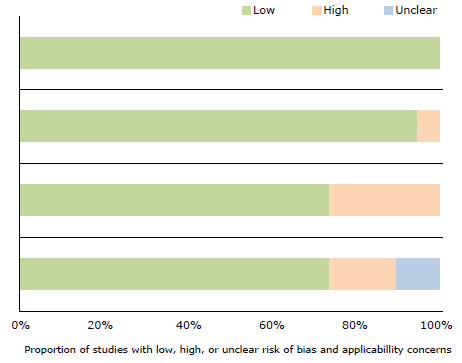
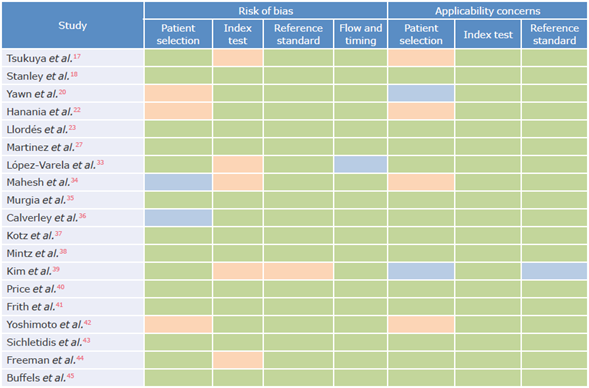
Risk of bias and applicability
The methodological quality and risk of bias of the selected studies were assessed using the QUADAS (Quality Assessment of Diagnostic Accuracy Studies) instrument, where each of the items was classified as yes, no, or x when the response was unclear. Risk of bias was judged as low, high, or uncertain. If the answers to the guiding questions were yes, the probability of bias was low. In turn, if any of the answers to the guiding questions were no, the probability was high. Finally, if data were insufficient to make a judgment, the probability was uncertain.
Summary of results
To analyze the results, 2x2 tables were created including the corresponding true positives, true negatives, false positives, and false negatives. Likewise, for the meta-analysis, an analysis plan was designed using a hierarchical model with the representation of the summarized ROC curve. Thus, consolidated estimates of sensitivity, specificity, and diagnostic odds ratios (DOR) with 95% confidence intervals (95%CI) were presented.
Results
Study selection
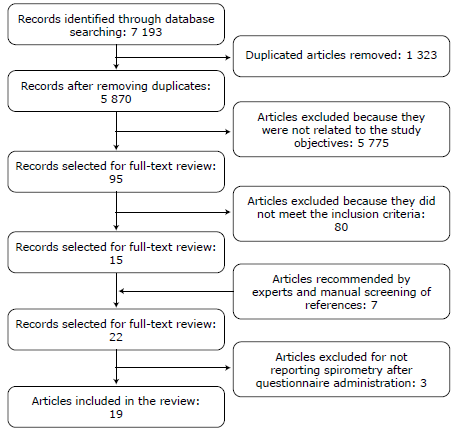
The initial search of the databases yielded 7 193 potentially relevant articles, of which 1 323 were eliminated because they were duplicates, 5 775 because they did not meet the study objective, and 80 because they did not meet the inclusion criteria, for a total sample of 15 articles selected for full-text review. Another 7 articles, which were not considered in the initial search, were included following the recommendations of experts. Of the 22 articles selected for a comprehensive review, 3 were excluded since no spirometry had been performed after administering the questionnaires. Consequently, 19 studies were finally included in the review (Figure 1).


Results per study
Sensitivity and specificity
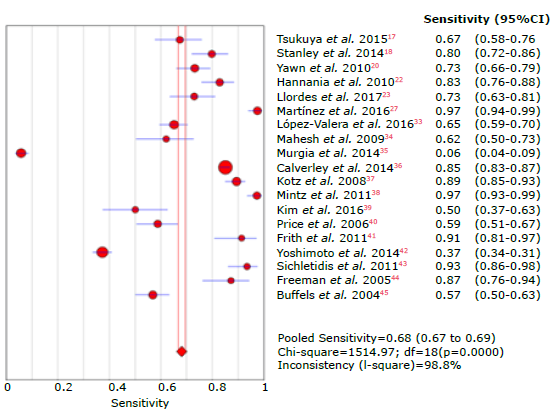
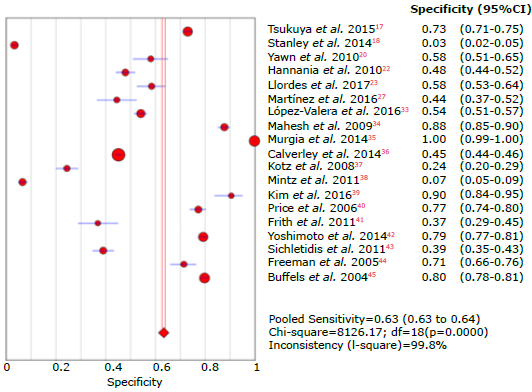
The overall sensitivity was 68.1% (95%CI: 66.7-69.4), with a heterogeneity statistic (I2) of 98.8%; the studies by Martínez et al.27 and Mintz et al.38 reported the highest sensitivity in the questionnaires (97.3% and 97.1% respectively), while Murgia et al.35reported the lowest sensitivity with 5.7%. On the other hand, the The overall sensitivity was 68.1% (95%CI: 66.7-69.4), overall specificity was 64.9% (95%CI: 64.3-65.5), with with a heterogeneity statistic (I2) of 98.8%; the stud- I2 of 99.7%; the highest specificity was reported by Murgia et al.35 with 99.7%, and the lowest by Mintz et al.38 with 6.5%.
Tables 3, 4, 5 and 6 summarize the sensitivity, specificity and likelihood ratios analyses, and Figures 4, 5, 6, 7 and 8 present the forest plots for those variables.
Table 3 Sensitivity analysis of the questionnaires used to diagnose chronic obstructive pulmonary disease.
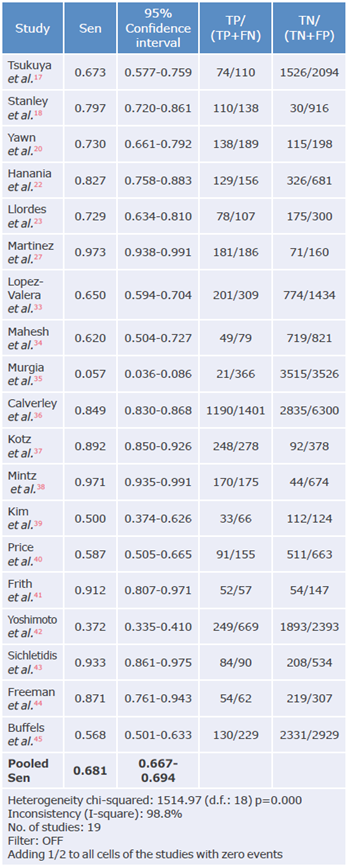
Sen: sensitivity; TP: true positive; FN: false negative; TN: true negative; FP: false positive.
Source: Own elaboration.
Table 4 Specificity analysis of the questionnaires used to diagnose chronic obstructive pulmonary disease.
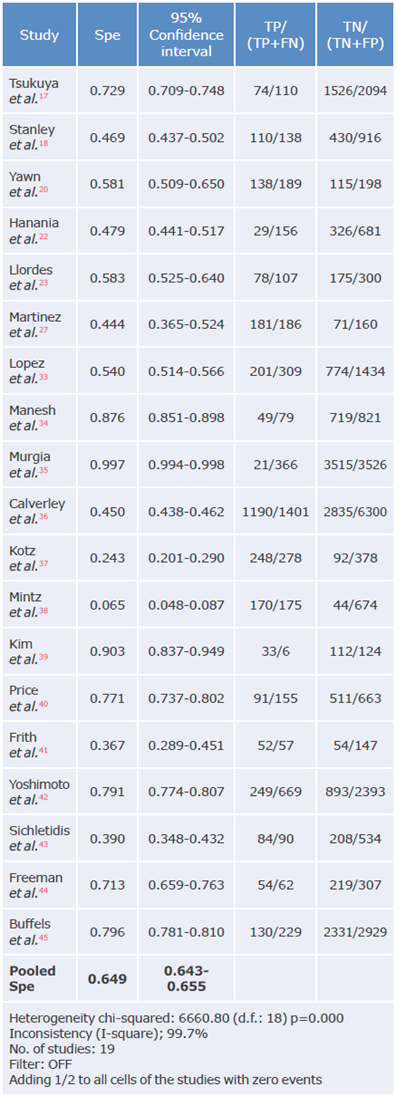
Spe: Specificity; TP: true positive; FN: false negative; TN: true negative; FP: false positive.
Source: Own elaboration.
Table 5 Positive likelihood ratio analysis of questionnaires used to diagnose chronic obstructive pulmonary disease.
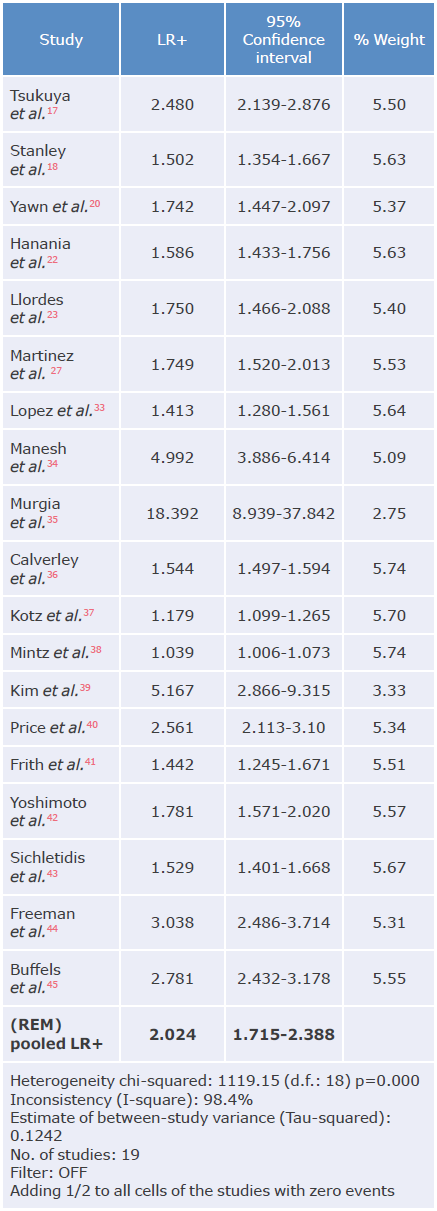
LR+: positive likelihood ratio; REM: random effects model.
Source: Own elaboration.
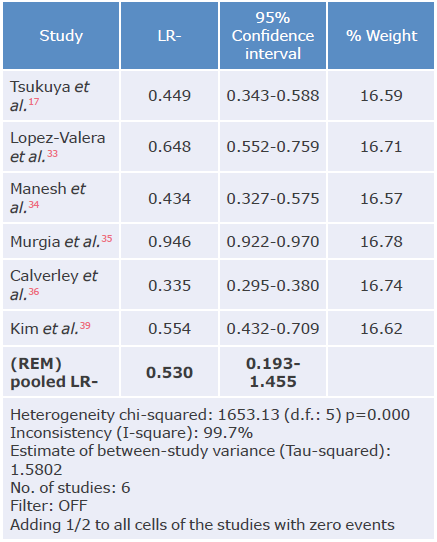
Table 6 Negative likelihood ratio analysis of questionnaires used to diagnose chronic obstructive pulmonary disease.
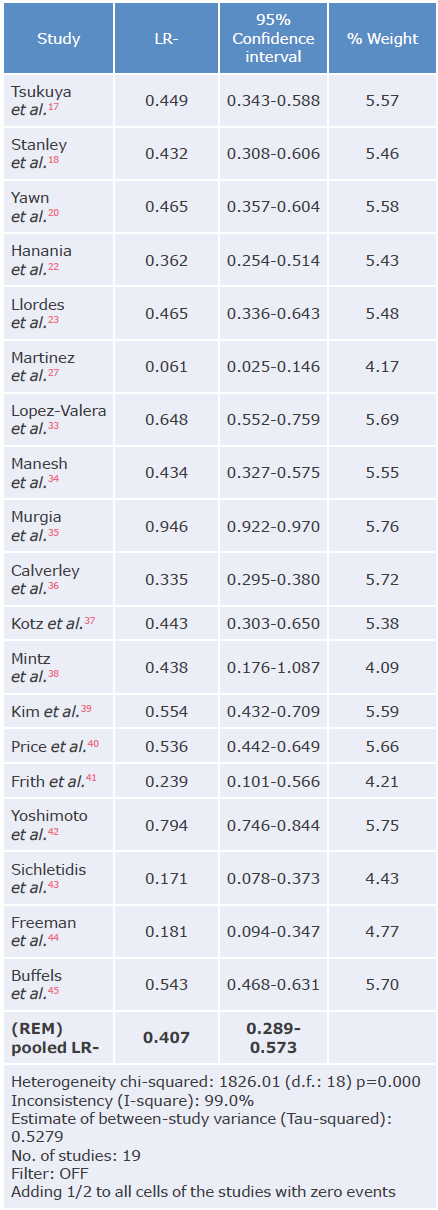
LR-: negative likelihood ratio; REM: random effects model.
Source: Own elaboration.
Source: Own elaboration.
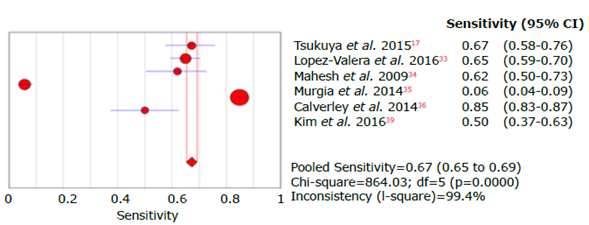
Figure 4 Forest plot for sensitivity of questionnaires used to diagnose chronic obstructive pulmonary disease.
Source: Own elaboration.
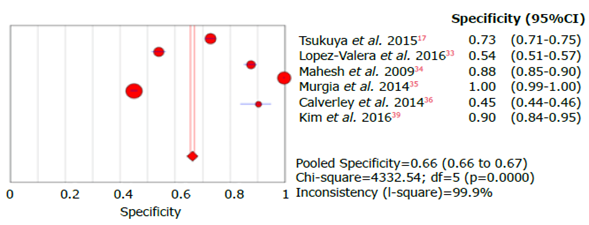
Figure 5 Forest plot for specificity of questionnaires used to diagnose chronic obstructive pulmonary disease.
Source: Own elaboration.
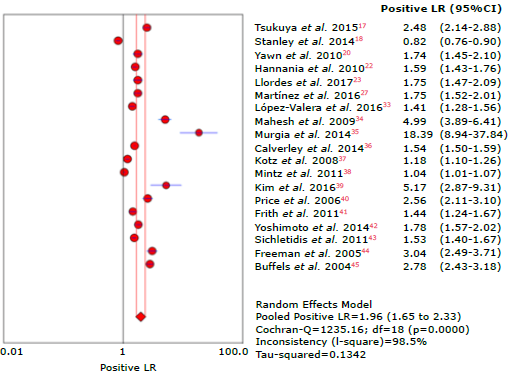
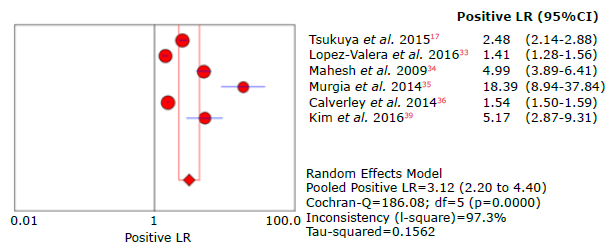
Figure 6 Forest plot for positive likelihood ratio of questionnaires used to diagnose chronic obstructive pulmonary disease.
Source: Own elaboration.
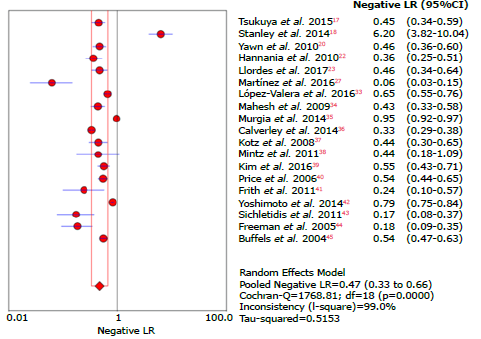
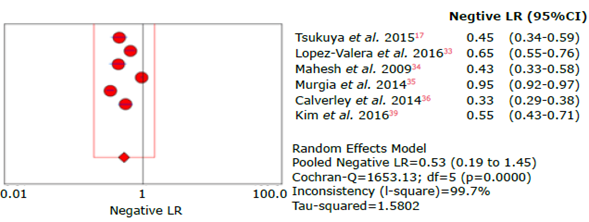
Figure 7 Forest plot for negative likelihood ratio of questionnaires used to diagnose chronic obstructive pulmonary disease.
Source: Own elaboration.
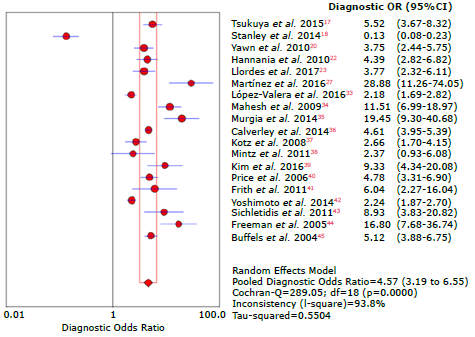
Figure 8 Forest plot for diagnostic likelihood ratio of questionnaires used to diagnose chronic obstructive pulmonary disease.
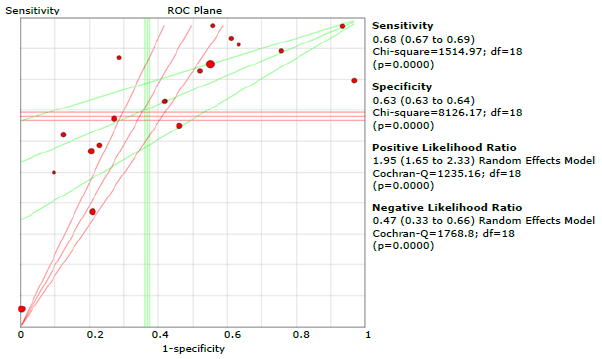
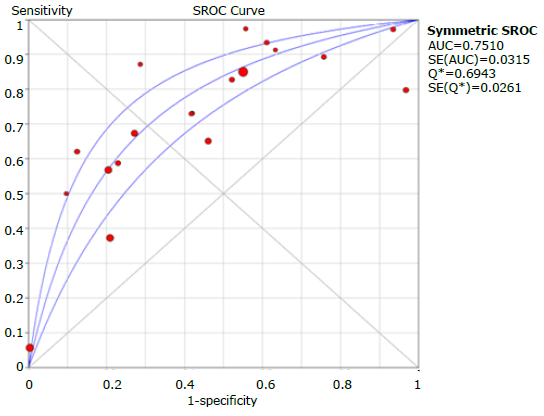
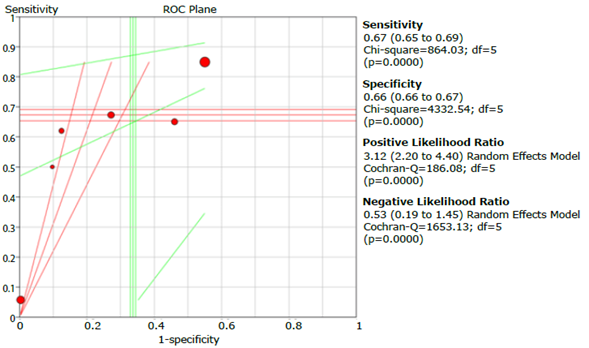
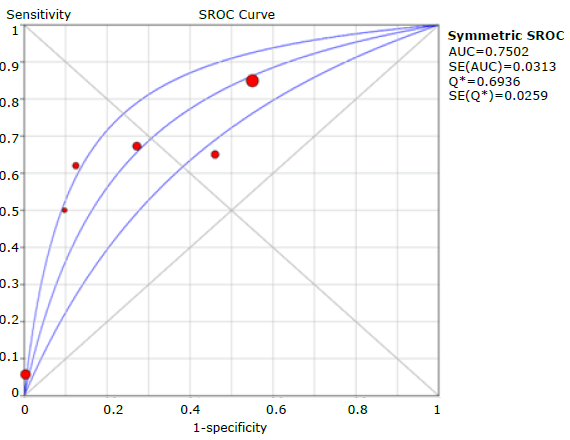
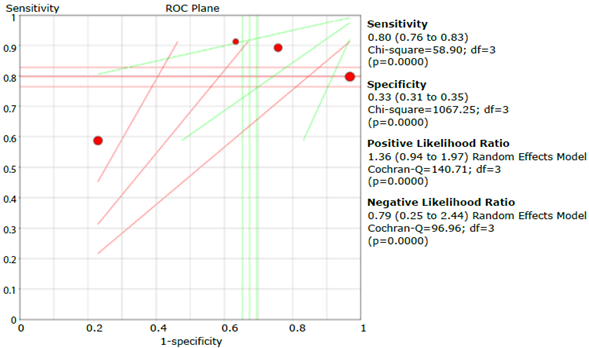
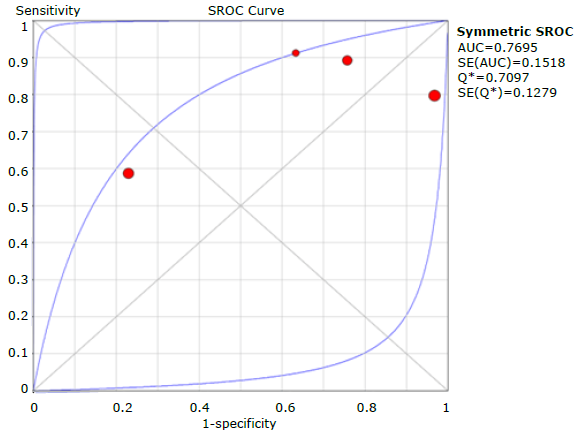
Figure 9 presents the graphic summary of the operating characteristics of the questionnaires used to diagnose COPD, while Figure 10 summarizes the analysis of the receiver operating characteristic curves for the aggregate of the studies; the discriminative ability of the questionnaires was 0.75.
Source: Own elaboration.
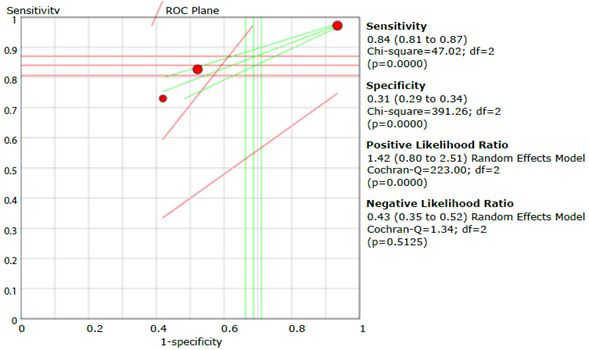
Figure 9 Summary of sensitivity, specificity and positive and negative likelihood ratios of the questionnaires assessed.
COPD-PS questionnaire
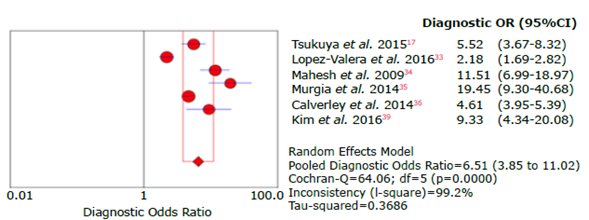
For a total population of 16 630 subjects, 6 studies assessed the COPD-PS questionnaire. Kim et al.39 assessed the FEV1/FEV6 ratio as a diagnostic criterion, and Varela et al.33 and Murgia, et al.35 analyzed outpatients.
Sensitivity, specificity, positive and negative likelihood ratio, DOR and ROC AUC results for the COPD-PS questionnaire are shown in Tables 7, 8, 9, 10 and 11, and in Figures 11, 12, 13, 14, 15, 16 and 17.
Table 7 Sensitivity analysis of the COPD-PS questionnaire used to diagnose chronic obstructive pulmonary disease.
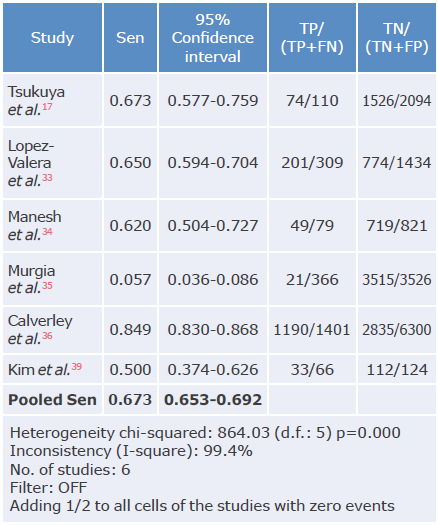
Sen: sensitivity; TP: true positive; FN: false negative; TN: true negative; FP: false positive.
Source: Own elaboration.
Table 8 Specificity analysis of the COPD-PS questionnaire used to diagnose chronic obstructive pulmonary disease.
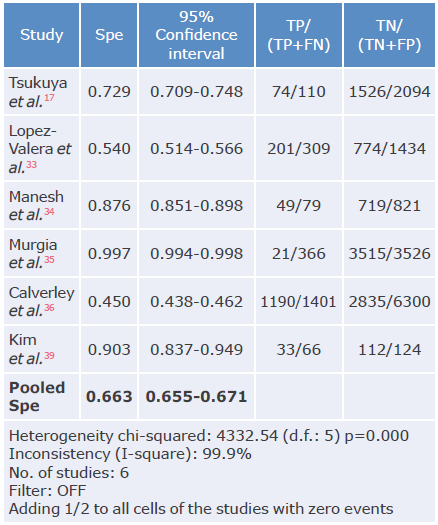
Spe: Specificity; TP: true positive; FN: false negative; TN: true negative; FP: false positive.
Source: Own elaboration.
Table 9 Positive likelihood ratio analysis of the COPD-SP questionnaire used to diagnose chronic obstructive pulmonary disease.
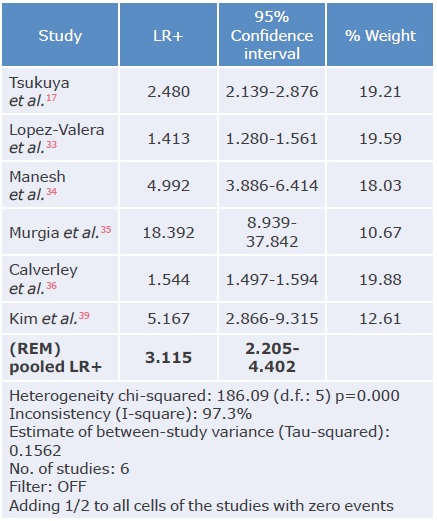
LR+: positive likelihood ratio; REM: random effects model.
Source: Own elaboration.
Table 10 Negative likelihood ratio analysis of the COPD-SP questionnaire used to diagnose chronic obstructive pulmonary disease.
LR-: negative likelihood ratio; REM: random effects model.
Source: Own elaboration.
Table 11 Diagnostic odds ratio analysis of the COPD-SP questionnaire used to diagnose chronic obstructive pulmonary disease.
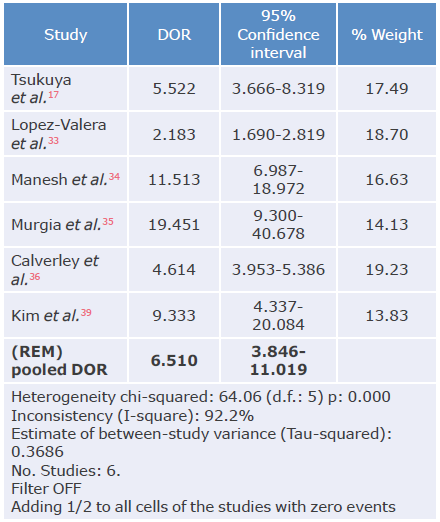
DOR: diagnostic odds ratio; REM: random effects model.
Source: Own elaboration.
Table 12 Sensitivity analysis of the LFQ questionnaire for the diagnosis of chronic obstructive pulmonary disease.
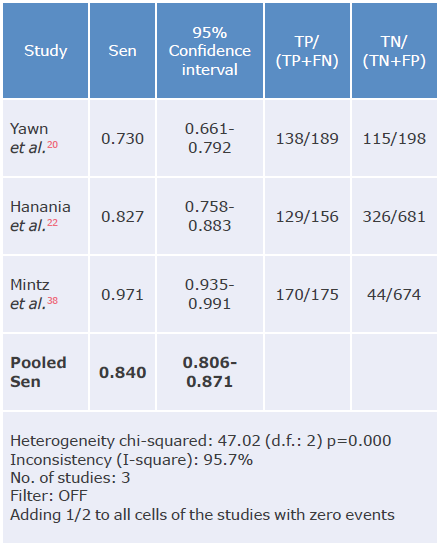
LR-: negative likelihood ratio; REM: random effects model.
Source: Own elaboration.
Source: Own elaboration.
Figure 11 Forest plot for sensitivity of the COPD-SP questionnaire used to diagnose chronic obstructive pulmonary disease.
Source: Own elaboration.
Figure 12 Forest plot for specificity of the COPD-SP questionnaire used to diagnose chronic obstructive pulmonary disease.
Source: Own elaboration.
Figure 13 Forest plot for positive likelihood ratio of the COPD-SP questionnaire used to diagnose chronic obstructive pulmonary disease.
Source: Own elaboration.
Figure 14 Forest plot for negative likelihood ratio of the COPD-SP questionnaire used to diagnose chronic obstructive pulmonary disease.
Source: Own elaboration.
Figure 15 Forest plot for diagnostic odds ratio of the COPD-SP questionnaire used to diagnose chronic obstructive pulmonary disease.
Source: Own elaboration.
Figure 16 Summary of sensitivity, specificity, and positive and negative likelihood ratios of the COPD-SP questionnaire.
LFQ questionnaire
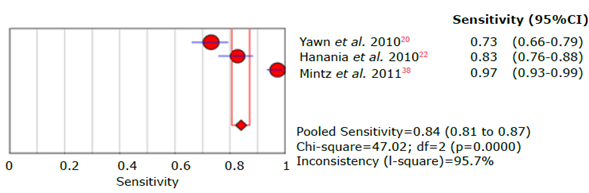
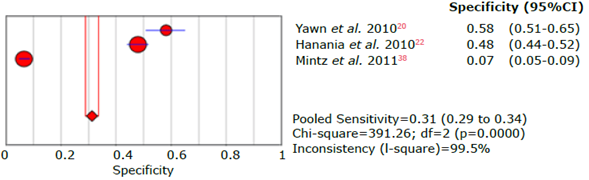
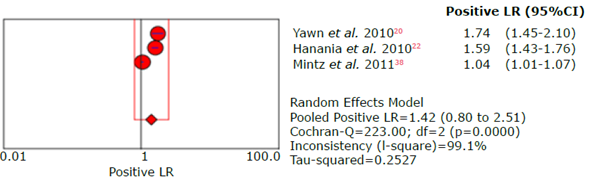
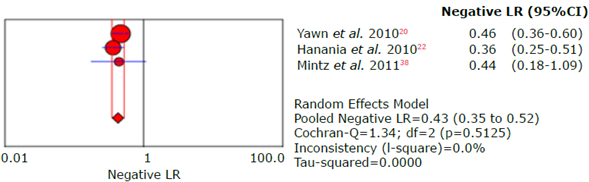
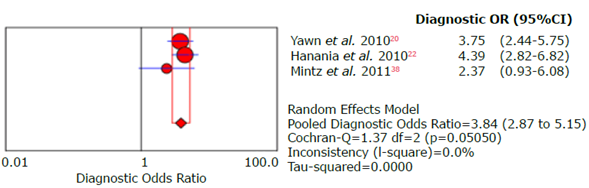
Three studies evaluated the LFQ questionnaire in a study population of 2 073 subjects. All studies assessed the FEVi/FVC ratio as a diagnostic criterion, Mintz et al.38 and Hannania, et al.22 in outpatients and Yawn et al.20 in people from the community and outpatients.
Sensitivity, specificity, positive and negative likelihood ratio, DOR and ROC AUC results for the LFQ questionnaire are shown in Tables 12, 13, 14, 15 and 16, and Figures 18, 19, 20, 21, 22, 23 and 24.
Table 13 Specificity analysis of the LFQ questionnaire for the diagnosis of chronic obstructive pulmonary disease.
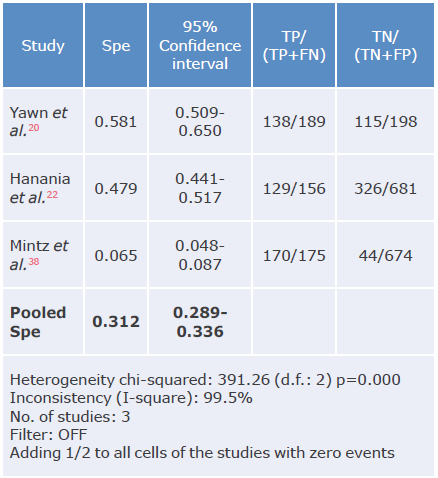
Spe: Specificity; TP: true positive; FN: false negative; TN: true negative; FP: false positive.
Source: Own elaboration.
Table 14 Positive likelihood ratio analysis of the LFQ questionnaire for the diagnosis of chronic obstructive pulmonary disease.
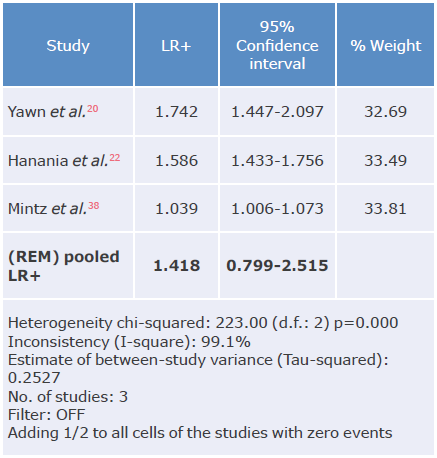
LR+: positive likelihood ratio; REM: random effects model.
Source: Own elaboration.
Table 15 Negative likelihood ratio analysis of the LFQ questionnaire for the diagnosis of chronic obstructive pulmonary disease.
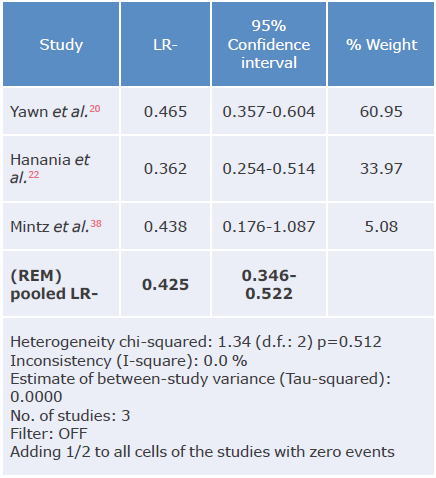
LR-: negative likelihood ratio; REM: random effects model.
Source: Own elaboration.
Table 16 Diagnostic likelihood ratio analysis of the LFQ questionnaire for the diagnosis of chronic obstructive pulmonary disease.
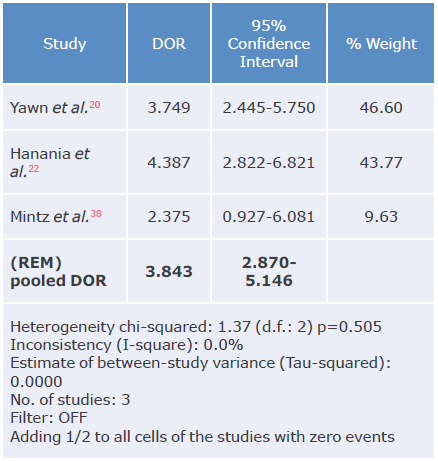
DOR: diagnostic odds ratio; REM: random effects model.
Source: Own elaboration.
Source: Own elaboration.
Figure 18 Forest plot of sensitivity of the LFQ questionnaire for the diagnosis of chronic obstructive pulmonary disease.
Source: Own elaboration.
Figure 19 Forest plot of specificity of the LFQ questionnaire for the diagnosis of chronic obstructive pulmonary disease.
Source: Own elaboration.
Figure 20 Forest plot of positive likelihood ratio of the LFQ questionnaire for the diagnosis of chronic obstructive pulmonary disease.
Source: Own elaboration.
Figure 21 Forest plot of negative likelihood ratio of the LFQ questionnaire for the diagnosis of chronic obstructive pulmonary disease.
Source: Own elaboration.
Figure 22 Forest plot of diagnostic likelihood ratio of the LFQ questionnaire for the diagnosis of chronic obstructive pulmonary disease.
Source: Own elaboration.
Figure 23 Summary of LFQ questionnaire sensitivity, specificity, and positive and negative likelihood ratios.
CDQ questionnaire
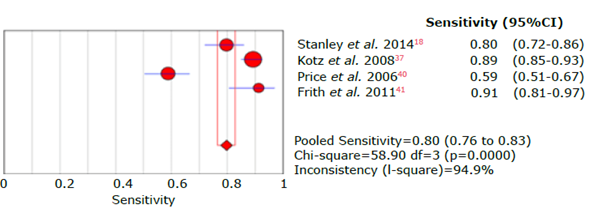
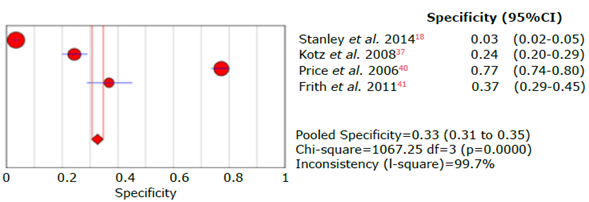
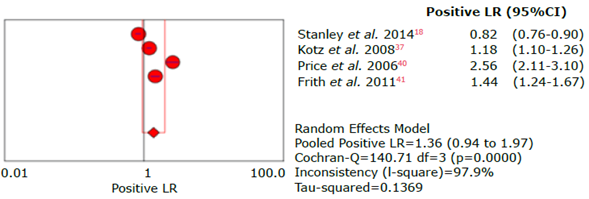
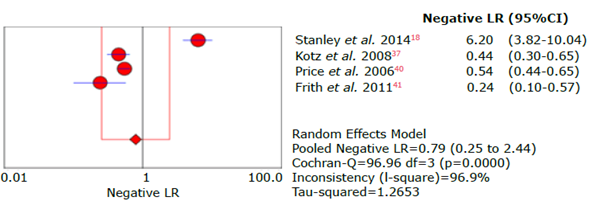
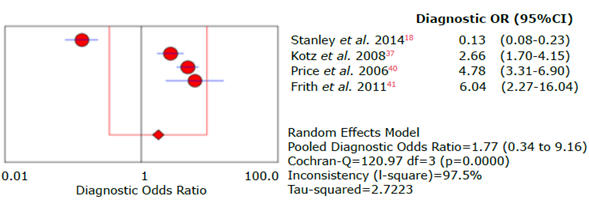
Four studies evaluated the CDQ-38 questionnaire in a total population of 2 732 subjects. Only Frith et al.41 evaluated the FEV1/ FEV6 ratio as a diagnostic criterion; Stanley et al.18 and Frith et al.41 did the evaluation in outpatients, Kotz et al.37 evaluated people from the community, and Price et al.,40 people from the community and outpatients.
Sensitivity, specificity, positive and negative likelihood ratio, DOR and ROC AUC results for the CDQ questionnaire are shown in Tables 17, 18, 19, 20 and 21, and in Figures 25, 26, 27, 28, 29, 30 and 31.
Table 17 Sensitivity analysis of the CDQ questionnaire used to diagnose chronic obstructive pulmonary disease.
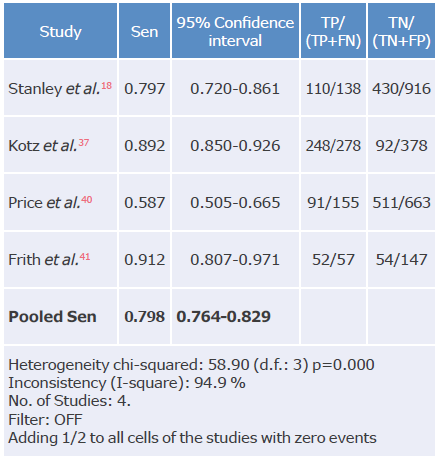
Spe: Specificity; TP: true positive; FN: false negative; TN: true negative; FP: false positive.
Source: Own elaboration.
Table 18 Specificity analysis of the CDQ questionnaire used to diagnose chronic obstructive pulmonary disease.
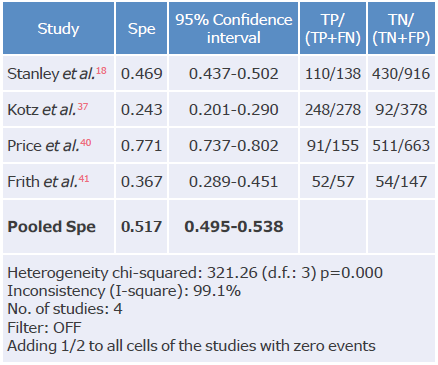
Spe: Specificity; TP: true positive; FN: false negative; TN: true negative; FP: false positive.
Source: Own elaboration.
Table 19 Positive likelihood ratio analysis of the CDQ questionnaire used to diagnose chronic obstructive pulmonary disease.
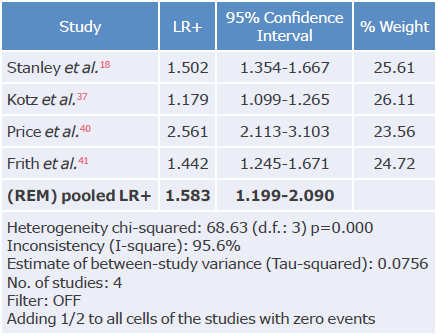
LR+: positive likelihood ratio; REM: random effects model.
Source: Own elaboration.
Table 20 Negative likelihood ratio analysis of the CDQ questionnaire used to diagnose chronic obstructive pulmonary disease.
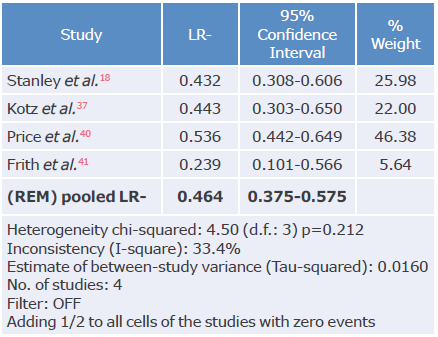
LR-: negative likelihood ratio; REM: random effects model.
Source: Own elaboration.
Table 21 Diagnostic odds ratio analysis of the CDQ questionnaire used to diagnose chronic obstructive pulmonary disease.
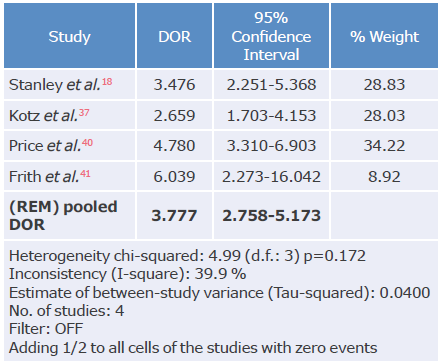
DOR: diagnostic odds ratio; REM: random effects model.
Source: Own elaboration.
Source: Own elaboration.
Figure 25 Forest plot for sensitivity of the CDQ questionnaire used to diagnose chronic obstructive pulmonary disease.
Source: Own elaboration.
Figure 26 Forest plot for CDQ questionnaire specificity for the diagnosis of chronic obstructive pulmonary disease.
Source: Own elaboration.
Figure 27 Forest plot for positive likelihood ratio of the CDQ questionnaire used to diagnose chronic obstructive pulmonary disease.
Source: Own elaboration.
Figure 28 Forest plot for negative likelihood ratio of the CDQ questionnaire used to diagnose chronic obstructive pulmonary disease.
Source: Own elaboration.
Figure 29 Forest plot for diagnostic odds ratio of the CDQ questionnaire used to diagnose chronic obstructive pulmonary disease.
Source: Own elaboration.
Figure 30 Summary of sensitivity, specificity, and positive and negative likelihood ratios of the CDQ questionnaire.
Discussion
The present article is the literature review with the largest number of publications on clinical questionnaires for the diagnosis of COPD to date. The latest systematic review on this topic was conducted by Haroon et al.32 in 2015 and included five studies, finding that the most relevant questionnaire was CDQ. In that study, the researchers reported no additional evaluations of other currently available instruments such as COPD-PS and LFQ, which show different diagnostic yields.25
In total, 19 publications that evaluated the validity of different questionnaires available for the diagnosis of COPD confirmed through spirometric values were included in the present study. The evaluated articles were conducted in different populations around the world and included subjects treated in outpatient and inpatient settings.24,34-36
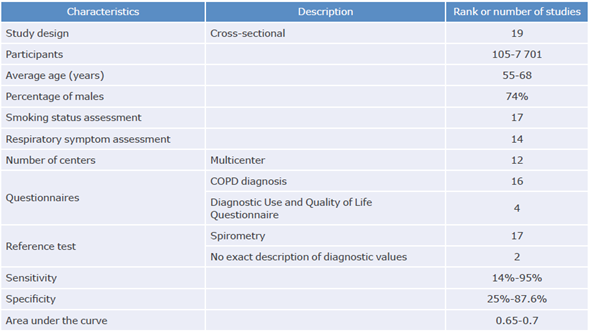
The overall analysis showed that the epidemiological design used in the studies was cross-sectional and that the minimum number of study subjects was 707 patients, which coincided with the reports by Haroon et al.32 Moreover, although only 40% of the studies reported overall statistical power or sample size, all reported information that allowed determining an overall statistical power of 80% to evaluate the scales' operational characteristics. Most studies were multicenter, and smoking status and respiratory symptoms were explicitly reported; the evaluation process was not specified only in a small number of studies.
Overall sensitivity of the questionnaires was 68.1% (95%CI: 66.7-69.4), while overall specificity was 64.9% (95%CI: 64.3-65.5), which agreed with the study by Haroon et al.32 where sensitivity and specificity were 64.5% (95%CI: 59.9-68.8) and 65.2% (95%CI: 52.975.8), respectively. Also, these results were similar to those reported by Spyratos et al.,25 who evaluated the diagnostic performance of the IPAG (≥17), COPD-PS (≥5) and LFQ (≤18) questionnaires in a population of 3 234 individuals, finding sensitivity between 55% and 79%, and specificity between 68% and 90%. Such values decreased when their use was analyzed in the group of patients with under- or over-diagnosis of COPD, where sensitivity was between 50% and 74% and specificity between 69% and 91%; however, the sensitivity and specificity values of the three questionnaires grouped together were not presented in this article.
The study with the most weight for sensitivity and specificity was the one conducted by Calverley et al.36 in which 7 701 subjects were evaluated, finding sensitivity of 85%; however, the highest sensitivity was described by Martínez et al.27 and Mintz et al.,38 both with a value of 97% and a population that together totaled 1 195 subjects. It should be noted that the GOLD, ATS and ERS criteria were used in these 3 studies to diagnose COPD, but the differences found were associated with the type of questionnaire used, namely, COPD-PS, CAPTURE, or LFQ. On the other hand, Murgia et al.35 reported the lowest sensitivity in an urban population of 3 892 subjects when evaluating the COPD-PS questionnaire; it should be noted that the studies by Calverley et al.36 and Murgia et al.35 were conducted in people from the community, while Martínez et al.27 and Mintz et al.38 assessed outpatients, which could affect to some extent the results obtained, even though the prevalence of the disease especially affects the positive predictive results.
The highest specificity was reported by Kim et al.39 and Murgia et al.,35 90% and 100%, respectively; both studies evaluated the COPD-PS questionnaire in people from the community and outpatients, where the prevalence of the disease may be lower, as well as the respiratory symptomatology reported by patients. In turn, Mintz et al.38 reported the lowest specificity with the LFQ questionnaire in outpatient subjects, which may eventually be explained by the nature of the questions and the differences in the scores.20,38
The highest positive likelihood ratio was reported by Murgia et al.35 with 18.4, while the lowest was reported by Mintz et al.38 with 1.03. The highest negative likelihood ratio was described in the study by Martínez et al.27 with 0.06, and the lowest in the study by Murgia et al.35 with 0.94, thus showing great variability of results that can be explained mainly by the different types of questionnaires analyzed and the population evaluated.
The overall ROC AUC was 0.759, which was sufficient to discriminate between subjects with and without the disease; however, questionnaires with various cut-off points could also affect the validity results previously discussed, even being necessary, eventually, to consider different cut-off points according to the specific population characteristics.17,18 Nevertheless, the ROC AUC obtained suggests that the approach to COPD diagnosis is quite acceptable with all the questionnaires included in the study.
Sensitivity values obtained through the questionnaires evaluated are higher than those of the individual evaluation of respiratory symptoms that can be made based on the clinical history since the isolated sensitivity of history of smoking is 30-40%; expectoration, 20%; wheezing, 51%; dyspnea, 27%; and cough, 51%. This suggests that joint assessment of respiratory symptoms with targeted COPD questionnaires is superior,46-50 but specificity is similar and sometimes lower; for example, absence of dyspnea has a specificity of 88% for absence of disease.
The combined use of questionnaires and portable pulmonary function test equipment is another option for diagnosing COPD,51 and their combination can increase diagnostic performance by increasing sensitivity and specificity.52 In this regard, Sichletidis et al.43 evaluated the use of the PiKo-6 portable device in combination with the IPAG questionnaire and found a sensitivity of 72% and a specificity of 97%; likewise, Kim et al.,39 in a population of 179 subjects, found that the ROC AUC was 0.759 with the use of a portable spirometer, being superior to the value of the respiratory symptom evaluation and the use of the questionnaire alone. Nevertheless, the use of this type of device is more expensive and may require trained personnel, generating higher costs for COPD screening.53,54
The large heterogeneity of the final analysis may be associated with several conditions such as the use of different types of questionnaires, which have different questions and scores. Another cause could be related to the characteristics of the populations evaluated, with differences between people from the community, outpatients, and patients with specific risk factors. Also, some studies used the FEV1/FEV6 spirometric parameter, while others utilized the FEFi/CVF ratio after using B2 <0.7. All these situations, added to the large number of studies included in the analysis, affect the heterogeneity of the results;55,56 however, in general terms, the risk of bias was low, and the applicability of the questionnaires was satisfactory.
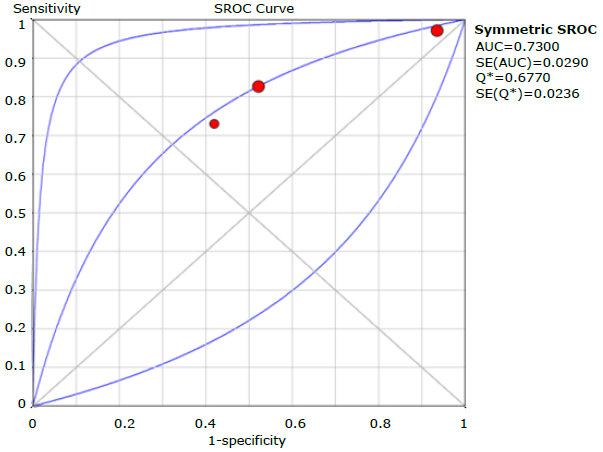
Regarding the evaluation of the questionnaires separately, COPD-PS reported the highest performance with a cut-off point of 4, sensitivity of 0.673 (95%CI: 0.653-0.692), specificity of 0.663 (95%CI: 0.655-0.651), and ROC AUC of 0.750; followed by LFQ with a cut-off point of 18, sensitivity of 0.840 (95% CI: 0.806-0.871), specificity of 0.312 (95% CI: 0.289-0.336), and ROC AUC of 0.730; and CDQ with a cut-off point of 16.5, sensitivity of 0.798 (95% CI: 0.764-0.829), specificity of 0.517 (95% CI: 0.495-0.538), and ROC AUC of 0.727. It should be noted that, with regard to the other questionnaires described in the introduction, only one study was found for each instrument, which prevented the synthesis of the results.
Despite the validity results, data on the reproducibility of the questionnaires are scarce. Martínez et al.27 report an intraclass correlation coefficient between 0.86 and 0. 91 when performing the before-and-after test with the COPD-PS questionnaire, thus leaving the possibility of delving into the reliability data of the questionnaires and the cost-effectiveness and cost-utility analysis.
Conclusions
In general, clinical prediction instruments for diagnosing COPD have an acceptable performance since the sensitivity values obtained are superior to those obtained with the individual assessment of respiratory symptoms based on the clinical history. The COPD-PS, LFQ and CDQ questionnaires have a similar performance for the diagnosis of this disease since they present large heterogeneity in the results of the studies evaluated.