


 English (pdf)
 Article in xml format
 Article references
 Send this article by e-mail
 Cited by SciELO
  Cited by Google
  Similars in
SciELO
Similars in
SciELO  Similars in Google
 Permalink
Introduction
Several authors have described an association between sarcopenia syndrome and increased risk of falls,1 decline in activities of daily living,2 heart disease,3 respiratory disease,4 and cognitive disorders.5 Furthermore, sarcopenia has been identified as a potential causal mechanism that, when combined with other states of acute or chronic disease, increases health-care costs associated with diagnosis, treatment, and follow-up.6,7
Between the ages of 30 and 50, sarcopenia causes a loss of lean muscle mass, which increases after the age of 70. According to the methodology and procedures employed, 0.22kg of lean muscle mass is lost per year, for a total of 4.17kg over a 20-year period, which can increase to 19.8kg after age 60. In addition, peripheral and visceral fat mass can increase by 0.45kg every year, reaching 8.98kg in the age group studied.8,9
Sarcopenia is also characterized by muscle weakness, affecting the ability to perform simple and complex loco -motor activities without partial or total external support. In this regard, handgrip strength (HS),10 batteries for measuring physical capacity such as the Short Physical Performance Battery (SPBB),11 and tests that determine gait speed in lower limbs12,13 have been used as functional diagnostic tests to detect and classify the level of weakness and autonomy. The aim of these instruments is to measure the impact of sarcopenia on the ability to perform simple and complex movements on a given space, taking time or muscle tension as indicators.
However, the various records of muscle mass loss (e.g., total body mass, appendicular mass, or absolute mass) and function markers (e.g., strength or gait tests) should be used with caution, as they could lead to diagnostic errors. For instance, when appendicular lean mass is estimated, it is possible to observe that the damage in the lower limbs is greater than in the upper limbs, and that the distribution between lean mass compartments and fat differs depending on the sex of the individual.14
Moreover, the handgrip strength test, the gait speed test, or other functional tests should be interpreted with caution because values and indicators are variable (e.g., force indicators vs. speed indicators) and the individual may be misclassified. In this sense, the specificity of the tests and protocols applied for diagnostic purposes in the proposed algorithms, tests and indicators15,16 should be strengthened to avoid overestimating or underestimating both sarcopenia (low muscle quantity and quality) and sarcopenia associated with functionality (manifestations of low muscle strength, poor intramuscular and intermuscular coordination, low transfer to simple and complex movements). With all this in mind, the objective of this study was to analyze sarcopenia markers and their relation to the strength and gait in physically active older women between 55-76 years old.
Materials and methods
This is an analytical observational study conducted in physically active women aged between 55-76 years.
Selection process
178 white Colombian women were recruited through community local physical activity groups in Medellín, Colombia, and divided into two groups based on age (group 1: 55-66 years, n=98; group 2: 67-76 years, n=80). The programs were characterized by sessions with a frequency of 3-5 days-week, one hour per session, and a focus on maintenance routines with non-specific content in the previous year (i.e.: strength, endurance, flexibility, stretching, rehabilitation exercises, health talks).
Inclusion criteria
Age range between 55 and 76.
Female sex.
Energy expenditure during physical activity greater than 600 MET measured by the International Physical Activity Questionnaire (IPAQ).17,18
Participants in physical activity programs for a period of not less than one year.
Medical authorization for physical activity.
Sampling and selection technique
A pilot test was carried out on 15 individuals who were not included in the study (G1: 8 and G2: 7) to adjust and control selection, memory, confounding and procedural biases, as described in the theory.19 These individuals were active participants of community programs who performed physical activity in the last 15 years, with a maintenance physical activity frequency of three days a week, 1 hour per session, combining activities by periods (e.g.: dance, swimming, aerobics, yoga, recreation, others), using Börg scale self-perception as control of physical effort, and with instructions to control physical efforts with a self-perception between 2 to 6. All individuals sustained two periods of rest of 30 days at the end of each semester. This group of women volunteered to take part in the pilot study in exchange for free clinical consultations, laboratory tests, and professional feedback from the research team.
Finally, the universe size was 280 women distributed in different community program groups, which, together with the variance in heel support force for the gait test, was considered to estimate sample size through the following equation (Table 1):20
Table 1 Estimation of sample size.
| Item | Values |
|---|---|
| Za: Z-value corresponding to the desired risk confidence (95%) | 1.96 |
| Zb: z value corresponding to the risk power (95%) | 1.96 |
| S: Variance of variable (pilot test) | 100 |
| d: Minimum difference between the two groups (maximum strength of heel support) | 8 Newton (N) |
| Sample size in each group | 39 |
| Percentage loss (10%) | 4 |
| Sample adjusted to the loss of each group | 43 |
Note: although each group could be made up of 43 subjects for a total of 86 individuals, the sample sized was increased to 120 (60 for each group) or more to guarantee data normalization and support the statistical model to be applied.
Source: Own elaboration.
In this way, 178 physically active women, recruited by open call, were f inallyincluded. Considering that allthe studied variables are modified by age, two groups were created (group 1: 55-66 years, n=98; group 2: 67-76 years, n=80).
Description of procedures, instruments, and protocols
Firstly, the International Physical Activity Questionnaire (IPAQ), the Physical Activity Readiness Questionnaire (PARQ) ,21 and the Physical Activity Readiness Medical Examination (PARmed-X)22 were applied to assess health status and level of physical activity.
Second, information on total mass (kg), fat mass (kg), fat percentage, total lean mass (kg), upper and lower limb lean mass (kg), and total bone mass (kg) was obtained; to this end, dual X-ray absorptiometry (DXA)23 was used with a Hologic Discovery Wi analyzer and the software APEXTM version 4.5.3. In order to classify the level of sarcopenia, appendicular lean mass (appendicular lean mass/heigth2 (kg/m2)) with two cut-off points was considered, as well as absolute mass (absolute muscle mass/heigth2 (kg/m2)) with three cut-off points.23
Third, an Opto Gait® infrared system24 was used to evaluate squat jump (SJ), countermovement jump (CMJ), and countermovement jump with arm swing (CMJAS).25 Kinematic indicators of power, jump height, hang time and take-off speed were obtained for each technical movement (SJ/CMJ/CMJAS). Some studies report on the reliability and validity of these procedures in older adults.26 27
Fourth, a handgrip protocol suggested by the European Working Group on Sarcopenia in Older People was included. The individuals sat with the arm abducted, the elbow bent at 90°, and the wrist in neutral position, holding a handheld dynamometer supported by the tester from the base. Three measurements were made until the maximum value of the three grips was obtained, with a 30-second pause, recording the highest value in kilograms, both for the dominant hand and for the non-dominant hand.28
Finally, the Optogait RX Microgate® and Racetime 2 Microgate® optical data collection systems were used to perform a high-precision analysis of the gait pattern (slow vs. fast), obtaining the gait speed reached (m/s).24
The instruments were applied in the order presented below (Figure 1).

Statistical analysis
The Kolmogorov-Smirnov test and a graphical representation of normal distribution were selected to assess the normality of the variables. Considering the conditions of sample size, homogeneity, and homoscedasticity, parametric tests were applied to establish a table of descriptions using student's T-test.
During the analytical stage, a multiple linear regression analysis was made to generate a model that allowed establishing the possible correlations between HS and gait indicators (dependent variables), and body composition indicators (independent variables). In order to get to this stage of the analysis, correlations were made to measure the intensity of the association; those with r≥80% were used in the next stage of the process. To apply multiple linear regression, non-multicollinearity, homoscedasticity, independence of errors, normal distribution of errors, independence, and linearity were verified. An analysis of variance was also made using the Fisher's F-test for comparison purposes, which allowed assessing whether the regression model was adequate to estimate the values of the dependent variable.
The statistical analysis was completed by including the odds ratio (OR) statistical measure of association of sarcopenia with strength and gait indicators. All analyses were conducted considering 5% differentiation levels with a 95% confidence interval, and p-values <0.05 for statistical significance. The descriptive and analytical processing for this study was done in the SPSS software, version 25.
The present study meets national and international standards for research involving human subjects, specifically the latest version of the World Medical Association's Declaration of Helsinki 29 and Resolution 8430 of 1993 of the Colombian Ministry of Health.30 It was approved by the Ethics Committee of the Universidad de Antioquia under bioethical registration number CE 001-2017 of February 28, 2017. The participants were informed about the study, its objectives, the tests to be applied, the risks of the procedures, the use of the information, and the responsibility held by the research team, and after agreeing to the conditions, they signed and placed their fingerprint on an informed consent form.
Results
The morphological and functional characteristics of the sample are described in Table 2. A significant difference was observed when the applying the Student's t-test (p<0.05) for age, BMI, and waist-height ratio (WHR).
Table 2 Morphological and functional profile of physically active older women (total sample size: n=164; group 1: 56-66 years; group 2: 66-76 years).
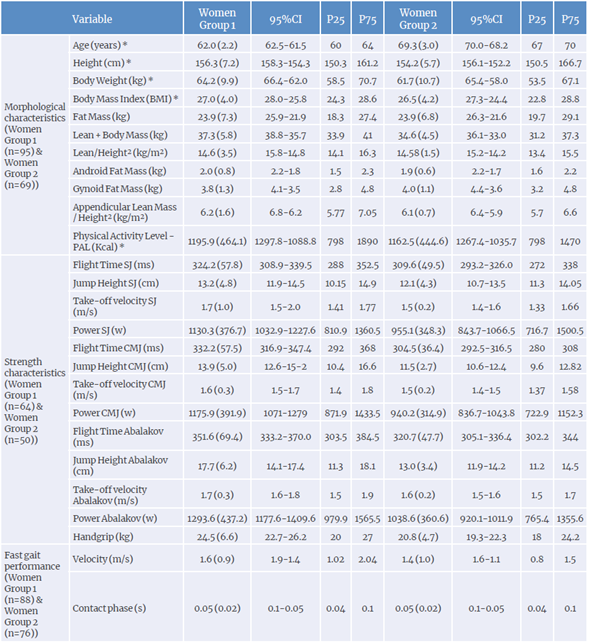
* p-values ≤0.05.
Source: Own elaboration.
Multiple regression model forG1 (56-66years): the ANOVA for the regression model indicated that independent variables significantly improved power prediction for all jumps (SJ: f=11.818, p=0.001. r2=0.56; CMJ: f=9361, p=0.001, r*=0.51; CMJAS: F=14.556, r2=0.60, p=0.001) but not HS (F=10.313 p=0.009. R2=0.20). This showed that fat negatively alters the manifestation of power and HS, while appendicular lean mass favors the expression of powerfor all jumps (Table 3A) .
Table 3 Linear regression models for strength and body composition indicators based on age groups (total sample size n=114; G1: 56-66 years, n=64; G2: 66-76 years, n=50).
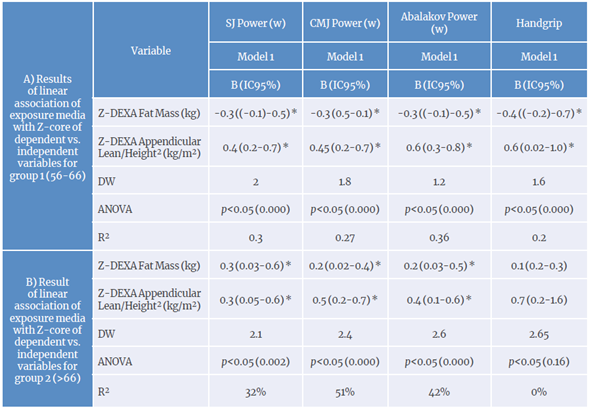
SJ power: squat jump power ; CMJ power: countermovement jump power.
* p-value <0.05.
Source: Own elaboration.
Multiple regression modelfor G2 (>66 years): body fat and appendicular mass/height2 coefficients were positive and significant, whichexplains the varianceof the jumping power (SJ: R2=0.32. DWI =2.14; CMJ: R2=0.51. DW2=2.38; CMJAS:
R2=0.41. DW3=2.56), but not of HS (R2=0.02. DW4=2.65). However, readings must be made with caution because including only fat mass in the model may cause the ANOVA of the regression model to show that there is no significance with jumping powers for fat mass only (SJ: F=7.68, p=0.08; CMJ: F=16.90, p=0.07; CMJAS: F=11.08, p<0.085; HS: F=1.14, p<0.28). when accompanied by appendicular lean mass/height2, the model changes, implying that appendicular lean mass allows for more accurate prediction of lower limb power (SJ: F=5.942, p=0.021; CMJ: F=19.018, p=0.000; CMJAS: F=10.89, p<0.02), but not for HS (f=2.66, p<0.10) (Table 3B).
Fat mass was positively and significantly associated (p<0.006) with the high-speed contact phase for G1, indicating that the 0.15 increase in the Z-value of the high-speed contact phase is caused by the R2=20% variation of the change of a unit in the Z-value of fat mass weight. In contrast, for G2, each change in the Z-value of fat mass weight leads to a 0.28 decrease in the Z-value of high-speed contact phase with a positive and significant association (p<0.000), explaining R2=29% of the variation in the changes presented; also, the Z-value of stride distance increases by 0.024.
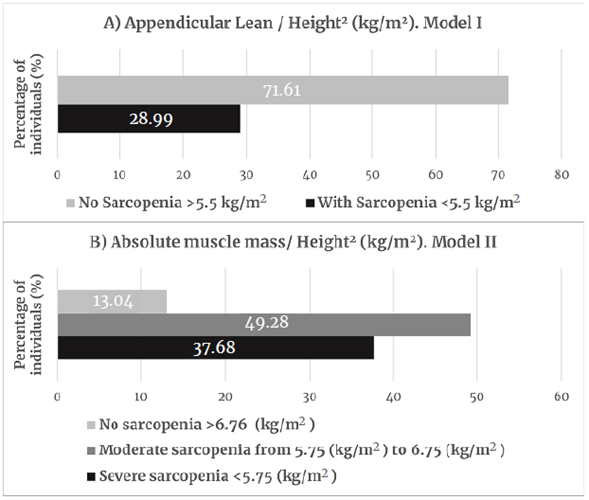
When body compartments were analyzed, although these older women were members of physical activity groups, they had high or very high body fat values for their age (G1: 59%; G2: 45%) and a low lean mass (G1: 16%; G2: 47%). When using appendicular mass values, 13.3% of G1 women and 8% of G2 women had muscle impairment. However, when taking absolute mass records, 68.11% of G1 women and 86.96% of G2 women were found to have moderate to severe sarcopenia (Figure 2: Group 1; Figure 3 Group 2).
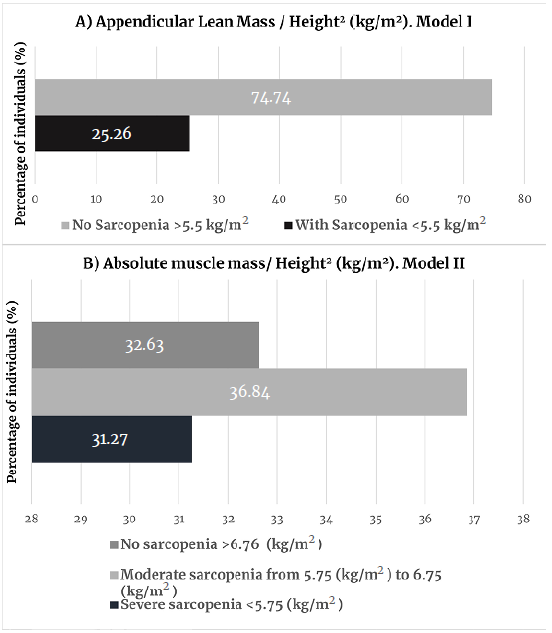
Source: Own elaboration based on Janssen et al.31 and Janssen et al.32
Figure 2 Classification of sarcopenia for group 1 (56-66 years, n=98).
In addition, taking the odd ratios for each group as a measure of association, women in groups 1 and 2 with sarcopenia were 3 and 2.2 times, respectively, more likely to have poor gait speed. Similarly, the association between lower limb power and having or not sarcopenia was analyzed, finding that the women in G1 who did not have sarcopenia were 2 times more likely to have high power, a result that was not observed in G2.
Discussion
The results obtained fulfill the study's objective of analyzing sarcopenia markers and their relationship with strength and gait in physically active older women aged 55 to 76. However, there are limitations when comparing the results with other studies reported in Colombia33,34or other South American countries,35 due to the profile of the individuals and the diversity of protocols used to study the phenomenon of sarcopenia.
In this regard, the BMI and fat percentage values obtained in the present study for both groups are similar to those reported by Castro et al.36 in a Colombian population (BMI=26.5; fat%=38.9) and Ramírez et al.37 in Brazilian older adults (BMI=26.6-26.9; fat%=37.1-37.7), but are slightly lower than those reported by Arroyo et al. 38 in a Chilean population (BMI=28.5; fat%=37.63). Therefore, it is necessary to evaluate the variables and programming models applied in physically active women, since the values of the present study should be significantly lower than those of sedentary women.
The prevalence of sarcopenia, classified using appendicular values, found in G1 (25.26%) and G2 (29%) are within the prevalence range reported for older women in the USA (25-40%),39 but these values are lower than those reported for this population in Chile (42.5%)40 and Spain (33%),41 and higher than those described for older women in France (23.6%)42 and Taiwan (18.6%).43 However, when such prevalence values are reported taking into account absolute muscle mass, the cumulative values for sarcopenia (moderate and severe sarcopenia) are 68.1% (G1) and 86.9% (G2), respectively. These figures are higher than those described in the NHANES III study,39 which found that 35.4% of apparently healthy women had sarcopenia. It should be noted that in the NHANES study, when the obesity variable was considered, the prevalence of sarcopenia increased to 60.6%, confirming that obesity is a condition that raises the risk for sarcopenia. As a potential implication for future research, the present results may suggest the need to establish specific cut-off points for detecting sarcopenia in physically active or sedentary women.
Concerning functionality, when analyzing the low-and high-speed gait values, the average speed is within the reported healthy range (low-speed gait between 0.60-1.45 m/s; high - speed gait between 0.84-2.1 m/s).44 According to these authors,44 these values are poor when compared to those in young adults, but they describe a positive performance considering the age and non-specific physical activity of the groups studied. In addition, it has been suggested that figures lower than 1 or 0.80 m/s15,45 are signs of functional impairment associated with sarcopenia, contradicting the results of this study, which found individuals with healthy gait values, but with acute or severe sarcopenia (Figures 2 & 3). In that sense, while the gait speed parameter may be useful as a first reference, it may be limited to confirm the quality of the individual's movement in a horizontal plane,46 as well as the characteristics of muscle tissue.47
With respect to muscle strength loss, the importance of evaluating these changes using low-cost and easy to apply methodologies such as HS has been proposed.15 However, correlation and regression analyses may suggest that this indicator is associated with fat and appendicular lean mass in G1, but not in G2. In addition, HS does not explain the variance of power in lower limbs or the gait parameters in both groups. Some factors that could explain these differences between HS, lower limb power, and gait parameters are the percentage distribution of body compartments (i.e.: between upper and lower limbs, by age and sex),47 the use of an isometric methodology (with limited interpretation in dynamic actions), and the assessment of muscle activation in the dominant upper limb, when greater loss due to age has been reported in the lower limbs.48
Furthermore, this study assessed the functional parameters of the lower limbs using multishocks at different angles. In this respect, the jump height indicators for G1 (SJ=13.13±4.80; CMJ=13.92±4.99; CMJAS=13.04±4.35) and G2 (G2: SJ=12.09±4.31; CMJ=11.52±2.72; CMJAS=13.03±3.45) are low compared to those reported by Gonzalez et al. 49 in active women (SJ=18.76±3.20; CMJ=23.81±4.07; CMJAS=23.81±4.07), even among sedentary women (SJ=12.69±7.01; CMJ=13.9±7.95; CMJAS=18.56±8.19). Some elements that can explain these results are the non-specificity of the physical activity, the control of programming variables, the contents used, among others. In fact, Kalapotharokos et al.,50 Frontera et al., 51 and Hazell et al.52 report that physical activity programs applied to older adults can improve nervous processes and increase strength and lean muscle mass, so proper planning should be ensured, as well as the control of learning bias in assessment tests using sensitization phases specially designed for these communities.
The limitations of the study include the poor participation of men over 60 years of age in physical activity programs, the low diagnostic capacity of the handgrip strength test in individuals over 65 years of age, as well as the number of individuals who were not able to take part in the lower limb strength assessment with the proposed protocols and procedures. Other alternatives should be considered for procedures in individuals classified as medium to high risk, with or without functional involvement.
With this in mind, further studies should expand the research with sufficient causal models to discriminate sarcopenia between active and sedentary individuals, with cut-off and reference points for the Latino or Hispanic population, by type of physical activity, and in relation to total time in years by health/illness habits and by sex.
Conclusion
Recording fat and appendicular mass allows studying negative changes in lower limb strength and their effect on gait pattern, as well as identifying the type of sarcopenia and functional autonomy disorders in physically active Colombian women aged 55 to 76 years.
Taking this into account, and even though a wide range of tests and tools are now available for characterization of sarcopenia both in the clinical practice and in research contexts, health professionals must be careful to avoid making an inadequate clinical and functional diagnosis in older Colombian women. Also, the criteria used for diagnosis may affect the prevalence of sarcopenia, and thus the economic burden of the disease may be underestimated.

