


 English (pdf)
 Article in xml format
 Article references
 Send this article by e-mail
 Cited by SciELO
  Cited by Google
  Similars in
SciELO
Similars in
SciELO  Similars in Google
 Permalink
Introduction
Throughout history, humanity has endured more than twenty pandemics that are now considered historical milestones, such as the Antonine Plague, the Black Plague, the Spanish Flu, the bubonic plague, and severe acute respiratory syndrome.1-3 These epidemics had a significant impact on society, as they severely affected the political, economic and social scenarios at the time by causing millions of deaths.2-6
Currently, COVID-19, a disease caused by the SARS-CoV 2 virus and declared a pandemic by the World Health Organization (WHO)7 on March 11, 2020, represents a threat to global public health in view of the consequences of previous pandemics.
As of May 2021, more than 168 million people had contracted COVID-19 and nearly 3.5 million deaths had been attributed to this disease.8 Given the rapid spread of the virus and the dramatic increase in cases and deaths, at the beginning of the pandemic, governments implemented various containment and prevention measures, including social distancing and restrictions on economic and social activities.9
Most countries opted to follow WHO recommendations to address this pandemic, which focused on increasing hygiene measures and implementing social distancing and isolation measures. However, some governments, like the United Kingdom, chose to implement other prevention and control strategies such as herd immunity (HI), in which a significant proportion of the population was expected to become infected and cured, thus generating immunity to the virus and preventing its spread10 (Figure 1). It is worth noting that the latter model prioritizes economic interests.11
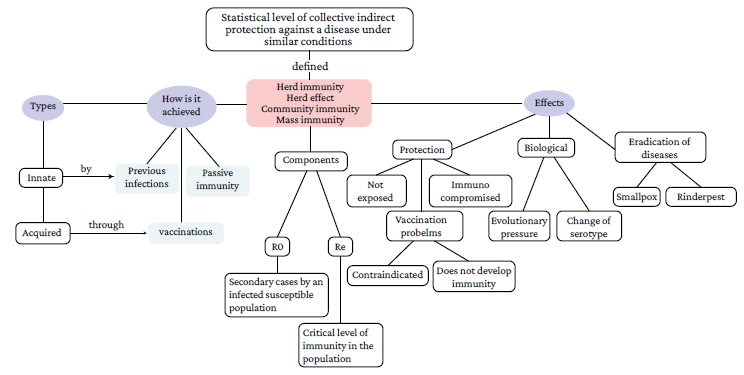
RO: basic reproduction number; Re: effective reproduction number. Source: Own elaboration.
Figure 1 Herd immunity epitome.
In Peru, the government quickly adopted WHO recommendations, which include mandatory social isolation, border closure (maritime, air and land), social distancing, massive increase in diagnostic tests, and isolation of positive cases. At the time of preparation of this manuscript, the country was going through Phase 4, or phase of sustained disease outbreaks.12
The pandemic prevention and containment models described above suggest different strategies for dealing with the disease in different socioeconomic contexts. Therefore, analyzing these strategies will make it possible to understand the evolution of the pandemic in both countries and the achievements of each strategy with respect to the control of the spread of the virus (number of COVID-19 cases and related deaths).
In this sense, the objectives of the present study are to compare the COVID-19 pandemic containment strategies implemented in Peru (WHO's containment and social distancing strategy) and the United Kingdom (HI strategy) in terms of morbidity and mortality, constantly emphasizing their social impact during the pandemic. Also, it aims to simulate the implementation of HI in Peru during the early stages of the pandemic, detailing what health and epidemiological indicators would have been obtained in the country if this strategy had been used.
Materials and methods
Study design
Exploratory study. A strategy simulation model was implemented based on official data from the United Kingdom (https://coronavirus.data.gov.uk/details/testing) and Peru (https://covid19.minsa.gob.pe/sala_situacional.asp) obtained at the onset of the COVID-19 pandemic (first 55 days after the report of the first case in the United Kingdom [January 30 to March 24] and after the beginning of the WHO-recommended containment and prevention strategy implementation in Peru [11 March to 4 May]).13-15
In the United Kingdom, the first COVID-19 case was reported on January 30, 2020, and a state of emergency was declared on March 2. Initially, and for the first 55 days, that is, until March 24, the HI strategy was implemented, followed by the WHO-recommended strategy of social confinement and distancing.13-16
On the other hand, in Peru, the first COVID-19 case was reported on March 6, 2020, and the state of emergency for this disease was declared on March 11; from the beginning, only the strategy recommended by the WHO was applied.16
Thus, the first stage of this study focused on evaluating the impact of both interventions in terms of mortality and infection rates in both countries, and the second on simulating the implementation of the HI strategy in Peru during the onset of the pandemic.
Strategy comparison
To compare the impact of the strategies implemented in Peru and the United Kingdom, the following official data were collected for each country during the first 55 days after the report of the first COVID-19 case in the United Kingdom and after the beginning of the implementation of the containment and prevention strategy recommended by the WHO in Peru (follow-up period): number of people with COVID-19, cumulative and adjusted mortality rates per 100 000 inhabitants, case fatality rate of the disease, and number of screening tests used.
HI simulation
In order to simulate the impact of the HI strategy implementation in Peru at the initial stage of the pandemic, an analysis of the data available for the study period was performed. This simulation was conducted based on the WHO guidelines17 and included the following information: basic reproduction number (R0), critical proportion (Pcrit) of individuals needed to achieve collective immunity, and proportion of infected persons; the mortality and case-fatality rates reported in each country for the study period were also taken into account. Pcrit. was calculated using the following formula:
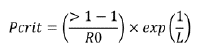
where Pcrit is the population that should remain immune to achieve HI, L is life expectancy at birth, and the estimated R0 was 2.87.18,19
The epidemiological simulation curve was constructed using the Epidemic calculator tool (https://gabgoh.github.io/COVID/index.html), a free software designed to calculate the risk of exposure to a disease, which considers the following variables: population dynamics, R0, time of transmission, time of recovery, mortality, and hospitalization.
Simulation data are expressed as cumulative and adjusted mortality rates per 100 000 population, infection rate, hospitalization rate, and rate of recovery from the disease. The British and Peruvian population used for the study was 67 650 542 and 32 625 948, respectively.
The simulation was based on official data released about COVID-19 in Peru as of November 27, 2020,14 and the characteristics of the Peruvian population published by the National Institute of Statistics and Informatics until 2020.15
Statistical analysis
Data were obtained directly from the servers of each country and reviewed by two authors independently. Descriptive analysis of the epidemiological data of each strategy was carried out using simple and relative frequencies. Data normality was assessed using the Kolmogorov-Smirnov test.
Differences between the strategies evaluated in both stages of the study were determined using Student's t-test for related samples with a 95% confidence interval (CI) and a significance level of p<0.05. All statistical analyzes were performed in SPSS v22.0 and Epidat Info v4.0.
Ethical considerations
The study took into account the ethical principles for conducting medical research and for the management of free secondary data published by the ministries of health of each country.13-15
A review of both countries' databases enabled the identification of epidemiological data from the COVID-19 pandemic. During the follow-up period, 15 034 positive cases were documented in the United Kingdom and 33 931 in Peru.
Table 1 presents the COVID-19 data reported during the follow-up period in each country, showing that, despite the containment strategy (which includes strict isolation, social distancing, state of emergency, etc.) used in Peru, the number of positive cases was higher than the figures reported in the United Kingdom (which did not implement this containment strategy until day 55, and instead maintained the HI strategy by implementing changes and restrictions progressively). It is also evident that although the case fatality rate was higher in the United Kingdom (7.82% vs 2.74%), the cumulative mortality rate was higher in Peru (2.89 vs 1.74 per 100 000 inhabitants).
Table 1 Comparison of COVID-19 prevention and containment strategies implemented in the United Kingdom and Peru during the follow-up period.
| Characteristics | Country | |
|---|---|---|
| United Kingdom | Peru | |
| Total positive cases | 15 034 | 33 931 |
| Accumulated deaths | 1 176 | 943 |
| Case fatality rate (%) | 7.82 | 2.74 |
| Mortality rate (per 100 000 population) | 1.74 | 2.89 |
| Tests performed | 10 949 * | 28 650 t |
* Based on official UK government data published as of day 51 (March 20, 2020) following the first reported case.
† This value includes molecular tests and rapid tests.
Source: Own elaboration.
At the end of the follow-up period, significant differences were observed in the number of infected persons and deaths between the two countries (p=0.0001). Figure 2 shows a comparison of positive cases and the number of deaths reported in Peru and the United Kingdom, evidencing a directly proportional relationship between time and mortality, since, as days passed, mortality in the United Kingdom continued to increase, mainly because of the epidemiological changes of COVID-19 experienced in that country after day 40, which led the British government to consider changing the initial strategy, namely, HI. Also, while Peru had a higher number of infections in fewer days, in both countries the number of cases and deaths rose sharply in the last 10 days, with the increase being much more marked (particularly for mortality) in the United Kingdom.
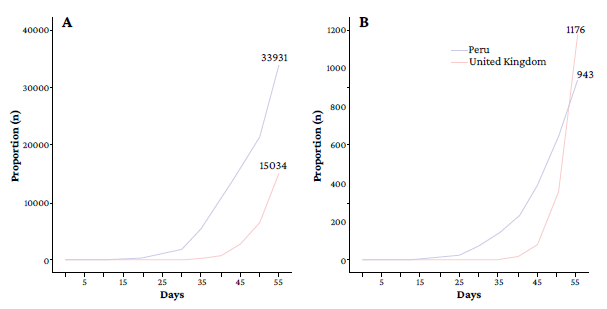
Source: Own elaboration.
Figure 2 Cumulative number of COVID-19 infections (A) and deaths (B) in the United Kingdom and Peru during the follow-up period.
The daily analysis of infections and deaths showed progressive increases for both countries. Figure 3 demonstrates that both the HI and containment strategies, followed in the United Kingdom and Peru, respectively, were ineffective in reducing infection and mortality levels, as a progressive increase in these epidemiological components is evident in each country. Differences between daily infections in each country were statistically significant (p=0.0002), which was not the case for the number of daily deaths (p=0.371).
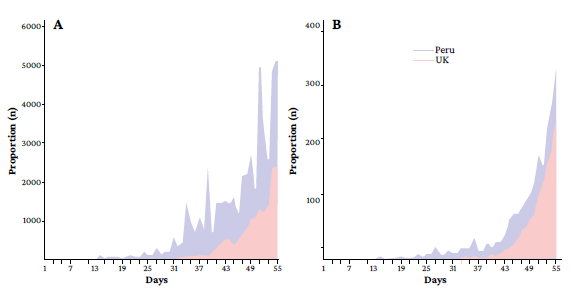
Source: Own elaboration.
Figure 3 Daily evolution of COVID-19 infections (A) and deaths (B) in the United Kingdom and Peru during the follow-up period.
On the other hand, regarding the simulation stage, it was determined that a Pcrit of 60% is required for the Peruvian population to reach HI. Thus, considering that the National Institute of Statistics and Informatics15 established that the Peruvian population for 2020 was 32 625 948 inhabitants, 19 575 569 infected individuals would be required to achieve HI in the country. Furthermore, taking into account that the hospitalization rate for COVID-19 has been estimated at 228.7 cases per 100 000 infected,20 according to the HI simulation model, in Peru this rate would be 44 770 cases per 100 000 patients with COVID-19 as of November 27, 2020. Finally, according to the simulation data, it is estimated that the case fatality rate due to COVID-19 as of November 27, 2020, would be 3.75%15 or 1 223 473.1 deaths if the HI strategy had been implemented in the country.
The comparison between the results of the HI simulation as an initial strategy in Peru and the actual data recorded in Peru and the United Kingdom as of November 27, 2020, is presented in Table 2.
Table 2 Herd immunity simulation data in Peru versus actual COVID-19 case and death data in the United Kingdom and Peru.
| Characteristics | Countries | ||
|---|---|---|---|
| Peru * | United Kingdom t | Peru t | |
| Total population | 32 625 948 | 67 650 542 | 32 625 948 |
| Accumulated deaths | 1 223 473 | 57 551 | 35 785 |
| Total cases n (%) | 19 575 569 (60 %) | 1 560 872 (2.31 %) | 956 347 (2.93 %) |
* Simulation of herd immunity implementation; data as of November 27, 2020.
† Official data as of November 27, 2020.
Source: Own elaboration.
The comparison of the simulation with the actual conditions in both countries reveals that more than 19 million positive cases would have been required in Peru to achieve HI, resulting in more than 1 million deaths during the epidemic curve. Similarly, when the data are entered in different scenarios, diverse health outcomes can be observed. Figure 4A presents the epidemiological curve without intervention or change of strategies (with R0=2.87), where the peak of the curve appears on day 104 with 3 189 014 infected, 1 671 405 hospitalized, and 270 381 deaths. Figure 4B depicts the epidemiological curve with intervention (strategy recommended by WHO) at 55 days (as in the UK), showing a subsequent reduction in transmission of 66.7% (R0=2.87-0.96); however, by day 200, data are still not significant enough to establish whether there is HI or not. Finally, Figure 4C displays the epidemiological curve during which HI would be reached in Peru, where the number of exposed and infected people is null and only 1.15% of the total population dies.
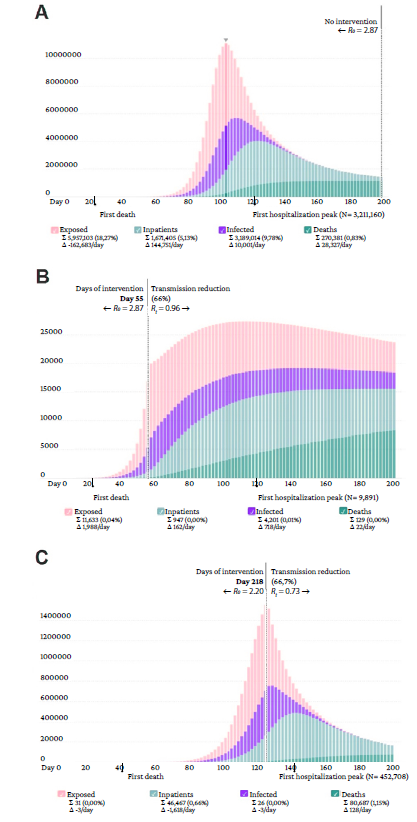
Source: Own elaboration.
Figure 4 Simulated epidemic curve for 200 days using the herd immunity strategy as an initial measure in Peru. A) epidemic curve without intervention or change of strategy (arrow indicates peak exposure); B) curve with intervention or change of strategy 55 days after the report of the first COVID-19 case in the country; C) curve identifying the day (218) in which herd immunity would be achieved (60%) in Peru.
It is noteworthy that significant differences were observed in the peak number of hospitalizations in the three simulations (no intervention: n=3 211 160, with intervention at 55 days: n=9 891, and with HI: n=452 708) (p=0.0022).
Discussion
The results of the present study showed that the HI strategy implemented in the United Kingdom led to a higher case fatality rate due to COVID-19, while confinement and social distancing measures implemented in Peru produced more than twice as many positive cases during the follow-up period.
In terms of cumulative death and case fatality, the mortality rate in Peru revealed figures that were discordant to those expected with the early implementation of the WHO-recommended containment strategy. In this regard, the simulation carried out in the present study demonstrated, on the one hand, the need to control both the number of cases and deaths in order to reduce the epidemiological curve and, on the other, that the use of the HI strategy would have resulted in a hospitalization rate of 44 770 cases per 100 000 patients with COVID-19, which would have saturated the health response capacity and caused more than 1.2 million deaths in Peru as of November 27, 2020.
According to the concept of HI, it may be assumed that the more infections there are, the more protected a given population will be; however, as indicated by Kwok et al., 21 the estimated number of people who could potentially die from COVID-19 while the population reaches the Pcrit HI level is not easy to accept. The present study established that a Pcit of 60% would be required to achieve the HI for SARS-CoV-2, in Peru. However, it is important to bear in mind that Britton et al. 22 in a study using a model to illustrate how population heterogeneity can cause substantial heterogeneity among infected individuals during the course of an infectious disease outbreak, established that P . varies among populations, because population heterogeneity can considerably impact disease-induced immunity, as the proportion of infected individuals in groups with the highest contact rates is greater than in groups with low contact rates.
Moreover, Okell et al., 23 in a study that analyzed whether deaths from COVID-19 in Europe had decreased due to HI, found that the reduction in cases and deaths from this disease is the result of prevention and containment measures such as strict confinement, social distancing, and other health interventions, rather than HI itself.
Although the United Kingdom initially opted for a strategy that allowed the transit and spread of SARS-CoV-2 to increase the population's HI, with certain parameters of care for populations at risk such as the elderly and individuals with comorbidities or chronic diseases,24 it had to move towards a containment strategy with stricter hygiene, biosecurity and physical distancing measures, as well as greater COVID-19 screening.9 This change in strategy, which was based on the sharp increase in positive COVID-19 cases and deaths due to this disease on the 55th day after the report of the first case in the country and endorsed by different universities in the United Kingdom,25 seems to have been successful since it led to a reduction in the number of cases.22
The analysis of the COVID-19 pandemic evolution in the United Kingdom is of great relevance, as it serves to establish that if favorable results were not obtained there with the HI strategy, it would be illusory and perverse to pretend that the implementation of this strategy in low- and middle-income countries, such as Latin American countries, would be effective.
Implementing the HI strategy requires, first, a robust and efficient health system, which in the case of the care during the current pandemic means adequate follow-up measures for recovered patients, sufficient availability of screening tests, and the improvement of the infrastructure of hospitals and health institutions (creation of exclusive treatment areas for patients with COVID-19). However, in low- and middle-income countries, such as Peru, this strategy would likely deplete health resources, which, in turn, would lead to an increase in mortality not only from COVID-19, but from other conditions.26
Like many countries in the region, Peru faces health challenges that have become evident due to the COVID-19 pandemic, including the lack of personal protective equipment, intensive care unit beds, specialized professionals, rapid containment response systems, and medical and diagnostic equipment and devices. The outcomes of the simulation conducted in the present study show that this situation would have resulted in a high number of positive cases and deaths from this disease if the HI strategy had been implemented.
Thus, in Peru, a strict and prolonged quarantine was implemented in order to avoid premature increases in new secondary epidemiological peaks since, as reported by Prem et al. 27 in a simulation study of the outbreak in Wuhan, the premature and sudden lifting of containment and prevention measures could lead to an earlier secondary peak, although, according to these same authors, it could be flattened by a gradual relaxation of these measures.
Nevertheless, extreme restrictions cannot be sustained in the long term while efficient, effective and safe vaccination is achieved, but it is necessary to resume economic and social activities following strict biosecurity measures in order to avoid economic, social and political crises28,29 that would affect the sustainability of all countries due to an imminent recession.
As a result of the COVID-19 pandemic, Peru is currently experiencing a health crisis (with health systems unable to adequately respond to the emergency), as well as a social and political crisis caused by high unemployment and poverty rates and the various instances of corruption that have been occurring recently.14 Consequently, the pandemic containment strategies could not be implemented in an effective manner, and, therefore, the control of the pandemic has been deficient.
While, as shown by the results of the simulation performed here, implementing the HI strategy in Peru would have been harmful to the population, several studies have described the possibility of generating HI regardless of the implementation of containment and prevention measures and the epidemiological characteristics of the pandemic.
For example, Gudbjartsson et al., 30 in a research conducted in Iceland, reported that antiviral antibodies to SARS-CoV-2 did not decline within 4 months after diagnosis, and Dan et al., 31 in a U.S. study of 254 samples from 188 patients with COVID-19, including 43 samples taken 6 to 8 months after infection, found that a substantial immunologic memory is generated after infection with SARS-CoV-2, with about 95% of cases retaining it for (approximately) 6 months after infection.
In any case, it should be stressed that the COVID-19 containment and prevention measures implemented in Peru and similar countries in the region, such as social distancing, strict compliance with hygiene and biosecurity protocols, and restriction of non-essential economic and social activities, have proved to be highly effective for this purpose.32,33
It is necessary to point out that the results of this study should be interpreted in light of the following limitations: (i) the simulation model is based on WHO-recommended guidelines,17 and, although they have been used in previous studies,21 there are other adjusted models that can improve the accuracy of the analysis;22 (ii) the authors' understanding of the COVID-19 pandemic could be influenced by local biases in the estimation of positive cases and daily deaths, and the actual number of current infections and infections during the follow-up period could be unknown, either because of deficiencies in case screening, or because patients do not attend health centers due to a fear of contagion or worsening of symptoms, so cases are not registered properly; (iii) the freely accessible population data for each government available on the websites consulted do not correspond to the complete population data, so only compatible data of both countries were used; and (iv) results may be influenced by seasonal factors, the age groups prevalent in the populations of each country, the socio-economic conditions of the United Kingdom and Peru, and the public health or political-social measures adopted (airport closures, confinement, school closures, etc.)
Conclusions
During the follow-up period, the UK strategy resulted in a higher case fatality rate, while the Peruvian strategy resulted in more than twice as many COVID-19 cases. The simulation of HI in Peru showed a dramatic increase in all the unfavorable indicators of the pandemic (mortality rates, hospitalization, etc.).
Similarly, as the COVID-19 pandemic worsened, the disproportionality of its impact in Peru and the United Kingdom was evident, which was determined by the measures taken in each country and by the socio-demographic variability between the two nations.

