


 English (pdf)
 Article in xml format
 Article references
 Send this article by e-mail
 Cited by SciELO
  Cited by Google
  Similars in
SciELO
Similars in
SciELO  Similars in Google
 Permalink
Introduction
Acid-base balance (ABB) is an important physiological condition for the homeostasis of the organism and the proper functioning of body fluids. ABB disorders are usually classified as respiratory when, as a result of an alteration in respiratory physiology, the primary disorder involves carbonic acid, or as metabolic when the acid-base alteration is caused by any mechanism that favors the accumulation of an acid other than carbonic acid.1
These disorders are a frequent pathophysiological condition in critically ill patients.2 In this regard, it has been described that acidosis can affect between 14% and 42% of these patients.3 Metabolic acidosis, in particular, is a common disorder in critically ill patients that affects proper cellular function and has been associated with high mortality in this population (up to 57%).4,5
Concerning the diagnosis of metabolic acidosis, there are two approaches from the physiological perspective, as follows:
The traditional approach, based on Henderson's proposal, in which HCO3, standard HCO3 (HCO3-st), base excess (BE) and standard base excess (BEst) are considered as variables of the metabolic component.6 Moreover, this approach also considers another variable, metabolic H+, which is a measure derived from the linear relationship between changes in pCO2 and the resulting total H+ concentration, known as CO2 titration curves, initially described in Boston, USA, in the 1960s and later analyzed and reformulated by Gómez & Cruz, as reported by Cruz et al.,7 in the intensive care setting in the Colombian context (Bogotá D.C.)
The "physicochemical" approach proposed by Peter Stewart, where strong ion difference (SID) and total concentration of nonvolatile weak acids (ATOT) are used to evaluate this component.8
These approaches have been evaluated in the intensive care unit (ICU) setting, finding that when the physicochemical model is used, the diagnosis of ABB disorders is more frequent.2,6 However, the clinical advantages of using this approach routinely in ICU patients have not yet been well defined. In this regard, several studies have evaluated the capacity of these physiological variables to predict clinical outcomes in critically ill patients, but the results have not been consistent.9 On the other hand, the difficulty and additional costs involved in calculating the measurements required in the physicochemical approach are factors to be kept in mind when considering the routine and repeated use of these variables in the clinical evaluation of ICU patients.6
In the critically ill patient scenario, there is a need to identify physiological variables that allow rapid, accurate, affordable and safe detection of alterations in the "metabolic component" of the ABB that, on the one hand, are related to the patient's prognosis and, on the other, can be used together with the most commonly employed clinical scoring systems in the ICU, such as the APACHE II, SAPS II or SOFA scores, among others.10
In view of the foregoing, the objective of this study was to evaluate the association between the variables of the metabolic component that allow assessing ABB and 28-day mortality in patients admitted to an ICU in Bogotá, D.C., Colombia.
Materials and methods
Study type and sample
A prospective observational cohort study was performed. The study population consisted of all patients admitted to the ICU of Hospital El Tunal (Bogotá D.C., Colombia) between January and June 2013 (N=251). In addition, the following inclusion and exclusion criteria were observed.
Inclusion:
Exclusion:
Presence of chronic lung disease.
Requirement of renal replacement therapy within the first 24 hours of ICU stay.
Presence of liver disease (acute or chronic).
Pregnant women.
Incomplete data.
Patients from whom informed consent was not obtained.
Once these criteria were applied, a final sample of 122 patients was obtained (Figure 1).
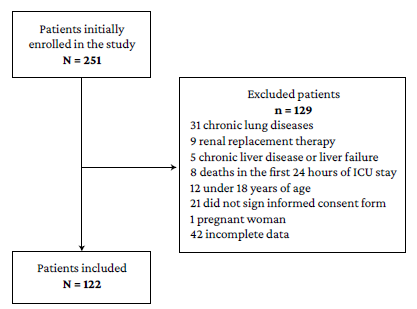
Source: Own elaboration.
Figure 1 Selection of patients included in the study and reasons for exclusion.
The patients were included by consecutive sampling.
Procedures
As part of the routine examinations on admission to the ICU, blood samples were taken from each patient to establish blood levels of creatinine, urea nitrogen, sodium, potassium, chloride, calcium, magnesium, phosphorus and albumin, as well as hemoglobin, hematocrit, platelet and leukocyte counts. Arterial blood gas testing was also performed, which, in compliance with the institutional protocol, was carried out by physical therapy professionals specialized in intensive care. This test was processed using the Cobas b 221 blood gas system: arterial pH was measured using a glass electrode, pCO2 with the Severinghaus electrode, and PO2 by means of the Clark electrode. The BEst and HCO3-st value was determined using the predetermined equations in the gas machine, while arterial lactate was measured utilizing the lactate oxidase enzyme technique.
Based on the data mentioned above and using the following formulas, the values of the following variables were calculated: metabolic H+, anion gap (AG), corrected anion gap (AGc), base excess-unmeasured anions (BEua), strong ion difference apparent (SIDa), strong ion difference effective (SIDe), and strong ion difference (SID):
Metabolic hydrogen ions = Total hydrogen ions - CO2 hydrogen ions
Total hydrogen ions: [H+] = Antilog (-pH)
CO2 hydrogen ions = 0.75 x PCO2 + 10
AG (mEq/L) = [Na+] + [K+] - [HCO3-] - [Cl-]
AGc (mEq/L) = AG + 0.25 X [42 - (Albumin in G/L]
BEua= BE - [0.3 X (Na+ - 140)] - [102 - (Cl- X 140/Na+)] - [0.34 X (45 - Albumin)]
SID = SIDa - SIDe
SIDa= [Na+] + [K+] + [Ca+2] + [Mg+2] - [Cl-] - [Lactate]
SIDe= 1000 x (2.46 x 10-11) x PCO2 / (10-pH) + [Alb] x (0.123 x pH - 0.631) + [Phosphorus] x
(0.39 x pH - 0.469).2
ABB alterations were classified based on the traditional Henderson model, taking into account arterial pH, pCO2, and BEst.9
In addition, based on the review of the medical records and during their ICU stay, the following data on each patient were recorded: sex, age, systolic blood pressure, mean arterial pressure, heart rate, vasopressor use during ICU stay, reason for ICU admission, clinical setting of origin, SOFA score, APACHE II score, and vital status at 28 days (28-day mortality).
Statistical analysis
Quantitative variables are described using means and medians and standard deviations and interquartile ranges according to the distribution of the data (as determined by the Kolmogorov-Smirnov test), while qualitative variables are described using absolute frequencies and percentages. Regarding inferential statistics, first, a bivariate analysis was performed to determine the association between the independent variables (metabolic H+, AG, AGc, BEst, BEua, arterial pH, lactate, HCO3-st, SID, APACHE II score and SOFA score) and 28-day mortality, calculating the respective Odds Ratios (OR) with a significance level of p<0.05. Then, a multivariate analysis was performed in which the variables with statistical significance in the bivariate analysis were entered into a logistic regression model to establish which were associated with the dependent variable (28-day mortality). Sample size was calculated using Freeman's formula: n=10(K+1),11 where K is the number of independent variables to be used in the logistic regression model; then: n=10 (11+1), n=120.
Ethical considerations
The study followed the ethical principles for the performance of biomedical research involving human subjects established in the Declaration of Helsinki12 and the scientific, technical and administrative standards for health research set out in Resolution 8430 of 1993 issued by the Colombian Ministry of Health.13 In addition, the research protocol was approved by the Research Committee of Hospital El Tunal, as stated in the letter issued by the hospital management on January 17, 2013 (GG-027/12). Finally, taking into account the nature of the study and the need for follow-up at 28 days, informed consent was obtained from all included patients (or their legal representatives if necessary).
Results
Of the 122 patients, 51 (41.80%) were women. The mean age was 46.5 years (±5.7), the mean length of ICU stay was 9.5 days (±6.3), and 33 patients (27.05%) died within the first 28 days. The most common reason for admission to the ICU was trauma (n=35; 28.69%); also, 71 (58.20%) came from surgical wards. Table 1 describes the clinical and sociodemographic characteristics of the participants.
Table 1 Sociodemographic and clinical characteristics of the sample (n=122).
| Variable | n (%) |
|---|---|
| Age (SD) | 46.5 (15.7) |
| Sex | |
| • Female | 51 (41.80) |
| • Male | 71 (58.20) |
| Vital status at 28 days | |
| • Deceased | 33 (27.05) |
| • Alive | 89 (72.95) |
| SBP (SD) | 113.5 (±19.0) |
| MAP (SD) | 109 (±14.1) |
| HR (SD) | 92 (±5.6) |
| Use of vasopressors during ICU stay | |
| • Yes | 81 (66.39) |
| • No | 41 (33.61) |
| Reason for admission to ICU | |
| • Trauma | 35 (28.69) |
| • Surgical | 21 (17.21) |
| • Neurosurgical | 20 (16.39) |
| • Medical | 18 (14.75) |
| • Neurological | 14 (11.48) |
| • Obstetrics and Gynecology | 6 (4.92) |
| • Coronary | 4 (3.28) |
| • Other | 4 (3.28) |
| Clinical setting of origin | |
| • Operating rooms | 71 (58.20) |
| • Emergency room | 26 (21.31) |
| • Referral | 16 (13.11) |
| • In-patient | 4 (3.28) |
| • Intermediate care unit | 4 (3.28) |
| • Delivery room | 1 (0.82) |
| SOFA severity score* | |
| • 0-4 | 61 (53.04) |
| • 5-9 | 46 ( 40.00) |
| • 10-14 | 8 (6.96) |
| APACHE-II severity score* | |
| • 3-9 | 21 ( 18.26) |
| • 10-14 | 50 (43.48) |
| • 15-19 | 30 ( 26.09) |
| • 20-24 | 11 ( 9.56) |
| • 25-29 | 3 (2.61) |
| Days of stay in ICU (SD) | 9.5 (±6.3) |
* Data on 115 patients.
MAP: mean arterial pressure; SBP: systolic blood pressure; HR: heart rate; SD: standard deviation; SOFA: Sequential Organ Failure Assessment; APACHE: Acute Physiology and Chronic Health Evaluation; ICU: intensive care unit.
Source: Own elaboration.
Table 2 summarizes the average values for biochemical and arterial blood gas variables measured during the first 24 hours of ICU stay. The mean values for arterial pH, HCO3-st, BEst, PaCO2 and SID were 7.32 (±0.08), 19.69 (±4.18) mEq/L, -6.54 (±5.99) mMol/L, 36.51 (±6.27) mmHg, and 10.62 (±3.96) mEq/L, respectively.
Table 2 Values of biochemical and arterial blood gas variables on admission to the ICU in the sample (n=122).
| Variable | Mean | Standard deviation |
|---|---|---|
| Sodium (mEq/L) | 141.08 | 4.62 |
| Potassium (mEq/L) | 4.02 | 0.72 |
| Chloride (mEq/L) | 106.14 | 4.67 |
| Calcium (mmol/L) | 1.07 | 0.05 |
| Magnesium (mEq/L) | 1.69 | 0.42 |
| Phosphorus (mmol/L) | 3.63 | 1.33 |
| Hemoglobin (gr/dL) | 11.60 | 2.23 |
| Hematocrit % | 34.66 | 7.19 |
| Platelets x 1000 | 215.17 | 103.53 |
| Leucocytes x 109/L | 17.86 | 10.22 |
| Albumin (gr/dL) | 2.40 | 0.66 |
| Total bilirubin (mg/dl) | 0.74 | 0.53 |
| Creatinine (mg/dL) | 1.08 | 0.61 |
| BUN (mg/dL) | 21.64 | 20.81 |
| Arterial pH | 7.32 | 0.08 |
| PaCO2 (mm Hg) | 36.51 | 6.27 |
| PaO2 (mm Hg) | 79.78 | 16.89 |
| HCO3 -st (mEq/L) | 19.69 | 4.18 |
| BEst (mMol/L) | -6.54 | 5.99 |
| PaO2 / FIO2 | 206.20 | 81.54 |
| Metabolic H+ (nMol/L) | 9.70 | 10.07 |
| Arterial lactate (mMol/L)* | 2.10 | 2.25 |
| BEua (mMol/L) | -18.03 | 4.65 |
| AG (mEq/L) | 19.27 | 3.12 |
| AGc (mEq/L) | 29.17 | 3.17 |
| SID (mEq/L) | 10.62 | 3.96 |
| SIDa (mEq/L) | 40.49 | 3.61 |
| SIDe (mEq/L) | 28.85 | 3.67 |
* median and interquartile range.
BUN: blood urea nitrogen; PaCO2: arterial CO2 pressure; PaO2: arterial de O2 pressure; HCO3-st: standard HCO3; BEst: standard base excess; FIO2: fraction of inspired O2; PaO2/FIO2: ratio of partial pressure arterial oxygen and fraction of inspired oxygen; H+ met.: metabolic hydrogen ions; BEua: base excess of unmeasured anions, AG: anion gap; AGc: anion gap corrected, SID: strong ion difference; SIDa: strong ion difference apparent; SIDe: strong ion difference effective.
Source: Own elaboration.
According to the traditional approach, 113 patients were diagnosed with some type of ABB disorder, with mixed acidosis (respiratory + metabolic) being the most frequent (n=28; 22.95%). The distribution of disorders according to the traditional approach is shown in Table 3.
Table 3 Distribution of acid-base balance disorders in the sample according to the traditional approach (n=122).
| Diagnosis of acid-base balance disorder | n (%) |
|---|---|
| Normal | 9 (7.38) |
| Metabolic acidosis | 21 (17.21) |
| Mixed acidosis (respiratory + metabolic) | 28 (22.95) |
| Metabolic acidosis + respiratory alkalosis | 27 (22.13) |
| Respiratory acidosis | 15 (12.29) |
| Respiratory alkalosis | 8 (6.56) |
| Respiratory acidosis + respiratory alkalosis | 8 (6.56) |
| Metabolic alkalosis | 5 (4.10) |
| Respiratory alkalosis + metabolic alkalosis | 1 (0.82) |
Source: Own elaboration.
In the bivariate analysis, SID, BEua, AG, AGc, arterial pH, APACHE II score, and HCO3-st were significantly associated with 28-day mortality (Table 4).
Table 4 Association between the independent variables considered and 28- day mortality after ICU admission. Bivariate analysis.
| Population Characteristics | p-value | OR |
|---|---|---|
| Metabolic H+ | 0.084 | 1.047 |
| Arterial lactate | 0.498 | 1.079 |
| SID | 0.008 | 1.150 |
| BEst | 0.235 | 0.947 |
| BEua | 0.023 | 0.897 |
| AG | 0.002 | 1.231 |
| AGc | 0.003 | 1.232 |
| pH arterial | 0.023 | 0.001 |
| APACHE II | 0.001 | 1.180 |
| SOFA | 0.092 | 1.136 |
| HCO3-st | 0.015 | 0.841 |
Metabolic H+: metabolic hydrogen ion; SID: strong ion difference; HCO3-st: standard HCO3; BEst: standard excess base; BEua: base excess of unmeasured anions; AG: anion gap; AGc: corrected anion gap; OR: Odds ratio; SOFA: Sequential Organ Failure Assessment; APACHE: Acute Physiology and Chronic Health Evaluation.
Source: Own elaboration.
Finally, in the multivariate analysis, the APACHE II score was the only variable that was significantly associated (p=0.008) with 28-day mortality (Table 5).
Table 5 Results of the final logistic regression model: association between the variables included in the model and 28-day mortality after ICU admission.
| Variables introduced in the logistic regression model | P | Standard error | OR (Exp(B)) | p-value |
|---|---|---|---|---|
| SID | 0.155 | 0.094 | 1.168 | 0.098 |
| BEua | 0.392 | 0.222 | 1.480 | 0.077 |
| AG | 1.347 | 1.491 | 3.847 | 0.366 |
| AGc | -0.830 | 1.549 | 0.436 | 0.592 |
| Arterial pH | 1.703 | 5.356 | 5.491 | 0.750 |
| APACHE II | 0.172 | 0.065 | 1.188 | 0.008 |
| HCO3 -st | -0.080 | 0.142 | 0.923 | 0.573 |
SID: strong ion difference; BEua: base excess of unmeasured anions; AG: anion gap; AGc: corrected anion gap; APACHE: Acute Physiology and Chronic Health Evaluation; HCO3-st: standard HCO3.
Source: Own elaboration.
Discussion
The main finding of this study is that none of the variables used in the Henderson or Stewart models to assess the "metabolic component" of ABB were significantly associated with 28-day mortality. Several studies have addressed ABB variables in the critically ill patient and their association with mortality, with lactate being one of the most frequently studied. In this regard, it has been reported that lactate levels on admission to the ICU and the absence of its "clearance" or normalization are associated with worse clinical outcomes in these patients, including specific populations such as surgical patients, trauma patients, patients with cardiogenic shock, and especially those with sepsis and septic shock.14-16
Notwithstanding the above, in the present study no statistically significant association was found between arterial lactate level and 28-day mortality. However, it should be noted that most of the studies reporting this association have been conducted in patients with shock, which implies a lactate level on admission >2 mMol/L. This is particularly relevant since the average lactate level in the present study was 2.1 mMol/L and only 66.39% of the patients required vasopressors during their stay in the ICU, which may partly explain these discrepancy in the results. Furthermore, this study only assessed lactate values on admission to the ICU and no follow-up data were obtained for this variable, which may also have influenced this result since several studies have demonstrated the prognostic value of a decrease in lactate levels within the first 24 hours after admission to the ICU, especially in patients with sepsis, as reported by Vincent et al.14 in their systematic review.
Another variable widely studied as a predictor of mortality in different clinical scenarios is BE. In this regard, some studies have reported the association between BE and adverse clinical outcomes, including mortality, in specific populations of critically ill patients,17,18 especially those with trauma.19-21 However, the study by Masevicius et al.22 involving 4 901 adult patients admitted to a medical-surgical ICU between January 2006 and December 2014 did not find a statistically significant association between BE and in-hospital mortality, a finding similar to that observed in our study, in which BEst was not significantly associated with 28-day mortality in the bivariate analysis. In this sense, it is possible that differences in the aforementioned characteristics of our sample (namely, the mean lactate level and the proportion of patients who required vasopressors) may partially explain the discrepancy in this finding. Additionally, it should also be noted that only 62.29% of the participants had metabolic acidosis as the primary ABB disorder, which may have also limited the prognostic value of BEst.
In the case of metabolic H+, no studies were found that evaluated this variable in terms of its capacity to predict clinical outcomes. However, taking into account its high statistical and conceptual correlation with BEst, as well as the fact that its mathematical calculation involves similar variables, it was to be expected that this variable would not show a statistically significant association with mortality either.6
As for the variables considered in the Stewart model, the information is extensive, and the results are diverse. For example, Dubin et al.6, in a prospective study of 935 ICU patients comparing the diagnostic and prognostic performance of the Stewart model with the traditional model and with an approach based on HCO3, BE and AGc, found a significant association between 30-day mortality and the following variables: SOFA score, SID, AGc, SIDe, BE, HCO3 and lactate, with AUROC values of 0.83, 0.62, 0.61, 0.60, 0.57, 0.56, and 0.67, respectively. In turn, Kaplan and Kellum23 reported the association of SID and SIDa with 28-day mortality in a study of 52 patients (26 non-survivors) with trauma (penetrating or blunt) requiring ICU care, an association that has also been described in other studies of critically ill patients.9,24
However, this association is not always strong or, in other cases, the prognostic value is no greater than that described for variables in the traditional model.9,25,26 For instance, in the research conducted by Masevicius et al.,22 an association between unmeasured anions and mortality was reported, but with a very small effect size (adjusted OR= 1.04, 95%CI: 1.02-1.06; p<0.0001), while Ho et al.,27 in a study that included 6 878 patients admitted to a medical-surgical ICU and in which data obtained during the first hour of ICU stay were analyzed, concluded that the prognostic significance of SID was modest, with an AUROC of 0.63, a value that is equal to that found in the study by Rocktaeschel et al28 in 300 adult ICU patients (AUROC= 0.63; 95%CI: 0.56-0.70).
Regarding AG, Glasmacher & Stones,29 in a meta-analysis that included 19 studies conducted in various clinical settings caring for critically ill patients (12 497 patients in total), concluded that it is not advisable to use a single AG measurement to stratify risk in this population. According to this meta-analysis, 16 of these studies reported a poor to moderate capacity of AG to predict mortality, although it should be considered that in general the quality of the studies was poor and that most of these had a moderate to high risk of attrition and confounding.29 Notwithstanding the above, and although this variable was not evaluated in our study, it should be mentioned that Lipnick et al.,30 in a study performed in a large cohort (18 985 patients admitted to two medical-surgical ICUs), found that the delta AG, defined as difference between critical care initiation standard anion gap and prehospital admission standard anion gap (measured during the year prior to ICU admission), was associated with 30-day mortality, with the strongest association being with a delta AG >10 mEq/L (OR=2.18, 95%CI: 1.76-2.71; p<0.0001).
When analyzing these results as a whole, it could be concluded that even though some of these variables are described as predictors of mortality, given the statistical significance established by the p-value, AUROC values are barely acceptable, being similar to the values obtained in the present study (0.66 for AG and AGc, and 0.64 for SID; exploratory data not shown here) and to those reported in the only study performed in Colombia that, to date, has evaluated the usefulness of SIDe in the prediction of multiple organ dysfunction syndrome (0.62).31 Therefore, as pointed out by several authors,6,25,26,28 the variables that allow evaluating the metabolic component of ABB in the Stewart model do not always make an additional contribution to the scores and variables already established as predictors of mortality in the ICU setting. Significant associations, but with very small effect sizes are related to the large sample sizes with which these studies were conducted.8,22,27 In any case, further studies are recommended to evaluate the prognostic utility of ABB variables in specific groups of critically ill patients, such as burn, trauma and septic patients or postoperative cardiac surgery patients, in which its predictive capacity for clinical outcomes may be distinctive.16,17,20
The present study has several limitations. First, only blood gas data obtained during the first day of ICU stay were analyzed, i.e., follow-up values during the participants' stay, which may be important to determine their prognostic value, were not taken into account. Second, this is a single-center study, which limits the external validity of the findings reported here. Third, a heterogeneous population of ICU patients was evaluated and subgroup analyses were not performed, thus limiting the interpretation of the results in relation to specific groups of patients. Fourth, it is possible that SID alterations are secondary to the administration of unbalanced intravenous fluids such as 0.9% saline, an aspect not evaluated in the present study; however, it has been shown that the administration of a fluid load of up to 1 700 mL of crystalloid in the first hours of resuscitation does not have a significant impact on ABB variables.32
On the other hand, the main strength of this research is its prospective design, which guaranteed adequate data collection of the variables analyzed and follow-up of all patients included. Furthermore, in the ICU of the hospital where the study was carried out, sample collection and processing are performed within the first hour after admission and following a well-standardized procedure, which makes it unlikely that pre-analytical variables would have greatly affected the results obtained.

