


 Inglés (pdf)
 Articulo en XML
 Referencias del artículo
 Enviar articulo por email
 Citado por SciELO
  Citado por Google
  Similares en
SciELO
Similares en
SciELO  Similares en Google
 Permalink
INTRODUCTION
The capacity of soils to store or sequester organic carbon (OC) represents one of their main functions (Wiesmeier et al., 2019). In this context, soil organic carbon (SOC) is generally lower in tropical and subtropical zones, about soils located in a temperate climate (Jiménez and Lal, 2006). This is the result of increased OC flow from plant biomass and microbial biomass into soils and increased rainfall and temperature conditions that accelerate carbon mineralization (De Koning et al., 2003; Novara et al., 2018). Other factors, such as slope and clay content, have an equal impact on SOC, regardless of climate (Takoutsing et al., 2016), as well as on the physical, chemical, and biological properties of the soil.
On the other hand, changes in land use are the second most important cause of the emission of greenhouse gases such as carbon dioxide, which occurs with greater intensity in tropical and subtropical areas (Don et al., 2011; Lal, 2015). The main land-use change is from forests to grasslands, which is the most widespread agricultural system on the planet and the livelihood of one million families (FAO, 2017; Lorenz and Lal, 2018).
In the year 2010, the area occupied by forests on the planet was 4.03 billion hectares, representing approximately 30% of the total area of arable land (Lorenz and Lal, 2018). The same percentage corresponded to grasslands, which included: natural pastures, scrublands, and forage crops (Lefèvre et al., 2017).
Meyer et al. (2018) consider pastures to be an important store of SOC, due to the constant input of OC from the root zone, where a significant amount of raw biomass is produced and continuously regenerated. The decomposition of the root biomass of pastures greatly influences the nutrient cycle, due to microbial action and consequently increases the accumulation of SOC (Liang et al., 2019; Rees et al., 2005). However, this depends on soil texture, soil topography, and climate (Liang et al., 2016). Other OC inputs to the soil originate from the excreta of grazing animals (Tilman et al., 2002).
Ecuador's native forest area decreased from 14,587,771 hectares in 1990 to 12,753,387 hectares in 2014 (FAO, 2014; MAE, 2015), with agriculture being the main factor of change, mainly the use of pastureland, which in 2010 was 4,840,926.62 hectares, including both permanent and temporary pastures (INEC, 2011).
The replacement of native forest by pasture in the soils of Ecuador, mainly in the areas with tropical climates (coast, Andean foothills and the Amazon) has had negative effects such as soil erosion, or a decrease in the level of organic matter (De Koning et al., 2003). Therefore, it has caused the loss of levels of SOC stored in the first 30cm of the soil (Rhoades et al., 2000; Bravo et al., 2017). Although some studies in Ecuador have shown the opposite in temperate climate conditions (Andean highlands), where stored SOC levels increased (De Koning et al., 2003; Hamer et al., 2013).
Therefore, the aims of this research were: characterize the land uses of pasture and native forest in two sites in El Oro province (Ecuador), according to their physical, chemical, and biological properties and compare the storage of organic soil carbon at three depths.
MATERIALS AND METHODS
Study area. The research was conducted in the province of El Oro, located in the south of Ecuador, at the following sites: Santa Inés Experimental Farm (SI) in Machala (03°17'16 "LS; 79°54'05" LO) and the Cune (CN) in Chilla (03°37'15'' LS; 79°60'46" LO). The average annual temperature is 24,87°C at sea level for SI and 21,1°C between 550 and 1100m altitude for CN. The annual precipitation was 708,4mm and 1755mm for SI and CN respectively; with rainfall between December to May and low rainfall from June to November (Luna-Romero et al., 2018)
The soils are of alluvial origin with a predominance of the Entisol (SI) and Inceptisol (CN) orders (Moreno et al., 2016). Santa Inés is located on a coastal plain and the Comuna Cune in the southwestern foothills of the Andes, with slopes that decrease in altitude from north to south (Baldock, 1982).
Slope, climate, and soil subgroups are the main factors that characterized each site (Table 1). The type of agronomic management was: intensive double-purpose (meat/milk), with frequent use of contact herbicides such as Paraquat to control weeds and chemical fertilizers such as muriate of potassium and urea. The pasture area was partially covered by scattered trees such as Samanea saman in SI and Laurus nobilis in CN, which provided shade for the cattle.
Table 1. Main characteristics of climate and soil of the Santa Inés and Cune sites.
| Características | Santa Inés (SI) | Cune (CN) |
|---|---|---|
| Weather 1 | Warm tropical | Humid sub-tropical |
| Slope (%) | 0-2 | 5-20 |
| Soil order | Entisol | Inceptisol |
| Soil subgroup 2 | Aquic Dystrustepts | Typic Haplanthrepts |
| Dry soil color 3 | 10 YR 6/1 | 10YR4/2 |
| Land use | pasture (30 years); forest (>50 years) | pasture (20 years); forest (>50 years) |
1 Kopper classification; 2Villaseñor et al.,(2015); 3Munsell Color (1994).
Sample Design. Within each site, a 3ha plot of land was delimited, cultivated with Brachiaria sp, which were codified as the land uses: SIpasture and CNpasture. Along with the pastures, other plots of 2ha of native forest land use were demarcated, which were coded as SIforest and CNforest. The predominant species in the forests were Cordia alliodora, Prosopis sp, Triplaris cumingiana, Pseudosamanea guachapele, Swietenia macrophylla, Roystonea regia, Drimys winteri, Inga sp, citronella mucronata, Brosimum alicastrum, Cordia alliodora and Aegiphila alba (Horstman et al., 2018).
In each plot, soil samples were collected. For this purpose, two types of sampling were carried out depending on the topography of the land. In SI, four 30m long transects were delimited, spaced at 50m (2 in the pasture, 2 in the forest), in which the sampling points (SP) were at zero, 15, and 30m. For CN the transects (3 in the pasture, 2 in the forest), were L-shaped with direction to the slope of the hill. The SP was taken at zero and 25m vertically and from 25 to 50m horizontally, at a distance of 50m between transects.
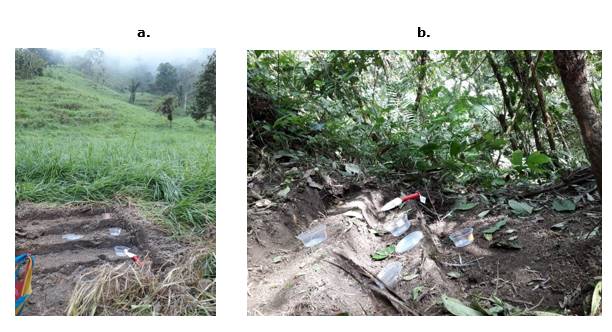
Then, undisturbed soil samples were taken in 100cm3±2 metal cylinders, inserted vertically into the soil at three depths every 0,10m in the SP. For this purpose, 0.20m wide steps were formed (Figure 1). At the end, the samples were coded as layer 1 (C1) of 0-0,10m, layer 2 (C2) of 0,10-0,20m and layer 3 (C3) of 0,20-0,30m.
Soil analysis. At each sampling point and layer, 1,5kg of soil was taken, which was air-dried for 72 hours, then crushed and sieved with 2mm mesh, for the determination of the granulometry carried out by the Bouyoucus hydrometer method (Monroe et al., 2016). The pH determined in saturation paste with water is in the ratio of 1:2,5. Phosphorus (P) and potassium (K) were determined with the Olsen method modified to pH 8,5 (Olsen and Sommers, 1982). Calcium (Ca), iron (Fe), and magnesium (Mg) were determined through the extraction of KCl 1 N (USDA-NRCS, 2014). Analyses performed in the soil and plant tissue laboratories of the Ecuadorian Agency for Phytosanitary Regulation and Control.
Measurement of total flora and colimetry in the soil. A sample composed of 200g of soil from the first layer was also collected for microbiological analysis of total flora and colometry. From the sample, 10g were taken, to proceed by serial dilutions of the soil in a saline buffer solution (K2HPO4 and NaCl), to be planted in Petri dishes with agar plate counter (Merck, Massachusetts, USA) for total flora counting and with Macconkey (TM Media, Rajasthan, India) for colimetry (Ortíz-Maya et al., 2017). They were then transferred to the hatchery at 38°C for 24 and 48h for total flora and colimetry counts respectively, in total colony-forming units per gram of soil (CFU g-1). Estimation made in a Leica digital colony counter model 3327 (Leica, Colorado, USA).
Calculation of stored soil organic carbon. With undisturbed soil samples, the bulk density (Bd) was obtained, which was determined by dividing the weight of the oven-dried sample at 105°C for 48h, for the volume of the cylinder (Equation 1) as suggested by Walkley and Black (1934).
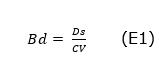
Dónde: Bd = bulk density (Mg m3), Ds=weight of the dry sample inside the cylinder, CV = cylinder volume.
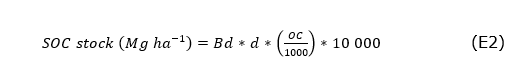
The determination of OC (g kg-1) was made by wet digestion with potassium dichromate (Walkley and Black, 1934). The amount of SOC stored was calculated (Equation 2), by multiplying by the Bd (mega grams-Mg m3), the depth (d) of soil sampling (0.10m), the OC between 1000 and by 10,000m2 factor corresponding to one hectare (Chen et al., 2019). Thus, Equation (3) provides the total SOC stock in the soil. The use of some correction factor for soil particles > 2mm, as suggested by Chen et al., (2019) and Reyna-Bowen et al. (2019), was ruled out because there was no stone in the sampled soils. The Bd and SOC determinations were performed at the soil laboratory of the Technical University of Machala.

Statistical analysis. All statistical testing was done with SPSS software, version 23,0 (SPSS, 2013). For physical, chemical, and biological soil properties and stored COS values, the statistical mean, standard error of the mean, and ranges were calculated. An analysis of variance (ANOVA) was carried out to find out if there are statistical differences between the land uses under study and the sampling depths. For the properties, flora total, colimetry, Bd, clay, and SOC stock, the Tukey test (p˂0,05) was applied, by land use. To establish correlations indicating whether soil nutrients have an incidence on SOC, the Pearson 1% and 5% correlation analysis by land use was used between stored SOC and soil properties such as pH, P, K, Ca, Mg and Fe.
RESULTS AND DISCUSSION
Soil characteristics. The averages obtained from the physical and chemical properties of the soil are presented in Table 2, with their respective analysis.
Table 2. General soil properties by land use and depth.
| Land use/depth | Clay | Silt | Sand | pH | K | Ca | Mg | P | Fe | |||
|---|---|---|---|---|---|---|---|---|---|---|---|---|
| g kg-1 | cmol kg-1 | mg kg-1 | ||||||||||
| SIpasture (N=6) | ||||||||||||
| C1 | 352.67 | 323.33 | 270.00 | 8.76 | 1.59 | 15.35 | 3.72 | 8.90 | 15.00 | |||
| C2 | 443.33 | 300.00 | 256.67 | 9.06 | 1.00 | 15.53 | 3.35 | 3.50 | 15.00 | |||
| C3 | 380.33 | 353.33 | 263.33 | 9.03 | 0.48 | 10.01 | 2.44 | 3.50 | 28.80 | |||
| SIforest (N=6) | ||||||||||||
| C1 | 283.33 | 420.00 | 296.67 | 7.54 | 1.19 | 16.32 | 4.93 | 4.20 | 15.00 | |||
| C2 | 306.67 | 413.33 | 280.00 | 8.74 | 0.89 | 15.69 | 5.50 | 3.50 | 16.00 | |||
| C3 | 330.00 | 423.33 | 246.67 | 8.98 | 0.55 | 15.34 | 5.28 | 6.27 | 16.87 | |||
| CNpasture (N=9) | ||||||||||||
| C1 | 134.89 | 224.44 | 640.67 | 5.31 | 1.00 | 3.99 | 1.82 | 6.50 | 938.34 | |||
| C2 | 157.11 | 250.33 | 592.56 | 5.37 | 1.05 | 3.37 | 1.41 | 8.88 | 891.70 | |||
| C3 | 129.78 | 237.00 | 633.22 | 5.31 | 0.90 | 2.91 | 1.10 | 4.33 | .761.72 | |||
| CNforest (N=6) | ||||||||||||
| C1 | 197.83 | 198.83 | 603.33 | 5.21 | 0.33 | 4.37 | 1.68 | 3.50 | 557.92 | |||
| C2 | 227.83 | 170.00 | 602.17 | 5.19 | 0.25 | 3.57 | 1.43 | 3.50 | 499.24 | |||
| C3 | 202.33 | 205.50 | 592.17 | 5.27 | 0.30 | 3.30 | 1.33 | 3.73 | 548.82 | |||
SIpature (Santa Inés pasture); CNpasture (Cune pasture); SIforest (Santa Inés forest); CNforest (Cune forest) C1 (depth 1 of 0-0.10m); C2 (depth 2 of 0.10-0.20m); C3 (depth 3 of 0.20-0.30m).
Soil particles in SI were very tight between silt (pasture, 300 - 353.33g kg-1; forest, 413.33 - 423.33g kg-1), and sand (pasture, 256.67 - 270.00g kg-1; forest, 246.67 - 296.67g kg-1). In clay, the ranges were wider (pasture, 352.67 - 443.33g kg-1; forest, 283.33 - 330g kg-1) and increased values between 20 and 30cm (C3), with respect to the first layer. In CN, soils showed high values of sand ranging from 592.56 - 640.67g kg-1 (pasture) to 592.17 - 603.33g kg-1 (forest) and while maximum values of clay (pasture, 129.78 - 157.11g kg-1; forest, 197.83 - 227.83g kg-1) and silt (pasture, 224.44 - 250.33g kg-1; forest, 170 - 205.50g kg-1), were lower than those determined for SI soils. The distribution of soil particles that allowed the classification into textured soils: clayey and loamy loam in SIpasture, loam in SIforest, and sandy loam for CNpasture and CNforest. This information coincides with the results of previous research in the soils of El Oro province (Villaseñor et al., 2015; Barrezueta-Unda et al., 2018). Moreno et al., (2016) point out the high percentages of sand in the first 30cm, in the foothills of the western Andean range, is a product of the runoff caused by the rain that transported the clay to the lower areas of the Ecuadorian coast.
The chemical reaction of the soil was different in both locations. In SI, the soil was more alkaline in the grass (pH 8.76 - 9.06), concerning the use of forest soil (pH 7.54 - 8.98). In CN, the pH range varied towards acidity, with little variation between soil uses and depth (pasture 5.31 - 5,37; forest 5,19 - 5,27). Similar results were found by Potthast et al. (2012) in Ecuadorian soils with a tendency towards alkalinity (pH 7-8) in the coastal region and pH ranges from 4.2 (forest) to 5.3 (pasture) in the foothills and Andean paramo areas. Makeschin et al. (2008), also found this difference in pH in Ecuadorian soils and related it to Ca levels (high on the coast, low in the mountains) and to the high level of Fe in the mountains.
The levels of K were high in SIpasture, SIforest, and CNpasture (>0.89cmol kg-1), except in the third layer of SIforest (0.55cmol kg-1), while the values determined in CNforest (range, 0.25 - 0.33cmol kg-1), which were low. The averages of Ca (pasture, >10.0cmol kg-1; forest, >15.34cmol kg-1) and Mg (pasture >2.44cmol kg-1; forest >4.93cmol kg-1), were high in all SI soil layers. In the case of CN soils, Ca (pasture, < 3.99cmol kg-1; forest, <1.82cmol kg-1) and Mg (pasture, < 4.37cmol kg-1; forest, <1.68cmol kg-1), were low and decreased from C1 to C3. The P level in all soils was low, and the ranges similar (8.8-3.5mg kg-1) in the two locations, but with the particularity that the values increased from the upper to the lower layer in the SIforest soil from 4.20mg kg-1(C1) to 6.27 mg kg-1(C3). Quichimbo et al. (2017) and Jiménez et al. (2007) also found low nutrient levels in pastures and forests, located on high slopes. Priess et al. (2001) indicate that in coastal and mountain grazing soils of Ecuador, nutrient losses are not compensated for by livestock manure input. On the other hand, the quality and quantity of biomass generated by pastures and forests are linked to the quantities of nutrients, which are reduced by factors such as the topography of the terrain (high slope), the quantity of clay and the climate conditions (high precipitation) (Marconi et al. 2018).
The mineral Fe was low (≤ 28.80mg kg-1) for SI soils and high in CN, mainly in CNpasture, with values that decreased from C1(938.34mg kg-1) to C3 (761.72mg kg-1), followed by CNforest soil in C1 (557.92mg kg-1). Fe levels that are associated with the acidic pH reaction (Makeschin et al., 2008), and a lower meteorization of the soils in mountain areas concerning to the soils of the Ecuadorian coast (García-Cruzatty et al., 2012).
The Tukey test, for total flora, indicates statistical insignificance (p<0.05) among the land uses (Table 3). The highest average corresponded to CNpasture (8.5 x10⁶ CFU g-1). High total flora value concerning Álvarez-Solís and Azueto-Martínez (2004) research, which showed values between 6.27-6.91 x10⁶ CFU g-1 in the grass and native forest with soil properties similar to the study (pH: 4.40-5.1 with sandy loam texture). In the case of SIpasture soils, the total flora count was low compared to the average of 4.1 x10⁶ CFU g-1, obtained in soybeans in clay loam soils and pH= 6.01-6.4 (Fernández et al., 2005). In investigations on microbial activity in Ecuadorian soils, a direct relationship with OC and mainly between P and the abundance of gram-positive bacteria was determined (Crespo et al., 2011; Potthast et al., 2012; Tischer et al., 2014). In the investigation, SIforest and CNforest soils showed the lowest levels of P (Table 2); therefore, a low incidence of the bacterial total flora.
Table 3. Tukey test (P<0.05) between colony-forming units (CFU) of total flora (TF) and colimetry (CL) of bacteria by soil use, between zero and 10cm.
| Land use (N=3) | FT (CFU grams of soil) | CL (CFU grams of soil) | ||||||
|---|---|---|---|---|---|---|---|---|
| average | SE | Range | Sig. (p<0.05) | average | SE | Range | Sig. (p<0.05) | |
| SIpasture | 0.01 | 0.28 | ||||||
| 3.23 x 10⁶ ab | 1.19 x 10⁶ | 3.90 x 10⁶ | 0.39 x 10⁶ a | 0.28 x 10⁶ | 8.70 x 10⁵ | |||
| SIforest | ||||||||
| 3.60 x 10⁶ a | 0.10 x 10⁶ | 3.20 x 10⁵ | 1.45 x 10⁶ a | 0.47 x 10⁶ | 1.56 x 10⁶ | |||
| CNpasture | ||||||||
| 8.50 x 10⁶ a | 0.20 x 10⁶ | 6.10 x 10⁶ | 1.95 x 10⁶ a | 1.03 x 10⁶ | 3.42 x 10⁶ | |||
| CNforest | ||||||||
| 1.46 x 10⁶ b | 0.77 x 10⁶ | 2.50 x 10⁶ | 0.60 x 10⁶ a | 0.17 x 10⁶ | 560000 | |||
EE= standard error of the average, Sig= significance (p-valor <0.05)
The four averages of colimetry (Table 3), a soil biological indicator related to the number of bacteria in the fecal matter, did not show significant differences (p-value=0.28). The colimetry values ranged from 1.95 x 10⁶ (CNpasture) to 0.39 x 10⁶ (SIpasture). For Chen et al. (2018), high bacterial loads in the soil are related to acid pH, while Weil and Brady (2017) express, that anthropogenic disturbances are generally more accentuated in soils with an alkaline pH, is a negative factor for the increase of microbial activity. Fernández et al. (2005) pointed out that the amount of CFU g-1 of colimetry is related to soil management, such as the excessive application of chemical fertilizers and pesticides, which decreases the levels of colimetry, while the use of organic fertilizers increases this biological indicator.
Another factor that can influence the flora total and colimetry values is the root development of the pasture, which presents a greater accumulation of roots in the first 10cm of the soil, and therefore a greater number of bacteria (Makeschin et al., 2008).
The values of Bd presented in Table 4, show significance (p<0.05), in the use of forest land, which indicated ranges of 1.04Mg m3 - 1.13Mg m3. Significance (p<0.05) in OC was also observed in SI soils and CNforest. Therefore, the depth of sampling had an influence on the variability of BD only in SI. In CNforest, average Bd decreased from 1.24Mg m3 to 1.12Mg m3 between C1 and C3, respectively. In pastureland uses, an increase in Da from C1 to C3 was observed (SIpasture 1.09-1.13Mg m3; CNpasture 1.04-1.11Mg m3). Values that in general do not indicate soil compaction problems (>1.6Mg m3) and are within the range (1.1-1.2Mg m3) of fine-textured soils such as loam, clay loam and the range (1.2-1.6Mg m3) of coarse-textured soils (sandy loam), as indicated by Salamanca and Khalajabadi (2005) and Brahma et al. (2018). This revealed that the root development of the grass was not affected. Six et al. (1998) and De Blécourt et al. (2017) found a direct relationship between the values of Bd that increased from 0.84 to 1.18Mg m3 between zero and 30cm, while OC decreased on average, as the values obtained in this research.
Table 4. ANOVA and Tukey test (P<0.05) for Bulk Density (Bd) and Organic Carbon (OC), by land use.
| Land Use | Bd (Mg m3) | OC (g kg-1) | |||||||
|---|---|---|---|---|---|---|---|---|---|
| Average | SE | Range | Sig. (P<0.05) | Average | SE | Range | Sig. (p-valor<0,05) | ||
| SIpasture (N=6) | |||||||||
| C1 | 1.09 sn | 0.02 | 0.13 | 0.34 | 16.8 a | 1.29 | 6.65 | 0.00 | |
| C2 | 1.10 sn | 0.02 | 0.16 | 11.13 b | 1.16 | 5.95 | |||
| C3 | 1.13 sn | 0.01 | 0.08 | 6.73 b | 1.99 | 5.47 | |||
| SIforest (N=6) | |||||||||
| C1 | 1.04a | 0.02 | 0.13 | 0.01 | 35.45 a | 9.36 | 47.60 | 0.00 | |
| C2 | 1.13b | 0.02 | 0.14 | 9.53 b | 3.67 | 24.60 | |||
| C3 | 1.12b | 0.02 | 0.12 | 3.58 b | 1.52 | 10.00 | |||
| CNpasture (N=9) | |||||||||
| C1 | 1.04 sn | 0.05 | 0.40 | 0.76 | 30.81 sn | 2.83 | 13.05 | 0.87 | |
| C2 | 1.06 sn | 0.07 | 0.55 | 32.86 sn | 3.52 | 16.21 | |||
| C3 | 1.11 sn | 0.09 | 0.70 | 33.71 sn | 5.11 | 23.58 | |||
| CNforest (N=6) | |||||||||
| C1 | 1.24 sn | 0.04 | 0.32 | 0.13 | 22.50 b | 1.69 | 18.39 | 0.01 | |
| C2 | 1.21 sn | 0.02 | 0.12 | 19.12 b | 1.16 | 14.82 | |||
| C3 | 1.12 sn | 0.05 | 0.33 | 29.72 a | 2.63 | 21.70 | |||
EE = standard error of the mean, Sig = significance (p-value <0.05) Different letters indicate statistical significance.
The levels of OC (Table 4), in SI soils, did not decrease homogeneously as can be seen in the ranges of SIpasture between 16.8 - 6.73 g kg-1 and 35.45 - 3.58 g k-1 in SIforest. The result indicated a significant (p<0,01) between C1 and the rest of the depths. The heterogeneity in the distribution and age of the dispersed trees, the shrub vegetation in the grass and the forest species in the forest, guaranteed a constant input of OC, but also rapid mineralization of carbon in the first layer (Wilcke et al., 2002); which did not allow the eluviation of OC to the depths C2 and C3. At CNpasture, OC levels were more homogeneous and ranged from 30.81 to 33.71 g kg-1, showing no significance (p<0.05). The CNpasto land use showed, OC levels ranging from 22.50 to 29.72g k-1, and significance (p<0.05) of depth three with C1 and C2. The ranges of OC, determined in the study were different from those obtained by Rhoades et al. (2000) from 20.22 to 48.20g kg-1 in pasture and 21.70 to 48.2g kg-1 in the forest at <1000m altitude, on soils of sedimentary origin.
In Figure 2A, only the stored SOC values showed significant differences (p-value<0.05) in SI soils. The highest average SOC stored in the SI site were: SIforest (C1, 36.30Mg C ha-1), SIpasture (C1, 18.43Mg C ha-1), SIpasture (C2, 12.27Mg C ha-1), SIforest (C2, 12.27Mg C ha-1). In the rest of the layers, the values of SOC wired were ≤ 7.67Mg of C ha-1. In the CN soils, the averages were more adjusted, with the particularity that the highest values of SOC stored (CNpasture, 35.01Mg C ha-1; CNforest 33.24Mg C ha-1), were seen in the last depth. These levels are below those determined by McGroddy et al. (2015), in a silvopastoral system in the southwestern Andes in Ecuador, who mentions a maximum value of 40.8Mg C ha-1 and are less than 45.55Mg C ha-1 in cocoa plantations, as indicated by Barrezueta-Unda et al. (2018), in the area under study. OC inputs from the biomass generated by forests over 40 years old, are between 104 and 158Mg C ha-1, much higher than the results reported in the study, but are over the range of 2 to 18Mg C ha-1 of biomass generated by pastures in the mountains of the Buenaventura reserve (El Oro province) (Spracklen and Righelato, 2016).
The comparison in percentages of the stored SOC (Figure 2B), indicated significance (p-value<0.05) in the land uses SIpasture, SIforest, and CNforest. In the SI soils, the first 10cm accumulated the highest percentage of SOC with 71.10%, in (SIforest) and 48.03% (SIpasture), while in CNpasture the percentages were 31.48, 33.48 and 35.06% for C1, C2 and C3 respectively. In CNforest, the percentage distribution of stored SOC was 32.93, 27.47, and 39.60% for C1, C2, and C3, in that order. These results are consistent with other research on high slope soils, where more than 60% of stored soc is located in the first 0,20m of the soil (Tonucci et al., 2017; Gebeyehu and Soromessa, 2018). The homogeneous distribution of the SOC in steeply sloping terrain is related to several factors such as the previous plant composition and the degree of profile formation, runoff, etc., while in flat areas the accumulation of OC is greater in the first 10cm as a result of the accumulation of biomass, which produces the formation of deeper humic horizons (Barré et al., 2017).
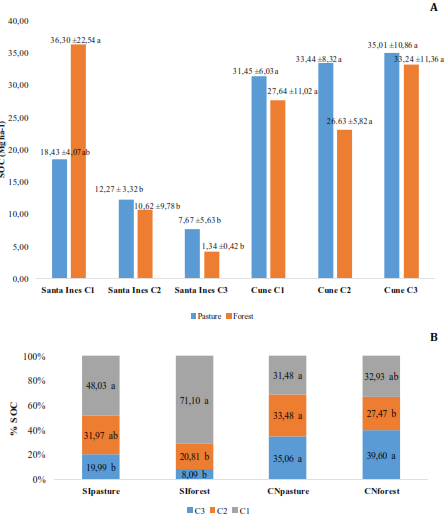
Figure 2. Tukey test applied to: A) comparison of SOC by layer for each land use, B) distribution of SOC by land use.
The Pearson correlation analysis (Table 5), between SOC stored by land use and pH, P, K, Ca, Mg and Fe properties, indicated a negative association at 5% significance with pH in SIpasture (r=-0.57*) and SIforest (r=-0.48*) land uses, revealing that the acidic condition of the soil negatively influences COS levels, as also found by Miretti et al. (2012) in grasslands of Santa Fe province, Argentina. While a positive correlation with Fe is shown in the CNforest soil (r=0.55*) and a high positive correlation with K (1% of significance) in the SIforest soil (r=0.83**), similar relationships were described by Beltran et al. (2016) in loamy soil texture cultivated with vines in La Rioja, Spain, while Peregrina et al. (2010) found a negative correlation in soils with alpha-maize-sorghum rotation in Argentina.
Table 5. Pearson's correlation matrix between stored SOC by land use and physical and chemical properties.
| SIpasture SOC | SIforest SOC | CNpasture SOC | CNforest SOC | |
|---|---|---|---|---|
| pH | -0.57* | -0.48* | 0.17 | -0.10 |
| P | 0.13 | -0.30 | 0.08 | -0.22 |
| K | 0.43 | 0.83** | 0.07 | -0.04 |
| Ca | 0.16 | -0.01 | -0.08 | -0.16 |
| Mg | 0.55 | -0.07 | -0.14 | -0.02 |
| Fe | -0.03 | 0.24 | 0.51 | 0.55* |
CONCLUSIONS
The land uses showed very marked differences between physical (clay, sand, and Bd) and chemical (pH and Fe) properties per site; soil formation being one of the factors of its differentiation. In the case of the biological properties total flora and colimetry, the results were similar among the soils accepted in the pasture of the Cune site, which showed much higher CFU values, due to the acidity of the soil and a higher amount of P, factors that facilitate the growth of bacterial colonies.
On the other hand, the OC values were very homogeneous in the three depths of both the pasture and the forest in the Cune site, while in the soils of Santa Inés the OC levels decreased as the sampling deepened. This difference may be related to the elution phenomenon due to the predominance of the sand fraction and the slope at the Cune site.
The amount of SOC stored in the forest land use was lower than other investigations carried out in conditions of slope and climate equal to the study. But the values determined for SOC in the pasture were similar to other investigations. Therefore, it is concluded that changes in SOC storage by layers are more pronounced in SI than in CN.

