


 English (pdf)
 Article in xml format
 Article references
 Send this article by e-mail
 Cited by SciELO
  Cited by Google
  Similars in
SciELO
Similars in
SciELO  Similars in Google
 Permalink
INTRODUCTION
Two groups compose Verbenaceae (to date): a) Verbena complex and b) Verbenaceae (Yuan et al., 2010). Verbena complex is new, formed by three closely related genera, Verbena (NA, SA), Glandularia, and Junellia I and II. Verbena and Glandularia are monophyletic; the genus Junellia, composed of two clades I and II, is non-monophyletic. At the interspecific level Verbena contains two clades NA=North America and SA=South America. Citharexylum, Stachytarpheta, and the Lantana/Lippia/Aloysia complex (Verbenaceae group) are the richest genera in species (Yuan et al., 2010). The Verbenaceae have opposite leaves and flowers with light bilateral symmetry of the corolla; fleshy or dry fruits, usually with two or four seeds divided into two or four segments, include woody trees and shrubs. The genera Verbena and Glandularia are herbaceous, and the species of Petrea are lianas (Yuan et al., 2010).
Lippia alba is used as a natural ingredient in cosmetology (aromatherapy) and the pharmaceutical industry (Pereira et al., 2018). It is one of the most important medicinal plants used, among others, by Brazilian people (Rodrigues et al., 2018). Especially used for its somatic, sedative, antidepressant, and analgesic properties (Pereira et al., 2018; Rodrigues et al., 2018). The essential oil of L. alba also has uses as a stomachic, antispasmodic, digestive, anti-hemorrhoid, and anti-asthmatic (de Souza et al., 2019).
The main problem with Lippia alba is that its sexual reproduction between and within chemotypes is unlikely, due to its genetic variation, suggesting reproductive isolation (Pierre et al., 2011). En L. alba, post-meiotic abnormalities affect the formation of viable pollen grains and are a determining factor of low viability and germination of seeds, presenting important problems in their sexual reproduction (Caetano et al., 2011; Budeguer et al., 2013; Herrera-Moreno et al., 2013).
The asexual reproduction is easy, quick and successful. Additionally, in Colombia the species is subject to a high extractive regime without replacement, causing genetic erosion, being an unattended species without conservation plans-programs.
The genetic structure of natural populations of the genus Lippia has been barely studied (Reis et al., 2014). Previous analyzes using RAPD markers were effective to understand the genetic diversity of species of Lippia spp., and contributed to understanding his adaptation to the environment, conservation, and taxonomic implications (Gomide et al., 2013). Martínez-Natarén et al., (2014), evaluated the degree of genetic diversity in Lippia graveolens in wild populations of Mexican oregano; Viccini et al. (2014) assessed the possible association between the variations in the production of secondary metabolites and genetic traits in 37 accessions ofLippia albafrom various regions in Brazil. dos Santos et al. (2015) to evaluate the chemical diversity ofL. sidoidesgenotypes and determined that the chemical polymorphism concerning the compounds thymol and carvacrol was caused by genotypes.
Microsatellite primers were developed in Brazil and optimized for Lippia alba to characterize the L. alba germplasm by Rocha et al. (2015). The data provide support to characterize germplasm banks, genetic breeding programs for L. alba, and other genetic diversity studies and classifications of species in the genus Lippia. In Brazil, do Amaral et al. (2017) obtained 74/97 polymorphic bands in L. alba, confirming genetics and phytochemistry variability among genotypes of the same region using ISSR markers. In L. sodoides and L. gracilis, 11/20 microsatellites markers showed polymorphism, proving its effectiveness in assessing the genetic diversity of promissory species (Santos et al., 2014).
Random Amplified Markers-RAM (Ng and Tan, 2015; Grover and Sharma, 2016), has been evaluated in Prunus dulcis (Rasouli et al., 2015), Opuntia focus indica (Zarroug et al., 2015), Helianthus annuus (Sala et al., 2017), fungal biodiversity (Shamim et al., 2017), the population structure of Hymenoscyphus fraxineus (Burokiene et al., 2015), genetic variation in Phlebiopsis gigantean (Dar et al., 2017) and phytopathogens (Gharbi et al., 2014; Nath et al., 2016) in species of economic importance.
The research was designed to obtain estimates of the genetic diversity and spatial genetic structure of Lippia alba in Colombia, to determine: a) the relationships between genetic and spatial distances and b) the factors that cause changes in the amount of variation between populations and localities; in two contrasting populations of L. alba in Colombia: Chicamocha (Tropical dry forest) and Sumapaz (Tropical humid forest).
MATERIALS AND METHODS
Fifty-nine introductions of Lippia alba were collected from different localities in two Colombian ecological zones; Region I: Sumapaz (4,3124166N, -74,493694W), with 35 collections; and Region II: Chicamocha (6,5683333N, -73,1400277W), with 24 collections. Four individuals per introduction made up the work sample. These introductions were part of a germplasm bank of a transitory collection in vivo and ex situ at the National University of Colombia-Palmira. Details of collection data in Cardona (2014).
DNA extraction. The protocol 'A-2X' of DNA extraction for aromatic species developed by Vega-Vela and Chacon (2011) was used. Total DNA was extracted from 100-200 mg of fresh leaf tissue from each introduction by the A-2X method. The quality and concentration of the DNA were evaluated in a 0.8% agarose gel. DNA integrity was confirmed by 0.8% TBE buffer polyacrylamide gel electrophoresis.
RAM technics. PCR was performed for the primers ACA, AG, CA, CCA, TG, CT, CGA, and GT. PCR products were visualized in 7% polyacrylamide gels (37:1) at 160 volts for one hour and Ethidium Bromide staining was done. The mixture for the PCR was: DNA 10.0 ng/µL + TAQ buffer 10X 2.50 µL + MgCl2 2.50. Table 1 shows the amplification protocol used.
Table 1. Amplification protocol with temperature and time by Step-Stage Standardized PCR.
| Step | Tº | t (time) | Stage |
|---|---|---|---|
| 1 | 95 | 5 minutes | Denaturalization |
| 2 | 95 | 30 secondos | Desnaturalization |
| 3 | HT* | 45 secondos | Hybridization |
| 4 | 72 | 2 minutes | Length |
| 5 | 37 | Times from step 2 | |
| 6 | 72 | 7 minutes | Length |
| 7 | 16 | 30 minutes | |
| Primer | HT* | ||
| ACA-AG-CA | 50 | ||
| CCA-TG-CT | 55 | ||
| GT-CCA | 58 | ||
Data analysis. The bands were characterized by the presence/absence in each introduction and the data were entered in a binary matrix 1/0. The allelic and genotypic frequencies (observed and expected); and the values of genetic diversity by locus (h j =1-p 2 -q 2 ) and average (Hi=Σhj/n) of Nei (1987), were calculated using the Program TFPGA v1.3. Potential discrimination of each primer or degree of genetic variability in the population was expressed by the Simpson Coefficient (H=Σ (1- Σpi 2 )/n), where pi is the frequency of the i th allele and n is the number of loci detected by each primer (Manica-Cattani et al., 2009). For all pairs of genotypes, the genetic similarity values were calculated using the Dice-Nei coefficient (Kosman and Leonard, 2005), which excludes the 0-0 value as an indicator of similarity (Manica-Cattani et al., 2009). To determine the level of genetic differentiation, the GenAlEx program was used (Peakall & Smouse, 2006). In addition, four statisticians were estimated based on the specific number of alleles per locus within accession.
RESULTS AND DISCUSSION
Nei’s genetic diversity value for the sample was low (D=0.2467). Molecular diversity estimates for seven RAM ranged from 0.1219 - 0.3485 (Table 2). Seven of eight primers amplified, generating consistent and reproducible bands at 94 loci. The expected Heterogeneity was 0.4008. Each primer generated 13.43±4.43 average loci (Table 2), with P i =91.49% of polymorphic loci. The ACA, AG, CGA, and CCA primers showed high values of genetic diversity per locus (h j ), close to the maximum of 0.5. The Discriminant-H-values of the primers ranged from 0.1755 to 0.9813. The allele frequencies took all possible values between 0 and 1, with important variations between and within primers. The averages for the statisticians were specific: n x =25.97; Ae x =2.4062; P x =0.9260; Ho x =0.4008; He x =0.3595; and the DGX=0.2467 (Table 2). The number of alleles individually in each amplified sequence can be displayed in Cardona (2014).
Table 2. The number of loci, polymorphisms, and values of genetic diversity.
| DG (Nei, 1987) | |||||||||||||||
|---|---|---|---|---|---|---|---|---|---|---|---|---|---|---|---|
| LOCI | AMONG | WIHTING | INTRODUCTIONS | ||||||||||||
| Primer | Seq. | No. Loci | Poly | Mono | DG | N | Ae | P | Ho | He | Hi | Pi | Hi | Multi | Mono |
| 1 | ACA | 19 | 19 | 0 | 0.3339 | 26.42 | 3.7245 | 1.0000 | 0.4478 | 0.7315 | 0.3603 | 0.9831 | 0.7656 | 58 | 1 |
| 2 | AG | 14 | 14 | 0 | 0.3425 | 37.07 | 0.1427 | 1.0000 | 0.6283 | 0.4994 | 0.4298 | 0.9661 | 0.5634 | 57 | 2 |
| 3 | CA | 19 | 13 | 6 | 0.1219 | 49.32 | 0.0638 | 0.6842 | 0.8359 | 0.1755 | 0.4776 | 1.0000 | 0.2991 | 59 | 0 |
| 4 | CGA | 9 | 8 | 1 | 0.1718 | 11.89 | 1.3930 | 0.8889 | 0.2015 | 0.9202 | 0.1765 | 0.7966 | 0.9270 | 47 | 12 |
| 5 | CCA | 8 | 8 | 0 | 0.3317 | 23.63 | 6.6881 | 1.0000 | 0.1250 | 0.9813 | 0.3252 | 0.9322 | 0.8001 | 55 | 4 |
| 6 | TG | 11 | 10 | 1 | 0.2483 | 22.45 | 0.4339 | 0.9091 | 0.3806 | -1.3048 | 0.1363 | 1.0000 | 0.9632 | 59 | 0 |
| 7 | GT | 14 | 14 | 0 | 0.1768 | 11.00 | 2.0549 | 1.0000 | 0.1864 | 0.5134 | 0.0000 | 0.0000 | 0.8136 | 0 | 59 |
Specific Statisticians (N=average number of alleles/locus, Ae=effective number of alleles, P=proportion of polymorphic loci, Ho=heterozygosity observed, He=expected heterozygosity), and statisticians by accession (Pi=Proportion of accessions multilocus, Hi=average heterozygosity by accession).
Eighty-six of 94 loci were found to be polymorphic. The number of loci by primer was in your order ACA=CA>AG=GT>TG>CGA>CEC and the proportion of polymorphic loci was high (0,907).
Molecular genetic diversity estimated had an intermediate value on the 0-0,5 Nei’s scale for RAM. Values distributed across the minimum-maximum range 0.167≤Mgd≤0.332 is rated as ‘medium’. These values are common in Colombia for L. alba and Lippia origanoides H.B.K (Suárez et al., 2007; Suárez et al., 2008). The values of genetic variability for L origanoides (H=0.453) in Colombia estimated by Suárez et al. (2008), were lower than those found by Manica-Cattani et al. (2009) among L. alba accessions collected in southern Brazil, with mean values of 0.565 for ISSR and 0.625 for RAPD.
The degree of genetic variability was high (H=0.7356). The potential discrimination of each primer expressed by the Simpson Coefficient showed values between 0.2991 for the AG primer, to 0.9632 for the TG primer. However, for species such as L. alba and L. origanoides, these values (H=0.484) are common in Colombia (Suárez et al., 2007; Suárez et al., 2008). On the other hand, Manica-Cattani et al. (2009) found high genetic variability among L. alba introductions collected in southern Brazil, with average values of 0.565 for ISSR and 0.625 for RAPD.
In the sample job, the allelic frequencies showed all possible values within the range, a factor that can be considered characteristic of RAM. Different from the frequencies obtained by Manica-Cattani et al. (2009), with extreme high (>0.90) and low (<0.10) values in Brazilian accessions with the same type of dominant marker (RAPD and ISSR). The discriminating power of RAMs has been valued in local plant genetic resources including heliconias (Arcos et al., 2004), native trees of Psidium guajava (Muñoz et al., 2008; Sanabria et al., 2006), Rubus spp (Muñoz et al., 2008), cape gooseberry (Bonilla et al., 2008).
Viccini et al. (2014), evaluated the degree of genetic diversity in nine Lippia species such as (L. corymbosa, L. diamantinensis, L. filifolia, L. florida, L. hermannioides, L. lupulina, L. rotundifolia, L. rosella and L. sidoides) from southwestern Brazil. The average interspecific genetic distance was similar for all species and higher than the intraspecific distances. Species with limited presence showed lower interspecific diversity. The dendogram by the UPGMA method showed larger groups with a clear differentiation between species (Viccini et al., 2014).
Suárez et al. (2007) conducted a pilot study in Lippia origanoides, L. alba, and L. citriodora to observe intra and inter specific polymorphisms in four regions of cpDNA, ribosomal DNA STIs, and 50 ISSR loci. Three of four cpDNA regions (petA-psbE, tnrL-trnF and trnL intron) and the ITS region showed mostly interspecific variation. Seventeen ISSR regions from 50 loci analyzed showed polymorphisms, both inter and intraspecific. Sequence divergence between species pairs in the plastid region showed ranges of 0.4% to 1%, while the divergence in ITS region sequences was about 5%. The results obtained suggest that the STI regions, as reported for other plant genera, may become a region of choice for population genetics studies in this type of species. The genetic diversity values described by Suárez et al. (2008) in Lippia origanoides (related Verbenaceae cross-pollinated plants) were for percentage of polymorphic loci 86-21%; Shannon diversity index of 0-453; and for average panmitic heterocigocity of 0-484.
Genetics differentiation level between populations. Analysis of molecular variance-AMOVA and Ftest, showed the lowest haplotypic variation among the population (Est.Var.AP=0,141), with remaining (95%) distributed within the population (Est.Var.WP=2,46). The value FPT was 0.054 (p<0.001), signaling small genetic differentiation between regions (Table 3).
Table 3. AMOVA and FPT test values for 58 Colombian accessions L. alba.
| Source | Df | SS | MS | Est. Var. | Proportion |
|---|---|---|---|---|---|
| Among Pops | 1 | 6.381 | 6.381 | 0.141 | 5% |
| Within Pops | 56 | 137.744 | 2.460 | 2.460 | 95% |
| Total | 57 | 144.125 | 2.601 | 100% | |
| Stat | Value | P(rand >= data) | |||
| PhiPT | 0.054 | 0.001 | |||
| PhiPT max | 0.948 | ||||
| Phi'PT | 0.057 | ||||
Principal Coordinates Analysis-ACP, AMOVA, and Bayesian analysis conducted by Suárez et al. (2008) on Colombian populations of L. origanoides revealed a low level of genetic differentiation between two localities within the Chicamocha Canyon-Colombia, suggesting a single population of Lippia origanoides. The levels of Genetic Diversity-GD in this population expressed as a percentage of polymorphic loci (P=86.21%), the Shannon diversity index (I=0.453) and the average panmitic heterocigocity (HB=0.484), are comparable to the GD levels of other related cross-pollinated Verbenaceae (Suárez et al., 2008).
The similarity matrix between the two groups, based on the Nei and Li coefficient, PCoA and Mantel analysis (Figures 1 and Figure 2), revealed the existence of different geographic clusters in each subpopulation. The level of differentiation between the two populations was relatively low but significant. Martínez et al. (2008) obtained the same result in L. origanoides, a related species, in the Chicamocha-Colombia region. Mantel analysis grouped individuals by their characteristics or geographical proximity. Spatial autocorrelation analyses showed a consistent pattern of isolation by distance with a moderate but significant level of spatial structure. These results suggest serve as proposed by Suárez et al. (2008), those who refer to sample this type of Verbenaceae at distances greater than 1.2 km obtaining different genotypes, which would help preserve GD levels. The causes of this spatial pattern are unknown and may be associated, among others, to restricted dispersal of seed or pollen movement short distances (Suárez et al., 2008).
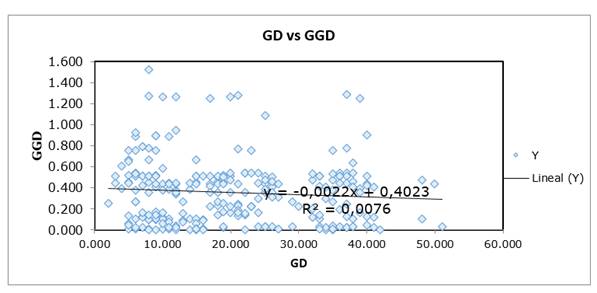
Figure 1. Region_1: Chicamocha. Mantel results for Genetic Diversity-GD vs Geographical Genetic Diversity-GGD.
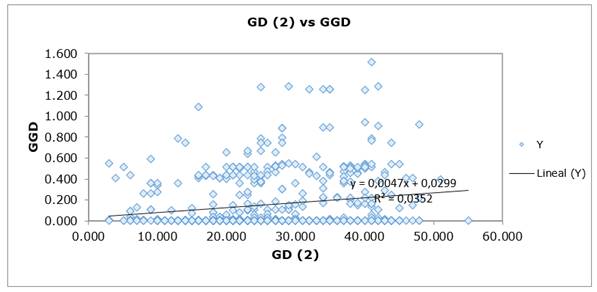
Figure 2. Region_2: Sumapaz. Mantel results for Genetic Diversity-GD vs Geographical Genetic Diversity-GGD.
Spatial structure. The analysis of the spatial global structure shows that the subpopulation Sumapaz is structured, whilst the subpopulation Chicamocha, is in structuring process. The relationship between geographic distances and distances of Nei was significant (p≤0.001), indicating isolation by distance between the subpopulations (Figure 3 and Figure 4). The relationship between geographic distance and genetic distance, was significant for Sumapaz region (p≤0.04) and non-significant for Chicamocha region (p≥0.23); indicating isolation by distance in Sumapaz and not isolation by distance in Chicamocha. Figure 3 show the spatial structure between populations. The correlogram (Omega = 97.136) for the sub-population Sumapaz showed spatial structure significant (0.001 P(Omega-rand≥Omega-data)). The correlogram (Omega=28.488) to the spatial structure of the population Chicamocha was not significant (0.098 P (Omega-rand≥Omega-data)). The overall spatial structure analysis shows that the subpopulation Sumapaz is structured, while that Chicamocha, no.
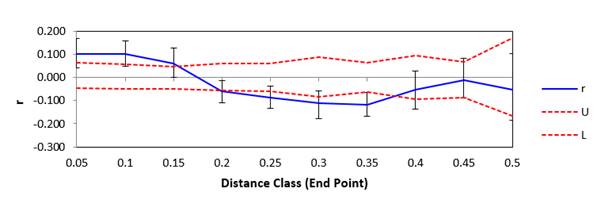
r= Mantel Statistician; U= Upper limit; L=Lower limit
Figure 3. Pooled spatial structure for the two populations (Chicamocha and Sumapaz).
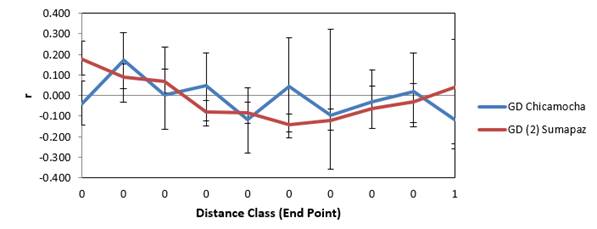
GD= Genetic Diversity; r= Mantel Statistician
Figure 4. Spatial structure for each sub-population, Chicamocha y Sumapaz, based on Genetic Diversity-GD.
Biologically, population structuring processes are attributable to: (i) contrasting local environmental conditions and (ii) use-consumption as anthropic factor, (iii) genetic factors, (iv) possible polyploidies, (v) chemotypes (citral, carvone, linalool), (vi) reproductive isolation, (vii) inviable pollen. Contrasting environmental conditions such as Bs-T in Chicamocha and Bh-T in Sumapaz; and increased use-consumption of the species in the Chicamocha sub-region, are factors causing changes in the amount of variation between the two populations in each locality; and were decisive in the geographical distribution of the genetic diversity found. In the Chicamocha sub-region a greater number of repeated biotypes and chemotypes were found (Cardona, 2014), causing reproductive isolation by mixoploidia. Lower biomass and distance between collections were also observed. However, the biotypes collected in the Chicamocha sub-region showed higher content and quality of essential oils (Cardona, 2014).
Four factor that may also be affecting genetic diversity of the populations studied: a) post meiotic abnormalities, determining factor of both low viability and germination of seeds (Reis et al., 2014), having breathing problems of mating (Venâncio et al., 2016); (b) anthropochory (other way of dissemination), c) stenopropagation (vegetative propagation quick and easy) and, d) extractive regime without replacement. Further, restricted seed spread and short distances of pollen movement, proposed by Venâncio et al. (2016).
CONCLUSIONS
In the two sub-populations studied, low genetic diversity and structure were detected. The low genetic diversity found could be based on: i) a significant number of Carvona chemotypes included in the working sample, ii) possible polyploidies (not studied), iii) the creation of reproductive isolation between populations, and of different individuals in the population.
The methodology used allowed us to obtain values of genetic diversity and genetic population structure for each of the populations studied; these values are within the range for different species of the genus Lippia and agree with the common values reported in Colombia by other authors.
Intermediate levels of DG indicate recent isolations, which prevent the development of strong genetic structure of each subpopulation; or low or no gene flow between individuals in each region. Possible barriers are biological with a negative impact on the genetic composition of L. alba. The loss of DG has had an enormous negative impact on the evolutionary potential of the species.
The result obtained here and by other authors, allows us to affirm that the Colombian territory is part of the center of the genetic diversity or primary natural distribution of the species.
Lippia alba as a promising plant genetic resource was susceptible to analysis by the RAM. The discriminant power of the ARS was effective in L. alba based on the results generated in other studies on the species (L. alba) and related species.

