


 Inglés (pdf)
 Articulo en XML
 Referencias del artículo
 Enviar articulo por email
 Citado por SciELO
  Citado por Google
  Similares en
SciELO
Similares en
SciELO  Similares en Google
 Permalink
INTRODUCTION
Currently, the issues that affect environmental quality and produce public health impacts are becoming more relevant to the development of regional and departmental policies to mitigate urban environmental damage. The United Nations reports that, in 1990, only 37% of the total population in developing countries lived in cities, while, by 2025, 61% of the population will be urbanized (FNUAP, 2001). Given the rapid urbanization process, deficient planning has transformed green spaces into narrow and dense housing areas (Krishnamurthy et al., 1998). Urban growth and expansion promote population increase and the migration of people from rural to urban areas. This global phenomenon of urbanization is evident in the increasing demand for new constructions, as well as land, water, and energy (Antrop, 2004). The demand for urban space and energy consumption will continue to increase in the future due to the economic growth of developed and developing regions (Ordóñez, 2015).
Urban green spaces are proposed as elements for sustainability. Furthermore, public green spaces in cities provide various social and ecological benefits that are associated with environmental quality as a life-improving factor (Gutiérrez, 2010). To build healthy cities, the World Health Organization (WHO) recommends adequate availability, accessibility, quality, and security of green spaces, guaranteed by at least 9 m2 of green space per capita (Reyes and Figueroa, 2010). In Colombia, the Ministry of Environment and Sustainable Development (MinAmbiente) developed a methodology based on simple indicators that reflect the environmental condition of urban areas in the country. The use of urban indicators to assess the quality and functionality of green spaces could promote designating an equal green space area per capita to guarantee a fair distribution, as well as support equitable access to green spaces that are safe, inclusive, and universally accessible. In other words, green spaces must be quality areas that are planned according to the sociodemographic characteristics of the population and their needs, merits, and choices (Reyes and Bolea, 2018). The fair distribution of green spaces is a matter of environmental justice since it involves the right of all people to a healthy and dignified environment, which constitutes a basic condition and a goal for urban sustainability.
The environmental indicators and other information used to implement the methodology proposed by MinAmbiente were compiled from environmental or territorial planning instruments, including documents from the secretariat of environmental planning of the city of Pasto in 2014, (Alcaldía del Municipio de Pasto, 2014) development plans, among others. Additionally, research literature on vegetation cover analysis was reviewed.
A low proportion of green areas in urban zones was identified as a key environmental problem. This issue requires identifying and establishing indicators that can become future analysis factors to improve environmental management, decision-making policies, the establishment of environmental priorities, and adjustment of regional policies.
This research aimed to estimate green space area in commune 1 of the city of Pasto under a multi-temporal comparative approach. Moreover, the UEQI was determined based on the environmental conditions assessed in the study area, which allowed mathematically estimating the ideal environmental indicator values for commune 1 in Pasto.
MATERIALS AND METHODS
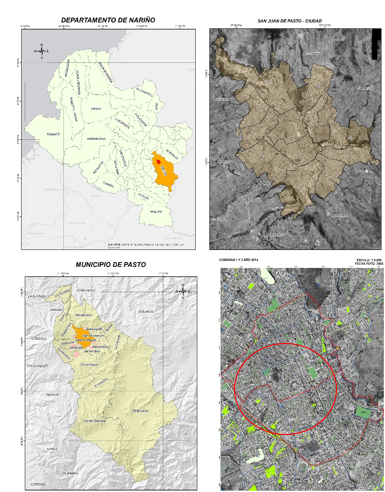
Location. This study was conducted in the urban area of the municipality of Pasto, which comprises 12 communes in a total area of 23.67 km2 and an urban perimeter of 42.26 km (Alcaldía de Pasto, 2014). The population is 360,238 inhabitants, with non-uniform distribution. The city is located at geographic coordinates 1°12’42”N and 77°16’43”W, with an average elevation of 2,540 m and mean temperature of 19°C (Alcaldía de Pasto, 2014). Commune 1 was selected as study locality to determine the UEQI since it displays a stationary population density, deficient UVC, and an urban growth model (Figure 1).
Digital data. This study analyzed two LANDSAT satellite images, identified as path 009 and row 59, which were provided by and downloaded from the United States Geological Survey (USGS, 2018). Table 1 shows the dates of the LANDSAT 5 and LANDSAT 8 images.
Table 1. Characteristics of Landsat 5 and 8 images.
| Scene ID | Date | Sensor |
|---|---|---|
| p009r059_4dt19890807_z18 | 07/08/1989 | TM |
| LC80090592016238LGN01 | 25/08/2016 | ETM+ L1T |
Secondary information. The UEQI is estimated based on indicators that reflect the environmental condition of urban areas. The information for these areas was consulted and compiled from environmental and territorial planning instruments that were available from national, regional, and local databases (MinAmbiente, 2016).
Software. The use of informatics tools was fundamental for digital processing and analysis of satellite images (Table 2).
Table 2. Software used in this study to process satellite images and digital geographic information.
| Activity | Software | Description |
|---|---|---|
| Satellite image processing | ERDAS IMAGINE | Visualization, processing, and analysis of satellite images, aerial photographs, and other remote material. |
| Geographic information system (GIS) | ArcGis 10.5 | Computer framework to submit, process, analyze, and visualize digital geographic information. |
Multi-temporal analysis. A multi-temporal analysis assesses changes in a geographic space over a period of time, which allows determining the substantial changes that occurred in a landscape, lot, or township at the environmental and population levels due to natural or anthropic causes. These changes can refer to land cover, soil use, urbanization, wetland invasion, and disruption of water sources from mining, landfills, or other causes. The satellite image scenes were used as the primary input for our multi-temporal analysis. Two evaluation dates were established, namely August 7 of 1989 and August 25 of 2016, according to availability, spectral resolution quality, and spatial resolution criteria. The normalized difference vegetation index (NDVI) was calculated for each period, using red and near-infrared (NIR) spectral bands and following the methodology proposed by Gates (1980) and optimized by Senanayake et al. (2013). To improve the graphic results of the NDVI, the deficiencies resulting from soil contamination and the presence of areas with high biomass that cause saturation in the reflected energy were corrected. An adjustment factor, which characterizes the vegetation cover, was applied to the NDVI (Xu et al., 2013) to improve the informative quality of the images and obtain the soil-adjusted vegetation index (SAVI).
Estimating the urban environmental quality index (UEQI). The methodology proposed by MinAmbiente was analyzed and adapted to estimate the current level of environmental quality for commune 1 in Pasto. Next, detailed information on the environmental indicators was compiled, including equations, reference values, scores, and the minimum data required to apply the equations, which were consulted in the document titled Base metodológica ICAU version two (MinAmbiente, 2016).
To estimate the index, the units of the compiled data were homogenized, except for urban vegetation cover per capita, which was directly generated based on geoprocessing analyses of satellite images of commune 1 using SIG software. Next, vectorization was applied to calculate urban vegetation cover (UVC). Particularly, it was found that commune 1 has the greatest deficit of urban vegetation cover (UVC).
The scores for each indicator were obtained based on the matrix of reference values for the direct and indirect indicators (MinAmbiente, 2016). According to these values, the score scale ranges from zero to one, indicating the lowest and highest conditions of the indicator, respectively (Table 3).
Table 3. Score scale for the indicators according to the reference values.
| Score | Classification |
|---|---|
| 0 | Very low |
| 0.3 | Low |
| 0.5 | Medium |
| 0.8 | High |
| 1 | Very high |
Relationship between vegetation cover and environmental benefits. The specific values for commune 1 were used to determine the indicators of the UEQI. Next, these values were contrasted and projected by extrapolating the data and obtaining mathematical estimations that could lead to enhancing areas with vegetation cover. The projected values were based on the theoretical benefits of urban green spaces.
RESULTS AND DISCUSSION
The level of vegetation in the mapped NVDI is expressed on a grayscale with values ranging from -1 to 1, according to the pixels. Values close to 1 indicate the presence of vegetation (light gray) and values close to -1 indicate absence or loss of vegetation cover (black) in the communes lined in red in the city of Pasto between 1989 and 2016 (Figure 2).
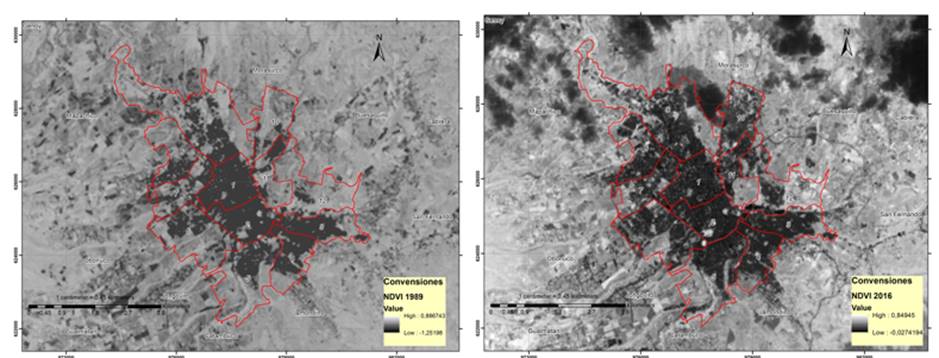
Figure 2. Political distribution of the city of Pasto by communes. (NDVI images for 1989 (left) and 2016 (right)).
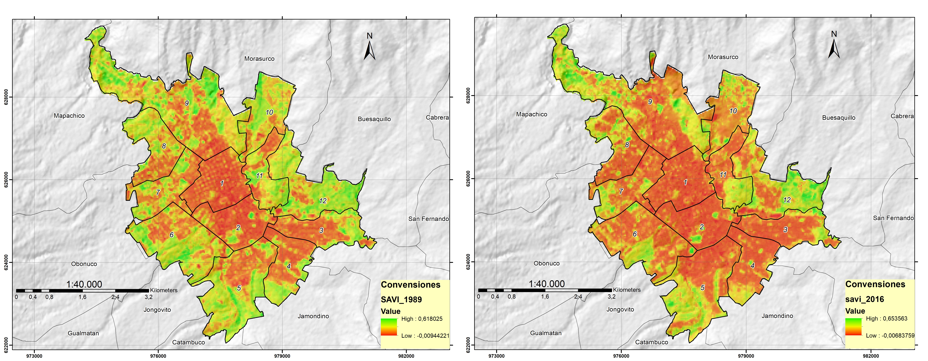
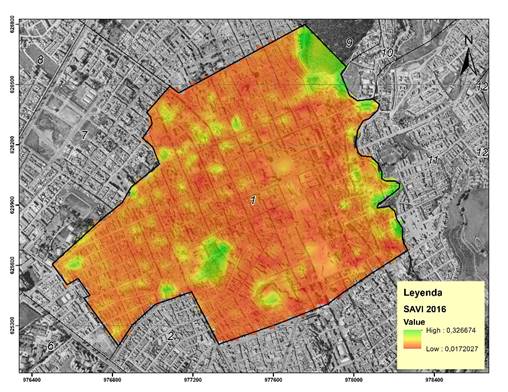
The soil-adjusted vegetation index (SAVI) was applied to generate color maps showing the vegetation density measured through green-red colorimetry. Red indicated the absence of vegetation, while green indicated soil-adjusted vegetation (Figure 3). The estimation of this index allowed identifying the loss of vegetation cover in the city of Pasto, mainly in commune 1 that is located in the city center. Moreover, communes 6, 9, and 12 showed important differences in urban vegetation cover between the two periods, mostly due to a marked population increase in neighborhoods in these communes that are located in the periphery. The main cause of land-use conflicts in the city periphery is urban expansion that does not follow an ordering scheme. Likewise, commune 1 also showed a minor amount of green space, resulting from a lack of planning and scarce knowledge on the benefits provided by urban vegetation. Particularly, commune 1 is among the oldest in the city (Ruales, 2018) and prioritizes educational, commercial, and administrative establishments, among others; therefore, this commune has high commercial and economic transit (Ruales, 2018).
Based on the index values, commune 1 showed the lowest urban vegetation cover (UVC) (69,987 m2), due to the characteristics of the locality, such as a highly dense population (17,995 residents) (DANE, 2002) and a reduced vegetation cover area per capita (3.9 m2/capita) (Table 4). The results found for commune 1 led to selecting this locality as the geographic unit of study to estimate the urban environmental quality index (UEQI).
Table 4. Comparison of urban vegetation cover per commune in Pasto between 1989 and 2016.
| Commune | UVC (m2) 1989 | UVC (m2) 2016 |
|---|---|---|
| 1 | 70,312 | 69,987 |
| 2 | 173,243 | 111,005 |
| 3 | 482,035 | 320,400 |
| 4 | 493,993 | 257,200 |
| 5 | 1,600,860 | 1,201,733 |
| 6 | 1,452,466 | 732,734 |
| 7 | 640,099 | 396,995 |
| 8 | 763,331 | 430,478 |
| 9 | 2,624,468 | 2,091,386 |
| 10 | 1,002,955 | 561,680 |
| 11 | 644,827 | 487,205 |
| 12 | 1,812,653 | 1,370,000 |
| Total area in Pasto (m2) | 11,269,242 | 8,030,803 |
Calculating indicators in commune 1
The study conducted by MinAmbiente calculated nine direct and five indirect environmental indicators with high reliability (MinAmbiente, 2016). However, the National Report on Urban Environmental Quality (2016) for urban centers with 100,000 to 500,000 residents mentions that the results of the study did not report all of the proposed indicators. This is due to the lack of information sources, non-reliable or invalidated information, and insufficient actions to compile information that allowed determining strategic issues for environmental management of urban areas (Table 5).
Duran (2005) infers that environmental quality indicators are spatially correlated. However, the results of the direct and indirect environmental indicators in commune 1 are highly variable. This finding may indicate the presence of environmental problems, such as vegetation cover area, that must be addressed to achieve an ideal environmental quality.
In a similar study, Angel et al. (2017) identified 13 out of 16 indicators in the checklist proposed for the UEQI when studying the locality of Kennedy in Bogotá. Information gaps were detected in the study by Angel et al. (2017) since the authors did not obtain 100% of the indicators. However, this study obtained all of the indicators for UEQI. Particularly, the values for air quality and household water and energy consumption per capita were calculated from information for the city of Pasto given the difficulty to obtain commune-level information.
To calculate the urban environmental quality index (UEQI), MinAmbiente (2016) considered the existing environmental indicators systems, as well as international and local initiatives. UEQI was developed by Universidad del Valle for the municipality of Cali and provides a high spatial resolution since it can be implemented at the commune, locality, or neighborhood levels. Therefore, this approach was convenient and appropriate for commune 1 in San Juan de Pasto. The spatial distribution of environmental quality by communes shows an indirect relationship with distance to the city center; accordingly, the city periphery shows a better environmental quality and higher socioeconomic level (Duran, 2005).
Based on the methodology proposed by MinAmbiente (2016), the environmental quality of commune 1 in the city of San Juan de Pasto is low since it is found within a score range of 40.1 to 60 points. This result indicates that the environmental quality of commune 1 is an important core of action. Furthermore, city rulers and commune residents must prioritize the promotion of strategies to improve environmental quality. According to the report on urban environmental quality, cities such as Soledad, Barranquilla, Ibague, Cali, and Pasto also show low environmental quality (MinAmbiente, 2016).
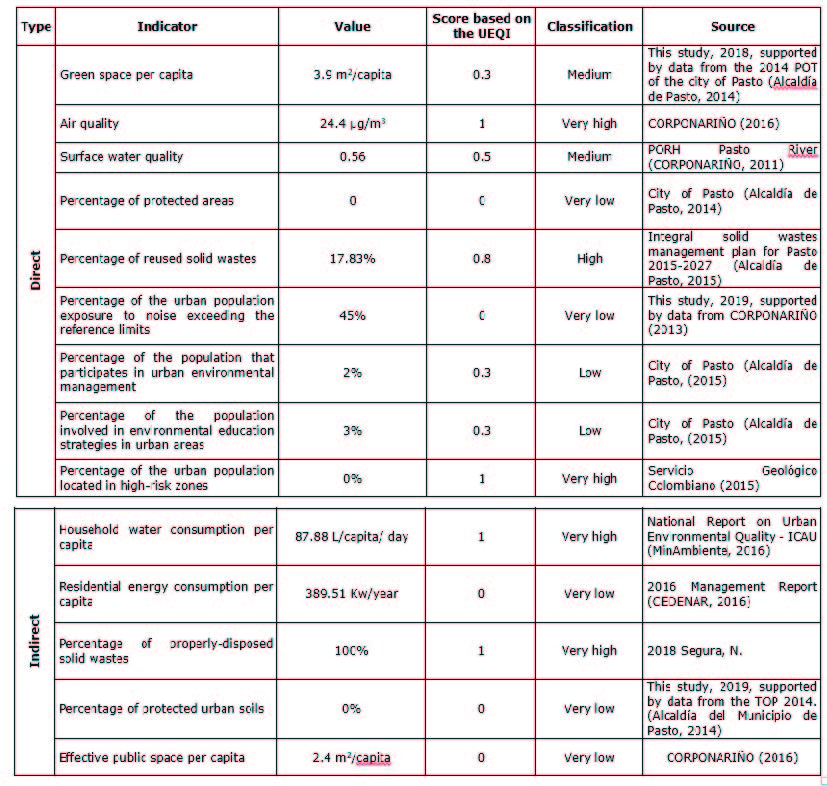
In terms of urban vegetation cover for commune 1, we determined a green space area of 3.9 m2/capita. Only two representative zones with UVC were identified in Colegio Pedagógico and the internal forest of Colegio San Francisco de Asis, which cover a total area of 69.987 m2 and contribute to a score of 0.3 for the UEQI. These findings differ from the green space area of 9 m2/capita recommended by the World Health Organization (WHO) (Reyes and Figueroa, 2010) (Figure 4).
Based on the meteorological data used in this study, a concentration of 24.4 µg/m3 of PM10 was determined. This concentration is found within the permissible levels according to Resolution 610 of 2010 of the Ministry of Environment and Sustainable Development (MinAmbiente, 2010). Furthermore, this PM10 value contributes to a score of 1 for the UEQI. On the other hand, a water quality index of 0.56 was found, established by IDEAM, which corresponds to a UEQI of 0.5 and indicates a medium water quality at the sampling point located in Colegio Pedagogico of commune 1.
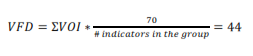
The group of direct indicators represents 70% of the total score; particularly, water quality and percentage of the urban population located in high-risk zones show high scores (UEQI of 1) compared to the other indicators. Moreover, the percentage of reused solid wastes received a high score (0.8) and surface water quality obtained a medium score (0.5). The remaining direct indicators show very low scores (0-0.3), which contributed to a final score of 30 for the direct indicators.
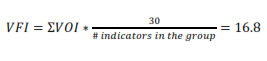
The group of indirect indicators represents 30% of the total score, specifically, residential water and energy consumption received very high scores (UEQI of 1). Conversely, the remaining indirect indicators show very low scores (UEQI of 0), providing a final score of 12 for the indirect indicators. Overall, based on the compiled information and the score estimates for the direct and indirect indicators, a final UEQI score of 42 points was determined, indicating low environmental quality (MinAmbiente, 2016).
Benefits of urban vegetation cover. The following projections were established to improve the UEQI, based on the benefits of UVC on other environmental indicators.
Indicator No. 1 Green space area per capita. Based on the WHO recommendation for an ideal UVC (9 m2/capita), the total UVC in commune 1 should be 161.955 m2, which would improve the UEQI score for this indicator (UEQI of 1). Therefore, there is a deficit of 91.968 m2 of green space given the actual UVC (3 m2/capita) (Table 6). This insufficient UVC is directly related to the goods and services provided by commune 1 to the territory.
Table 6. Urban vegetation cover for commune 1 of the city of Pasto.
| Variables | Real | Projected |
|---|---|---|
| Green space m2/capita | 69.987 | 161.955 |
| align="justify">Population | 17.995 | 17.995 |
| align="justify">m2/capita | 3.9 | 9 |
Indicator No. 2 Urban population exposure to noise. Vegetation cover is an excellent sound attenuator, especially at low frequencies. For instance, a vegetation cover of 20 m2 can reduce up to 40 dB (Posada et al., 2009). Therefore, by optimizing UVC according to the WHO recommendation (9 m2/capita), there would be a reduction a 15.1 dB in sound, contributing to a noise exposure level of 49.9 dB in commune 1. This ideal scenario would improve the UEQI score to 1 or “very high” (Table 7).
Table 7. Response of green space and noise indicators to an increase in urban vegetation cover.
| Indicators | Real | Projected |
|---|---|---|
| Green space m2/capita | 3.9 | 9 |
| Noise exposure (decibels) | 65 | 49.9 |
| Reduction | 15.1 |
Indicator No. 3. Residential energy consumption per capita. According to Scott et al. (1998), a 10% increase in urban vegetation cover will reduce energy use for heating and cooling by 15 to 20%. This represents an overall energy saving of approximately 3% of net consumption. This study estimates that an optimal UVC, according to the WHO recommendation (9 m2/capita), will generate an energy saving of 109.1 Kw/capita per year, which would improve the UEQI to 0.8 (high). This indicator does not estimate or account for technological upgrades in the households of the study zone (Table 8).
Table 8. Response of the residential energy consumption indicator to an increase in urban vegetation cover.
| Variables | Real | Projected |
|---|---|---|
| Green space m2/capita | 3.9 | 9 |
| Consumption Kw/capita | 389.5 | 280.4 |
| Energy saving Kw/capita | 109.1 |
Indicator No. 4. Air quality. Darlington et al. (2001) state that 1 m2 of vegetation cover traps 130 g of dust per year. this study estimates that an optimized UVC, according to the WHO recommendation (9 m2/capita), will reduce suspended particulate material by 8µg/m3, achieving a UEQI score of 1 and a classification of “very high” for air quality. Thus, this research establishes an ideal reduction of 8µg/m3 in suspended particulate material in the air for commune 1 (Table 9).
Table 9. Response of the air quality indicator to an increase in urban vegetation cover.
| Variables | Real | Projected |
|---|---|---|
| Green space m2/capita | 3.9 | 9 |
| PM10 ug/m3 | 24.4 | 16 |
| Reduction ug/m3 | 8 |
Based on all the projected values according to the recommended UVC (WHO), a new UEQI of 60 points was estimated for commune 1 (Table 10), which corresponds to high environmental quality and optimizes the values for the indicators assessed by MinAmbiente.
Table 10 Estimation of the environmental quality index under ideal parameters.
| Type | Indicator | Score | Calculation | |
|---|---|---|---|---|
| Direct | Green space per capita | 1 |
|
|
| Air quality | 1 | |||
| Water surface quality | 0.5 | |||
| Percentage of protected areas | 0 | |||
| Percentage of reused solid wastes | 0.8 | |||
| Percentage of urban population exposure to noise exceeding the reference level | 1 | |||
| Percentage of the population that participates in urban environmental management | 0 | |||
| Percentage of the population involved in environmental education strategies in urban areas | 0.3 | |||
| Percentage of the urban population located in high-risk zones | 1 | |||
| Indirect | Household water consumption per capita | 1 | ||
| Residential energy consumption per capita | 8 |
|
||
| Percentage of properly-disposed solid wastes | 1 | |||
| Percentage of urban protected soils | 0 | |||
| Effective public space per capita | 0 | |||
| Total UEQI: |
|
60 | ||
Overall, this study determined that UVC can extensively modify urban environmental quality. This finding prompts the need for strategies that adapt to city morphologies; particularly, green roofs or vertical gardens can be optimal systems to improve urban environmental quality (Fernández et al., 2013).
CONCLUSIONS
Based on the analysis of urban vegetation cover, a current UEQI score of 42 points was obtained for commune 1, indicating low environmental quality for residents of this locality in the city of San Juan de Pasto.
The expansion of the city of Pasto is due to urban area growth, which is mainly driven by demographic growth in all its dimensions.
The loss of urban vegetation cover in Pasto is more evident in communes 1 and 2, which display a lower vegetation cover area. Consequently, the deficit in UVC in these localities should be addressed considering the benefits provided by vegetation.
For commune 1 in the city of Pasto, a green space area of 3.9 m2/capita was determined, which is much lower than the value recommended by the WHO. Therefore, green space area must be substantially improved by transforming the available open spaces into green spaces. This approach will allow achieving an optimal condition of 9 m2/capita, capable of changing the overall UEQI values.
According to the mathematical projections in this study, nearly 10% of the total area of commune 1 should have urban vegetation cover to meet the global recommendations or goals.

