


 Inglés (pdf)
 Articulo en XML
 Referencias del artículo
 Enviar articulo por email
 Citado por SciELO
  Citado por Google
  Similares en
SciELO
Similares en
SciELO  Similares en Google
 Permalink
INTRODUCTION
Windbreaks are an effective management activity for reducing soil erosion, protecting buildings, livestock and roads, providing wildlife habitat, enhancing landscape aesthetics, and mitigating odor, dust, and pesticide drift from agricultural operations, as well as many other services (Tyndall and Colletti 2007; Brandle et al. 2009). Additionally, they are being regarded as an effective strategy for sequestering more carbon in United States agricultural lands (Follet et al. 2011, Schoeneberger 2009). Despite the capacity of windbreaks to sequester C in agricultural operations while providing many other valued co-benefits, little work has been done to document this potential in the United States and many questions remain (Sauer et al. 2007).
Updated, standardized and representative statistics on carbon storage and emissions reductions are not available for this agroforestry practice (Udawatta and Jose, 2011; Nair, 2011, Schoeneberger et al., 2012). Although the limited literature indicates net gains in carbon sequestration by windbreaks, lack of rigorous data on the area under this practice (Dixon, 1995; Nair et al., 2010; Schoeneberger et al., 2012), consistent experimental procedures, and data-gathering protocols (Udawatta and Jose, 2011; Nair, 2011) make these data very difficult to compare and generalize.
Carbon storage potential for windbreaks has been derived from current forest inventory, stand-based equations and sometimes limited field data (Udawatta and Jose, 2011). Final results have been based on different methods and procedures making estimations vary widely. Several methodological challenges face researchers interested in making comparisons among and aggregating these estimates.
Despite the limited data, some estimates for the carbon storage potentials of U.S. windbreaks, using different approaches, have been reported. Unfortunately, these estimates were based on different biomass calculations, geographic location, and windbreak arrangement and conditions. Nair and Nair (2003) projected 85 million ha under windbreaks and sequestration potential of 4 Tg C per year. Based on estimate of 94 million ha of cropland in the North Central region, Brandle et al., (1992) reported a potential of 215, 13 and 0.18 Tg C during 20 years by windbreaks for protection of crops, farmsteads and roads, respectively. Such approaches create disparity in the estimates; greatly limiting their use and demonstrating the need standardized experimental procedures and data gathering protocols (Nair, 2011; Udawatta and Jose, 2011).
Evaluating the carbon storage potential for standardized windbreak designs can provide the basis to generate accurate information for this agroforestry system in different scenarios and in different regions. The purpose of this study was to evaluate the carbon storage potential for different windbreak designs in nine regions of the continental United States.
MATERIALS AND METHODS
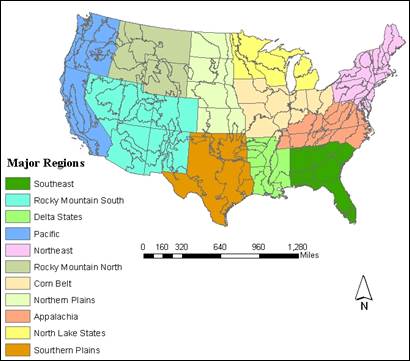
Using an extensive query of Forest Inventory and Analysis data (USDA-FIA, 2019) and peer-reviewed articles, relevant allometric equations for the major ecoregions where windbreak use is applicable were collected and compared for use with 16 tree species (8 hardwoods and 8 conifers) commonly used in windbreak plantings and growing in different ecoregions (Figure 1). The 23 states in the continental United States selected for this study were grouped into nine regions (Figure 1) based on three main criteria: 1) located in almost identical Major Land Resource Areas (MLRA) (USDA-NRCS, 2006), 2) sharing the same ecoregions (Bailey, 1995, USDA-FS 2014), and 3) having trees periodically re-measured in the FIA data set (USDA-FS 2015).
The nine natural regions of the United States of America were: Northern Lake States (NLS), Corn Belt (CB), Southern Plains (SP), Delta States (DS), Appalachia (AP), Rocky Mountains North (RMN), Rocky Mountains South (RMS), North East (NE), and Northern Plains (NP), containing different states (Figure 1). These regions encroach some very cold and hot weathers in the north and south respectively, with humid conditions in the coasts.
In these regions, the study was confined to field and farmstead windbreak systems in the US. To design the windbreak structures, it was used the tree spacing defined in the practice standards for windbreaks under code 380 (USDA-NRCS, 2009). Field windbreak designs contained from one-row to three-rows of the deciduous and conifer trees (Tables 1 and Table 2). Farmstead windbreak designs varied from a minimum of three-rows for southern regions to a maximum of ten-rows for northern regions (Table 3) with a mixture of tree species. From these designs, above and belowground carbon storage potential values were calculated.
Table 1. Tree distribution and amount per hectare (Area-based approach) in different field windbreak designs.
| Field windbreak design | Rows | Tree spacing (m) | Number of trees per hectare | ||||||
|---|---|---|---|---|---|---|---|---|---|
| Within | Between2 | Sh1 | Scon | Tdc | Tcon | ||||
| One row small shrub | 1 | 1.2 | - | 6,831 | - | - | - | ||
| One row small coniferous | 1 | 2.0 | - | - | 2,525 | - | - | ||
| One row tall deciduous | 1 | 3.5 | - | - | - | - | 814 | ||
| One row tall coniferous | 1 | 3.0 | - | - | - | 1,111 | - | ||
| Two rows tall deciduous | 2 | 3.5 | 6.0 | - | - | - | 474 | ||
| Two rows tall coniferous | 2 | 3.0 | 6.0 | - | - | 553 | - | ||
| One row tall coniferous and one row tall deciduous | 2 | 3.5x3.0 | 6.0 | - | - | 269 | 234 | ||
| One row tall coniferous and one row shrubs | 2 | 3.0x1.2 | 6.0 | 672 | - | 269 | - | ||
| One row tall deciduous and one row shrubs | 2 | 3.5x1.2 | 6.0 | 672 | - | - | 234 | ||
| One row tall coniferous and one row small conifer | 2 | 3.0x2.0 | 6.0 | - | 827 | 269 | - | ||
| One row tall deciduous and one row small conifer | 2 | 3.5x2.0 | 6.0 | - | 827 | - | 234 | ||
| Three rows tall coniferous | 3 | 3.0x3.0x3.0 | 6.0 | - | - | 553 | |||
| Three row tall deciduous | 3 | 3.5x3.5x3.5 | 6.0 | - | - | - | 474 | ||
| Two rows tall deciduous and one row tall coniferous | 3 | 3.0x3.0x3.5 | 6.0 | - | - | 179 | 312 | ||
| One row tall deciduous, one row tall conifers and one row shrubs | 3 | 3.5x3.0x1.2 | 6.0 | 448 | - | 179 | 156 | ||
| One row tall deciduous, one row tall coniferous and one row small coniferous | 3 | 3.5x3.0x2.0 | 6.0 | - | 276 | 179 | 156 | ||
1 Sh= Shrubs, Scon= Small coniferous, Tdc = Tall deciduous, Tcon= Tall coniferous.
2 For this study, an equipment alley of 6 m width was selected (USDA-NRCS 2009)
Table 2. Number of trees in different field windbreak designs using the length-based approach designs according to NRCS recommendations (USDA-NRCS, 2009).
| Field windbreak design | Number of trees per kilometer | |||
|---|---|---|---|---|
| Sh1 | Scon | Tdc | Tcon | |
| One row small shrub | 820 | - | - | - |
| One row small coniferous | - | 505 | - | - |
| One row tall deciduous | - | - | 285 | - |
| One row tall coniferous | - | - | 328 | |
| Two rows tall deciduous | - | - | 5702 | - |
| Two rows tall coniferous | - | - | - | 656 |
| One row tall coniferous and one row tall deciduous | - | - | 285 | 328 |
| One row tall coniferous and one row shrubs | 820 | - | - | 328 |
| One row tall deciduous and one row shrubs | 820 | - | 285 | - |
| One row tall deciduous and one row small deciduous | - | 505 | - | 328 |
| One row tall deciduous and one row small coniferous | - | 505 | 285 | - |
| Three rows tall coniferous | - | - | - | 984 |
| Three row tall deciduous | - | - | 855 | - |
| Two rows tall deciduous and one row tall coniferous | - | - | 570 | 328 |
| One row tall deciduous, one row tall coniferous and one row shrubs | 820 | - | 285 | 328 |
| One row tall deciduous, one row tall coniferous and one row small coniferous | - | 505 | 285 | 328 |
1 Sh= Shrubs, Scon= Small coniferous, Tdc = Tall deciduous, Tcon= Tall coniferous
2 Two- and three- rows spacing included an equipment alley of 6 m between rows (USDA-NRCS, 2009)
Table 3. Number of trees in different farmstead windbreak designs based on NRCS recommendations (USDA-NRCS, 2009).
| Farmstead windbreak designs | Number of trees in 300 m windbreak | |||
|---|---|---|---|---|
| Sh1 | Scon | Tdc | Tcon | |
| One row shrubs and two rows tall conifers | 2462 | - | - | 198 |
| One row small conifer and two rows tall conifers | - | 150 | - | 198 |
| One row small conifer, one rows tall conifers, one row deciduous and shrubs | 246 | 150 | 87 | 99 |
| Two rows tall conifers, two rows tall deciduous and shrubs | 246 | - | 174 | 198 |
| Two rows tall conifers, one rows tall deciduous and two rows shrubs | 492 | - | 87 | 198 |
| Two rows tall conifers, two rows tall deciduous and two rows shrubs | 492 | - | 174 | 198 |
| Two rows tall conifers, one row small conifer, two rows tall deciduous and two rows shrubs | 492 | 150 | 174 | 198 |
| Three rows tall conifers, three rows tall deciduous and two rows shrubs | 492 | - | 261 | 297 |
| Three rows tall conifers, five rows tall deciduous and two rows shrubs | 492 | - | 435 | 297 |
1 Sh= Shrubs, Scon= Small coniferous, Tdc = Tall deciduous, Tcon= Tall coniferous
2 Two- and three- rows spacing included an equipment alley of 6 m width between rows (USDA-NRCS, 2009).
To estimate the carbon storage potential of these windbreak designs, several allometric biomass equations from Jenkins et al. (2003), for suitability in the prediction of biomass in species of windbreak trees, were analyzed and used (Tables 4 and Table 5).
Table 4. Parameters and equations for estimating total aboveground biomass for all hardwood and softwood species in the United States (Jenkins et al., 2003).
| Species groupa | Parameter | Data pointsb | Max d.b.h (cm)c | RMSEd (log. Units) | R2 | ||
|---|---|---|---|---|---|---|---|
| β0 | β1 | ||||||
| Harwood | Aspen/alder/ cottonwood/ willow | -22.094 | 2.3867 | 230 | 70 | 0.507441 | 0.953 |
| Soft maple/birch | -1.9123 | 2.3651 | 316 | 66 | 0.491685 | 0.958 | |
| Mixed hardwood - | -2.4800 | 2.4835 | 289 | 56 | 0.360458 | 0.980 | |
| Hard maple/oak/ hickory/ beech | -2.0127 | 2.4342 | 485 | 73 | 0.236483 | 0.988 | |
| Softwood | Cedar/larch | -2.0336 | 2.2592 | 196 | 250 | 0.294574 | 0.981 |
| Douglas-fir | -2.2304 | 2.4435 | 165 | 210 | 0.218712 | 0.992 | |
| True fir/hemlock | -2.5384 | 2.4814 | 395 | 230 | 0.182329 | 0.992 | |
| Pine | -2.5356 | 2.4349 | 331 | 180 | 0.253781 | 0.987 | |
| Spruce | -2.0773 | 2.3323 | 212 | 250 | 0.250424 | 0.988 | |
| Woodlande | Juniper/oak/ mesquite | -0.7152 | 1.7029 | 61 | 78 | 0.384331 | 0.938 |
a From Jenkins et al., (2003); b Number of data points generated from published equations (generally at intervals of 5 cm d.b.h.) for parameter estimation; c Maximum d.b.h. of trees measured in published equations, beyond it the equation is unfeasible; d Root mean squared error or estimate of the standard deviation of the regression error term in natural log units; e Includes both hardwood and softwood species from dryland forests
Paramenters in table 4 for equation (1), adjusted by back-transformation biass with equation (2).
bm = Exp(β 0 + β 1 ln dbh) …………………………………… equation (1)
where
bm = where
total aboveground biomass (kg) for trees 2.5 cm and larger in dbh
dbh = diameter at breast height (cm)
Exp = exponential function
ln = natural log base "e" (2.718282) ………………equation (2)
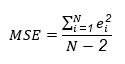
Where where e2 = regression residual from the ith data pair; MSE= the mean square of the error from the regression; N = the total number of pairs.
In the equation 2 if the natural logarithm were used then the base would become e, not 10 (Newman, 1993).
Table 5. Parameters and equations for estimating component ratios of total aboveground biomass for all hardwood and softwood species in the United States.
| Biomass component | Parameter | Data pointsa | R2 | |
|---|---|---|---|---|
| β0 | β1 | |||
| Hardwood | ||||
| Foliage | -40.813 | 58.816 | 632 | 0.256 |
| Coarseroots | -16.911 | 0.8160 | 121 | 0.029 |
| Stembark | -20.129 | -16.805 | 63 | 0.017 |
| Stemwood | -0.3065 | -54.240 | 264 | 0.247 |
| Foliage | ||||
| Foliage | -29.584 | 44.766 | 777 | 0.133 |
| Coarseroots | -15.619 | 0.6614 | 137 | 0.018 |
| Stembark | -20.980 | -11.432 | 799 | 0.006 |
| Stemwood | -0.3737 | -18.055 | 781 | 0.155 |
Source: Jenkins et al. (2003).
Paramenters in table 5 for equation (3), adjusted by back-transformation biass with equation (2).
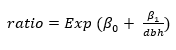 ……………………………………… equation (3)
Where
ratio= ratio of component to total aboveground biomass for trees 2.5 cm and larger in dbh; dbh = diameter at breast height (cm); Exp = exponential; ln = log base e (2.71828).
Sixteen tree species (eight hardwoods and eight conifers) were selected based on their potential for use in windbreaks (Table 6). The average carbon storage potential for these windbreaks growing in nine regions of the United States was then calculated. Because windbreaks are linear landscape features, density is usually expressed in terms of the number of trees per unit length (Kort, 1988). As carbon storage potentials for management activities are generally reported on an area basis, it was converted windbreak length to an area basis by factoring in the width of the windbreak. The width will vary with design (tree species and spacing) and with time as the trees grow.
Table 6. Tree species with potential for windbreaks.
| Tree species | Scientific name | FIA Code |
|---|---|---|
| Balsam fir | Abies balsamea (L.) Mill. | 0012 |
| Eastern red cedar | Juniperus virginiana L. | 0068 |
| Norway spruce | Picea abies (L.) Karsten | 0091 |
| Lodgepole pine | Pinus contorta Dougl. Ex Loud. | 0108 |
| Ponderosa pine | Pinus ponderosa Dougl. Ex Laws. | 0122 |
| Eastern white pine | Pinus strobus L. | 0129 |
| Scotch pine | Pinus sylvestris L. | 0130 |
| Loblolly pine | Pinus taeda L. | 0131 |
| Hackberry | Celtis occidentalis L. | 0462 |
| Green ash | Fraxinus pennsylvanica Marsh. | 0544 |
| Eastern cottonwood | Populus deltoides Bartr. Ex Marsh. | 0742 |
| American elm | Ulmus americana L. | 0972 |
| White oak | Quercus alba L. | 0802 |
| Bur oak | Quercus macrocarpa Michx. | 0823 |
| Northern red oak | Quercus rubra L. | 0833 |
| Southern red oak | Quercus falcata Michx. | 0812 |
Source: FIA (2019)
Windbreak Designs. While each windbreak planting is ultimately the product of the farmer’s decision regarding its design, we selected twelve representative field windbreak designs containing one-, two- or three-rows and nine farmstead windbreaks containing three- to ten-rows and were evaluated. See details in Tables 1, 2 and 3.
The area occupied by a windbreak was calculated according to the tree canopy spread area at age 20 years (Table 1) and the width of the equipment used to maintain the windbreak (20 ft. or 6.0 m). The calculations were made using two approaches. A length-based approach: which was reported in kilometers and miles and defined as the amount of carbon stored per unit length; and area-based approach (Figure 2) which was defined as the sum of the area occupied by the windbreak and reported on a per unit (ha) basis. A single row windbreak may start out with a minimum width between 8 and 10 ft., but may also just as often be as narrow as 4 ft. A multiple row windbreak will have an additional space between rows. Given this information standard designs for one row, two row and three row windbreaks were developed. Windbreak designs were accomplished according to the conservation practice standards for windbreaks /shelterbelts establishment under USDA-NRCS code 380 (USDA-NRCS, 2009).
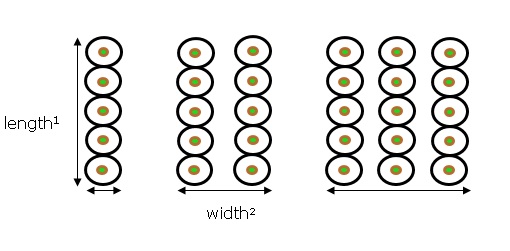
1 Length approach: trees density for length of the windbreak, resulting in C stored by kilometer of windbreak 2 Area approach: tree density per unit of area including the alley, resulting in C stored per area occupied by a windbreak design. For this study, alleys between rows were set at 6.0 meters’ width as cited by USDA-NRCS (2009).
Figure 2. Windbreak length and area approaches for reporting C storage potentials in windbreaks.
For example, a 100 m length windbreak with a 10 m width would occupy a strip of 1,000 m2. Our field windbreak designs were based on having a maximum of 5% of the cropping area occupied which has generally been found to provide a positive net return on the field windbreak investment.
Carbon Storage Potential of Windbreak Designs in Different Regions. The average carbon storage potential for hardwoods and conifers, estimated for different regions for Ballesteros (2015), was used as the baseline values for calculating the C potential of the windbreak designs. Because Juniperus virginiana is classified as small conifer tree (USDA-NRCS, 2009), it was analyzed independently. Likewise, values for carbon storage by shrubs were also analyzed separately and used data from Zhou et al. (2007). They estimated that above-ground woody biomass value of a one-row, 2-m-spacing Russian-olive (Elaeagnus angustifolia L.) tree shelterbelt with different survival rates, at age of 50 years, was between 7.8 and 8.7 metric tons per 100-m length (3.3±0.18 kg C yr-1 tree-1).
RESULTS AND DISCUSSION
Carbon Storage Potential for Different Windbreak Designs. Carbon storage potential for windbreak designs depended on tree spacing and tree species performance. Carbon storage potential for the designed field windbreaks across all studied regions, on a length basis, is given in Table 7. For field windbreaks, mean carbon storage potential (based on 50-years growth) ranged from 0.3±0.11 Mg C km-1 yr-1 for a single-row small-conifer windbreak to 5.8±1.64 Mg C km-1 yr-1 for a mixture of two-rows tall deciduous and one-row tall coniferous.
These values are very close when compared with the findings of Amichev et al. (2016), who report that Annual total ecosystem carbon (TEC) flux in white spruce shelterbelts increased one order of magnitude, from −0.33 to 4.4 Mg C km−1 yr−1, for age 1-25 years, with a peak of 5.5 Mg C km−1 yr−1 (age 39 years). Ins this study, conifers, deciduous and a mixture of both trees, do not have significant differences when compared to white spruce. More studies are needed to determine the carbon storage with other tree species.
Table 7. Total (above- and belowground woody biomass) mean potential carbon stored for field windbreak designs based on windbreak length.
| Field windbreak design | Rows | Carbon storage potential (Mg C km-1 yr-1) in the regions of the United States1 | ||||||||
|---|---|---|---|---|---|---|---|---|---|---|
| NLS2 | CB | SP | DS | AP | RMN | RMS | NE | NP | ||
| One row small coniferous | 1 | 0.7 | 1.6 | 1.5 | 1.5 | 1.1 | 0.8 | 0.8 | 0.3 | 1.2 |
| One row tall deciduous | 1 | 1.0 | 0.6 | 1.0 | 1.0 | 1.6 | 0.5 | - | 0.4 | 0.7 |
| One row tall coniferous | 0.7 | 0.9 | 1.1 | 1.2 | 1.2 | 0.7 | - | 0.4 | 1.1 | |
| Two rows tall deciduous | 2 | 2.0 | 1.3 | 2.1 | 2.0 | 3.1 | 1.0 | - | 0.7 | 1.4 |
| Two rows tall coniferous | 2 | 1.4 | 1.7 | 2.3 | 2.5 | 2.3 | 1.4 | - | 0.6 | 2.2 |
| One row tall coniferous and one row tall deciduous | 2 | 1.7 | 1.5 | 2.2 | 2.2 | 2.7 | 1.2 | - | 0.7 | 1.8 |
| One row tall coniferous and one row small conifer | 2 | 1.4 | 2.4 | 2.6 | 2.7 | 2.3 | 1.5 | 0.8 | 0.7 | 2.3 |
| One row tall deciduous and one row small conifer | 2 | 1.7 | 2.2 | 2.5 | 2.5 | 2.7 | 1.3 | 0.8 | 0.7 | 1.9 |
| Three rows tall coniferous | 3 | 2.1 | 2.6 | 3.4 | 3.7 | 3.5 | 2.1 | - | 1.0 | 3.3 |
| Three row tall deciduous | 3 | 3.0 | 1.9 | 3.1 | 3.0 | 4.7 | 1.5 | - | 1.0 | 2.1 |
| Two rows tall deciduous and one row tall coniferous | 3 | 3.8 | 2.8 | 4.3 | 4.2 | 5.8 | 2.2 | - | 1.4 | 3.2 |
| One row tall deciduous, tall conifers and small conifer | 3 | 2.4 | 3.1 | 3.7 | 3.7 | 3.8 | 2.0 | 0.8 | 1.1 | 3.0 |
1 Tree survival rate of 90 percent was assumed. Replanting will be needed if survival rate decreases in the 2nd or 3rd year.
1 Biomass stored based on the area-based approach. For information about spacing see Table 4.1.
2 1NLS = Northern Lake States, CB = Corn Belt, SP = Southern Plains, DS = Delta States, AP = Appalachia, RMN = Rocky Mountains North, RMS= Rocky Mountains South, NE = North East, NP = Northern Plains
3Tree survival rate of 90 percent was assumed. Replanting will be needed if survival rate decreases in the 2nd or 3rd year.
Carbon storage potential for farmstead windbreaks estimated by the length approach, again based on 50-years growth, ranged from 1.2±0.37 Mg C km-1 yr-1, for a three-row of mixed tree species to 12.7±3.10 Mg C km-1 yr-1 for ten-row of mixed tree species (Table 8). The higher potential is reached in de Delta States because the weather favors tree growing conditions, especially deciduous trees.
These tree structures increase the capacity of windbreaks to store carbon due to farmers set the amount of tree rows necessary for keeping houses comfortable in winter and summer seasons. These could be a good strategy to store carbon, but their effectiveness is limited because the farmstead size.
Table 8. Total (above- and belowground woody biomass) mean carbon stored for farmstead windbreak designs based on length of windbreak.
| Farmstead windbreaks designs | Rows | Carbon storage potential Mg C 300 m-1 yr-1 | ||||||||
|---|---|---|---|---|---|---|---|---|---|---|
| NLS | NP | CB | SP | DS | AP | RMN | RMS | NE | ||
| One row shrubs and two rows tall conifers | 3 | 2.5 | 2.8 | 3.3 | 3.5 | 3.3 | 2.5 | 1.2 | 1.8 | 3.2 |
| One row small conifer and two rows tall conifers | 3 | 1.9 | 3.0 | 3.4 | 3.6 | 3.1 | 2.0 | 0.8 | 0.9 | 3.1 |
| One row small conifer, one rows tall conifers, one row deciduous and shrubs | 4 | 3.4 | 4.0 | 4.5 | 4.6 | 4.7 | 3.0 | 2.0 | 2.2 | 4.0 |
| Two rows tall conifers, two rows tall deciduous and shrubs | 5 | 4.4 | 4.0 | 5.2 | 5.3 | 6.2 | 3.4 | 1.2 | 2.4 | 4.5 |
| Two rows tall conifers, one rows tall deciduous and two rows shrubs | 5 | 4.7 | 4.6 | 5.4 | 5.6 | 5.9 | 4.1 | 2.4 | 3.3 | 5.1 |
| Two rows tall conifers, two rows tall deciduous and two rows shrubs | 6 | 5.6 | 5.2 | 6.4 | 6.5 | 7.4 | 4.6 | 2.4 | 3.6 | 5.7 |
| Two rows tall conifers, one row small conifer, two rows tall deciduous and two rows shrubs | 7 | 6.2 | 6.6 | 7.7 | 7.8 | 8.4 | 5.3 | 3.2 | 4.0 | 6.8 |
| Three rows tall conifers, three rows tall deciduous and two rows shrubs | 8 | 7.2 | 6.6 | 8.4 | 8.5 | 9.8 | 5.7 | 2.4 | 4.3 | 7.4 |
| Three rows tall conifers, five rows tall deciduous and two rows shrubs | 10 | 9.0 | 7.8 | 10.3 | 10.3 | 12.7 | 6.6 | 2.4 | 4.9 | 8.6 |
1Tree survival rate of 90 percent was assumed. Replanting will be needed if survival rate decreases in the 2nd or 3rd year.
Regional carbon storage potentials for the windbreak designs with suitable species are displayed in Tables 8 and Table 9. For field windbreaks the carbon storage of the windbreak, based on 50-years growth, ranged from a low of 0.5 Mg ha-1 yr-1 for a one-row tall conifer in North East region to a high of 7.7 Mg ha-1yr-1 for one-row-small-conifer in the Corn Belt region (Table 9). As seen in Table 6, one row windbreak planting in the different designs had the highest C storage potential because in these designs alley width is not considered (Table 1).
The values for field windbreaks with small conifers are promising for using in croplands to offset the impact of greenhouse gases emissions for farming operations. Taking into account that main crops emit from 0,25 to 1,2 Mg ha-1 by cycle (Ballesteros et al. 2015).
Table 9. Regional carbon storage potential for field windbreak designs in some regions of the United States based on width approach.
| Field windbreak design | Rows | Carbon storage potential (Mg C ha-1 yr-1) in the regions of the United States1 | ||||||||
|---|---|---|---|---|---|---|---|---|---|---|
| NLS2 | CB | SP | DS | AP | RMN | RMS | NE | NP | ||
| One row small coniferous | 1 | 3.53 | 7.7 | 7.4 | 7.3 | 5.5 | 4.2 | 4.2 | 1.9 | 6.1 |
| One row tall deciduous | 1 | 2.9 | 1.9 | 3.0 | 2.8 | 4.5 | 1.4 | - | 1.0 | 2.0 |
| One row tall coniferous | 1 | 2.4 | 2.9 | 3.8 | 4.2 | 3.9 | 2.3 | - | 1.1 | 3.8 |
| Two rows tall deciduous | 2 | 1.74 | 1.1 | 1.7 | 1.6 | 2.6 | 0.8 | - | 0.6 | 1.1 |
| Two rows tall coniferous | 2 | 1.2 | 1.4 | 1.9 | 2.0 | 1.9 | 1.1 | - | 0.5 | 1.8 |
| One row tall coniferous and one row tall deciduous | 2 | 1.4 | 1.2 | 1.8 | 1.8 | 2.2 | 1.0 | - | 0.6 | 1.5 |
| One row tall coniferous and one row small conifer | 2 | 1.8 | 3.3 | 3.4 | 3.4 | 2.8 | 1.9 | 1.4 | 0.9 | 2.9 |
| One row tall deciduous and one row small conifer | 2 | 2.0 | 3.1 | 3.3 | 3.2 | 3.1 | 1.8 | 1.4 | 0.9 | 2.6 |
| Three rows tall coniferous | 3 | 1.2 | 1.4 | 1.9 | 2.0 | 1.9 | 1.1 | - | 0.7 | 1.8 |
| Three row tall deciduous | 3 | 1.7 | 1.1 | 1.7 | 1.6 | 2.6 | 0.8 | - | 0.6 | 1.1 |
| Two rows tall deciduous and one row tall coniferous | 3 | 1.5 | 1.2 | 1.8 | 1.8 | 2.3 | 0.9 | - | 0.6 | 1.4 |
| One row tall deciduous, tall conifers and small conifer | 3 | 1.3 | 1.7 | 2.0 | 2.0 | 2.1 | 1.1 | 0.6 | 0.6 | 1.7 |
1 Biomass stored based on the area-based approach. For information about spacing see Table 4.1.
21NLS = Northern Lake States, CB = Corn Belt, SP = Southern Plains, DS = Delta States, AP = Appalachia, RMN = Rocky Mountains North, RMS= Rocky Mountains South, NE = North East, NP = Northern Plains
3Tree survival rate of 90 percent was assumed. Replanting will be needed if survival rate decreases in the 2nd or 3rd year.
Carbon storage potential for the different farmstead windbreak designs based on width of the shelterbelt ranged from 0.82 for an one-row small conifer and two-rows tall conifers in Rocky Mountain North to 4.23 Mg C ha-1 yr-1 for a 10 ten-row of mixed tree species in the Delta States (Table 10). These potentials are promising considering that in average an adequately insulated house emit around of 6,9 Mg Ceq year-1 (Ballesteros et al., 2015), more than 50% of emissions of houses can be offset by using farmstead windbreaks.
Table 10. Regional carbon storage potential of different farmstead windbreak designs in some regions of the United States based on width approach.
| Farmstead Windbreaks | Rows | Carbon storage potential (Mg C ha-1 yr-1) in the regions of the United States1 | ||||||||
|---|---|---|---|---|---|---|---|---|---|---|
| NLS2 | CB | SP | DS | AP | RMN | RMS | NE | NP | ||
| One row shrubs and two rows tall conifers | 3 | 0.843 | 0.93 | 1.09 | 1.16 | 1.10 | 0.82 | 0.41 | 0.60 | 1.08 |
| One row small conifer and two rows tall conifers | 3 | 0.64 | 0.99 | 1.13 | 1.19 | 1.02 | 0.67 | 0.25 | 0.31 | 1.04 |
| One row small conifer, one rows tall conifers , one row deciduous and shrubs | 4 | 1.14 | 1.33 | 1.51 | 1.52 | 1.56 | 1.01 | 0.66 | 0.72 | 1.32 |
| Two rows tall conifers, two rows tall deciduous and shrubs | 5 | 1.45 | 1.32 | 1.73 | 1.76 | 2.05 | 1.12 | 0.41 | 0.81 | 1.50 |
| Two rows tall conifers, one rows tall deciduous and two rows shrubs | 5 | 1.55 | 1.53 | 1.82 | 1.86 | 1.98 | 1.38 | 0.81 | 1.11 | 1.69 |
| Two rows tall conifers, two rows tall deciduous and two rows shrubs | 6 | 1.86 | 1.73 | 2.13 | 2.16 | 2.46 | 1.53 | 0.81 | 1.22 | 1.91 |
| Two rows tall conifers, one row small conifer, two rows tall deciduous and two rows shrubs | 7 | 2.07 | 2.19 | 2.58 | 2.60 | 2.79 | 1.78 | 1.06 | 1.33 | 2.27 |
| Three rows tall conifers, three rows tall deciduous and two rows shrubs | 8 | 2.38 | 2.19 | 2.80 | 2.84 | 3.28 | 1.88 | 0.81 | 1.42 | 2.45 |
| Three rows tall conifers, five rows tall deciduous and two rows shrubs | 10 | 3.00 | 2.58 | 3.43 | 3.43 | 4.23 | 2.18 | 0.81 | 1.63 | 2.88 |
1 Biomass stored based on the area-based approach. For information about spacing see Table 4.1.
21NLS = Northern Lake States, CB = Corn Belt, SP = Southern Plains, DS = Delta States, AP = Appalachia, RMN = Rocky Mountains North, RMS= Rocky Mountains South, NE = North East, NP = Northern Plains
3Tree survival rate of 90 percent was assumed. Replanting will be needed if survival rate decreases in the 2nd or 3rd year.
The values calculated in this study indicate that typically used field and farmstead windbreak designs have the potential to sequester large amounts of carbon in the woody biomass in various regions of the United States, further supporting its promotion as an added agricultural strategy for increasing C storage capacity. The amount of carbon stored in these systems will be heavily influenced by the design, tree species and ultimate health of the windbreaks over time. Many field and farmstead windbreak designs are possible in the United States agricultural lands. The final practice design for each planting will be a reflection of land availability, economics and farmer goals (Brandle et al., 1988; Tamang et al., 2015).
The carbon storage potential for windbreak designs in different regions varied significantly. The growth performance reported on FIA database for the different tree species affected the final results. Net carbon storage in Rocky Mountains South was underestimated when compared to the reports in the literature. It is known that Ponderosa pine (Pinus ponderosa Dougl. ex-Laws) is a wide-ranging conifer occurring throughout the western United States, southern Canada and northern Mexico (Burns and Honkala, 1990) with the greatest growth range of any commercial timber species in America (Oliver and Russell, 1990). The carbon storage potential calculated in this study was very low under the conditions found in the Rocky Mountains South region (Table 7).
This may have been due to the lack of accurate data in the FIA dataset in that place. Regardless, given the need for windbreaks in regions where P. ponderosa is one of the better species to use, our estimates found windbreak carbon storage potentials to range from an average of 3.58 to 4.2 Mg C ha-1 yr-1 for farmstead and field windbreaks, respectively, in this region.
As reported in prior study (Ballesteros et al., 2015), these outcomes reflect the effects of growth, locations and data set concerns. The carbon potential calculated for hardwood, conifers, small conifers and shrubs in the different designs was considerable. The results from this study demonstrate the importance of species selection and standardized protocols in enhancing our estimates of the amount carbon stored by windbreaks and reducing uncertainty of these estimates (Tables 4 to Table 8).
If researchers report storage estimates together with protocols used and tree ages, these uncertainties can be reduced. For example, Kort and Turnock (1999) reported that hybrid poplar (Populus deltoides x Populus nigra Bartr. Ex. Marsh) sequestered 544 kg C tree-1 during 33 years and green ash (Fraxinus pennsilvanica Marsh) 162 kg C tree-1 during 53 years in above- and belowground. Such information facilitates use and accuracy of interpretation of the reported data in carbon storage estimation exercises.
Properly designed windbreaks with the right tree in the right place undoubtedly can provide considerable carbon storage. An important aspect in the general consideration of field windbreak use is the amount of land taken out from production. According to Brandle et al. (1992), field windbreaks should occupy less than 5% of the agricultural lands to be economically viable based on production differences. Windbreak designs containing three rows stored more carbon than single row planting but exceeded this 5% threshold.
There are tradeoffs between crop productive and carbon storage services which must be considered by the landowner when designing windbreaks. However, as windbreaks have been shown to provide many other economic benefits and social goods (Kulshreshtha and Kort, 2009), such as C sequestration, future markets and other incentives, may shift this 5% threshold. Different windbreak designs are possible to store and reduce carbon emissions from farm operations in the United States. The wise combination of these windbreak designs and the proper selection of tree species in each region are key factors to better exploit their C storage potential, along with the other services they can provide.
CONCLUSIONS
A standardized approach for evaluating C storage in the woody biomass of field and farmstead windbreaks was constructed. This approach allowed us to estimate potentials for this practice looking at such variables as tree species, windbreak design and regional location. Values obtained provide a basis for evaluating the potential C contributions of these systems within farm operations in the United States.
Results from this study indicate that field and farmstead windbreaks can be an effective tool to offset the negative effects of the agricultural systems in the global carbon budget. The structure of a windbreak will depend on the purpose, the expected benefits and the site characteristics, and will in turn determine the carbon storage potential these systems can provide.
The findings from this study will add to the ability of decision makers to evaluate tradeoffs involved when making management decision on agricultural lands in the United States and other regions in the world.

