


 English (pdf)
 Article in xml format
 Article references
 Send this article by e-mail
 Cited by SciELO
  Cited by Google
  Similars in
SciELO
Similars in
SciELO  Similars in Google
 Permalink
INTRODUCTION
Coffee is one of the most important products in the global market, after oil (Hernández, 2009); 10.3 million hectares are cultivated, providing income for more than 25 million families in more than 80 countries (McNougher, 2013; Panhuysen and Pierrot, 2014).
According to the International Coffee Organization (Organización Internacional del Café, 2017), coffee production in Colombia in 2017 was 14.2 million bags, placing Colombia above other coffee producing countries, such as Costa Rica, El Salvador, Guatemala, Honduras, Mexico and Nicaragua, but below Brazil (52 million 60kg bags) and Vietnam (26 million 60kg bags).
Farfán-Valencia and Hincapié-Gómez (2011) observed that, in recent years, the National Federation of Coffee Growers of Colombia has directed its efforts towards creating an environment for the conservation and sustainable use of biodiversity in coffee production in order to contribute to the livelihood of local populations and benefit the global environment. The existing information for viable ways to produce coffees in an environmentally, economically and socially sustainable way is scarce. According to Gómez et al. (2011) and the National Federation of Coffee Growers of Colombia (Federación Nacional de Cafeteros de Colombia, 2017), Colombian coffee still has much to achieve in terms of sustainability and profitability for this crop through greater efforts for processes of productive transformation, innovation, producer business training and development of financial instruments to hedge risks of falling product prices.
The Colombian coffee zone is located in the Andean Tropical region, with a great variety of climates as a result of the interaction between the atmosphere and the relief of the land, where altitude influences the variations in temperature, solar radiation and rainfall (Ramírez et al., 2012). Similarly, these climatic elements influence plant growth and development, presence of phytosanitary problems, production, crop distribution and cup quality (Arcila, 2007a). This crop has good development at altitudes between 1200 and 1800, at temperatures between 17 and 23°C and rainfall close to 2000mm per year that is evenly distributed. However, coffee is grown under conditions marginally higher or lower than optimal values (FNC, 2010).
The Department of Nariño is close to the equator, a factor that explains the presence of coffee crops at heights that reach 2300msnm with low temperatures compared to those in the Colombian coffee zone (FNC, 2010). In addition, there is abundant solar radiation throughout the year, and the relief provides each region with unique climatic characteristics, which are responsible for the specific behavior of the plants (Jaramillo-Robledo, 2005) and the physical and biochemical processes necessary for growth, development and plant production (Ritchie, 1991).
For these reasons, understanding the relationship between climate and coffee plant behavior will allow for adequate planning and orientation of planting times, agronomic work, and harvest and post-harvest tasks (Arcila, 2007b) since these processes are affected by variations in environmental factors seen in this department. Therefore, fluctuations in climatic variables must be analyzed in order to determine the effect of crop altitude on the growth and development of coffee cultivation.
MATERIALS AND METHODS
The study was carried out in four coffee producing municipalities in the Department of Nariño, where coffee is planted at various altitudes with different production systems. In each municipality, experimental lots were selected, located at different altitudes (low, medium and high) (Table 1), with an area of 1ha-1 sown with freshly transplanted Castillo coffee variety, with a planting density of 6800 plants per hectare.
Table 1. Location of the experiment lots in the studied municipalities.
| Municipality | Location | Latitude North | Longitude West | ||
|---|---|---|---|---|---|
| La Unión | Buenos Aires | 1°34' 23'' | 77°07' 38'' | High | |
| El Sauce | 1°34' 23'' | 77°07' 38'' | Half | ||
| La Playa | 1°38' 28'' | 77°09' 00'' | Low | ||
| S. Francisco | 1°22' 20'' | 77°20' 43'' | High | ||
| La Florida | Santa Ana | 1°23' 56'' | 77°18' 53'' | Half | |
| La Joya | 1°22' 06'' | 77°17' 56'' | Low | ||
| La Cruz | 1°12' 27'' | 77°46' 45'' | High | ||
| Sandoná | Mana 1 | 1°10' 25'' | 77°48' 32'' | Half | |
| Las Delicias | 1°13' 36'' | 77°44' 54'' | Low | ||
| San Antonio | 1°12' 50'' | 77°25' 56'' | High | ||
| Consacá | Bomboná | 1°11' 26'' | 77°27' 31'' | Half | |
| Cariaco Bajo | 1°10' 30'' | 77°28' 07'' | Low | ||
The data for each municipality were analyzed based on a model using a RCB design, with treatments corresponding to altitudinal ranges (high:>1800msnm; average: between 1600 and 1800msnm and low: <1600msnm).
The climatic variables, evaluated with Spectrum Technologies meteorological stations located in each experimental lot, were photosynthetically active radiation, ambient temperature, precipitation and relative humidity; the physiological variables included plant height (cm), number of leaves, basal stem diameter at a height above the ground of five centimeters (cm), number of primary branches, number of secondary branches, length of primary branches (cm), number of knots per branch and leaf area index.
The statistical analysis of the data was carried out with Analysis of Variance and Tukey test (<0.05), with the use of Infostat version 2018. In addition, CurveExpert 1.4 was used for the creation of explanatory mathematical models of the most representative variables.
The plants evaluated were free of sunlight, and the evaluations were carried out approximately every sixty (60) days during the first year of establishment of the field crop.
Leaf area (LA) was determined with the mathematical model:
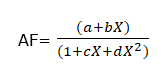
Where: a = 4.541; b = 2.38; c = -0.154; d = 0.0075 and X = average length of six leaves (low, medium, upper). Once the average leaf area per leaf was calculated, it was multiplied by the total leaves per plant to obtain the leaf area of the plants. The LAI was calculated using the formula LAI = LA/SA; where AF = leaf area, AS: soil area. The climatic variables precipitation, temperature, relative humidity and photosynthetically active radiation were obtained from the meteorological stations: Spectrum Technologies, inc. Model: 2900ET Weather Station, located in each experimental lot.
RESULTS AND DISCUSSION
Photosynthetically Active Radiation (PAR). The monthly average PAR in the twelve experimental lots did not have appreciable variations during the evaluation; however, during the month of September 2014, in the lower part of La Unión, a maximum peak of 1489.51 µmol.m-2.s-1 was observed, compared to the trials in the same municipality in the middle and high zones with recorded values of 917.38 and 1000.32 µmol.m-2.s-1, respectively (Figure 1).
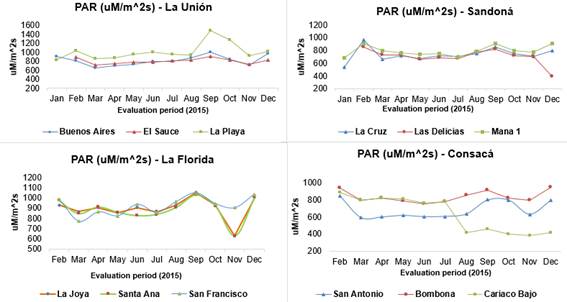
Photosynthetically active radiation is of great importance since the use of this energy translates into plant growth, biomass production and crop yield (Kooman et al., 1996; Liu et al., 2004). According to Bote et al, (2018), factors that regulate coffee growth and productivity are associated with radiation and its interception, such as leaf area, efficient use of radiation and distribution of assimilates; fluctuations in luminosity at different altitudes in the experimental lots must be associated with differences in productivity (Camayo-Velez et al., 2003). The amount of solar radiation and of water available in the soil are two factors that interact, particularly in dry environments; therefore, plant responses to light or shade are greatly affected by water availability (Jaramillo-Robledo, 2005).
Relative humidity (RH). In the four evaluated municipalities, RH values ranged from 50 to 90%; however, in the lower area of La Unión, 32.04% was recorded during the month of September, which could influence the normal development of the fruits (Figure 2).
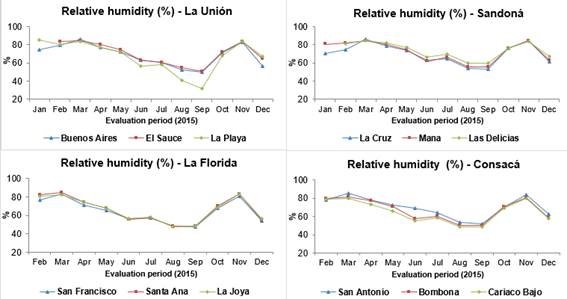
Figure 2. Behavior of the variable relative humidity in the different altitude zones of each of the municipalities.
Temperature. According to the daily temperature records, provided by the stations located in each experimental lot, it was confirmed that, in the four municipalities, this variable was stable, without variations exceeding 5°C between the localities. Similarly, in the experimental lot located in the lower part of La Unión, there were variations higher than those observed in the other regions, presenting an average temperature of 29.05°C during the month of September, above the average of 21.2°C (Figure 3).

According to Pérez and Geissert (2006), very high or low temperatures affect the plant growth processes of coffee; temperatures below 4°C cause chlorosis and death of new tissues, while temperatures above 30°C reduce photosynthesis and floral abortion occurs.
Precipitation. In the different study areas, two well-defined winter seasons were observed, the first between the months of February and the beginning of May and the second between the middle of September until the beginning of December (Figure 4). In the first one, rainfall ranged between 116 and 600mm, with the highest rainfall at the average altitude in the municipality of La Unión and the lowest rainfall in the lower part of the municipality of Consacá. In the second season, the rains ranged between 71 and 537mm, where the highest rainfall occurred in the upper part of the municipality of La Florida and the lowest in the lower part of the municipality of Sandoná.
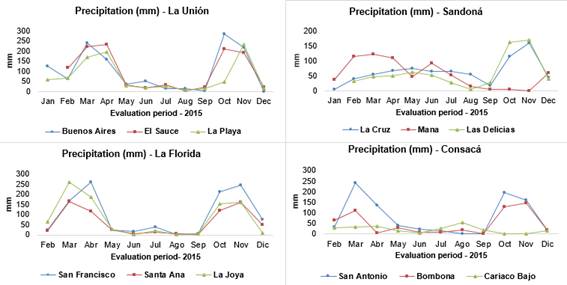
A reduction of rainfall in coffee cultivation translates into a reduction in physiological activity, which can reach values of 75 to 90% because photosynthetic processes are affected by the closure of stomata, affecting growth and production (Laderach et al., 2011; Rivera et al., 2013); however, at floral differentiation, a water deficit is required that guarantees high flowering (Camayo-Velez et al., 2003). According to Ramírez et al. (2012), water demand in coffee cultivation is a function of the age of the crop, soil characteristics and the location above sea level.
Height of coffee plants. The evaluation established highly significant differences between the plants established in the different thermal floors of Sandoná, Consacá and La Florida. In La Unión, the altitude did not affect the height of the plants (Table 2).
Table 2. Mean squares for the variable height of coffee plants at different altitudes in the coffee zone of the Nariño Department.
| FV | GL | Squared means | |||
|---|---|---|---|---|---|
| Sandoná | Consacá | La Florida | La Unión | ||
| Blocks | 15 | 83.22 | 94.01 | 53.76 | 68.92 |
| Treatment | 2 | 826.6** | 356.60* | 1013.70** | 190.53 |
| Error | 30 | 74.54 | 77.64 | 96.17 | 100.56 |
**Highly significant difference (p<0.01)
In the lower area of Sandoná (1536msnm), the plants reached an average height of 76.59cm, with significant differences for the high zone (2015msnm) (62.21cm), while the plants at the middle medium altitude (1700msnm) (69.50cm) showed no differences with the other two locations. In the municipality of Consacá, the highest plant height occurred in the upper area (1989msnm), with 64.31cm and highly significant differences from the middle zone (55.53cm) (Table 3).
Table 3. Comparison of means for plant height in the different locations.
| Altitude | Sandoná | Consacá | La Florida | La Unión |
| Low | 76.59 a | 56.90 ab | 69.45 b | 74.49 a |
| Half | 69.50 ab | 55.53 b | 64.34 b | 78.07 a |
| High | 62.21 b | 64.31 a | 79.95 a | 71.17 a |
* Values with the same letter were not statistically different from each other.
Similarly, in the municipality of La Florida, the highest plant height was reached at 2030msnm, with an average of 79.95cm, with statistical differences from the middle zone (64.34cm) and low zone (69.45cm). In the municipality of La Unión, the highest average of this variable was in the middle zone (78.07cm), without statistical differences with respect to the low zone (74.49cm) and the high zone (71.17cm) (Table 3).
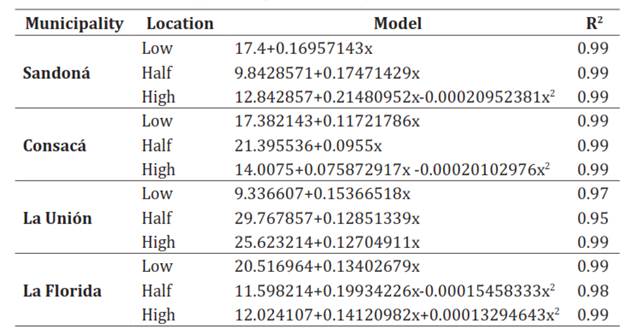
The behavior of the height of coffee plants in the four municipalities during the evaluation period presented linear and quadratic growth models, with R2 ranging between 0.95 and 0.99 (Table 4). A direct relationship between growth and precipitation was evident. The areas with the highest rainfall, lower Sandoná, upper Consacá and La Florida and middle La Unión, had the higher plant heights. According to Arcila (2007b), the rate of development of coffee plants depends on rainfall; Coa et al. (2015) found that coffee has two periods of intense growth, which coincide with the period of flowering.
The altitude in the different experimental lots determined a great variety of climatic conditions that determined, as a whole, the growth of the coffee plants. According to DaMatta et al. (2007) and Blanco et al. (2003), in areas where there is no water deficit in the soil, coffee behavior is closely related to the availability of solar radiation and the PAR used by the plants, which have a considerable impact on growth. Black and Ong (2000) confirmed that PAR is used in the process of photosynthesis and is associated with architecture, population homogeneity and growth speed.
Basal stem diameter in coffee plants. The evaluation of this variable in the coffee plants during the first year established that the basal diameter observed in the coffee plants planted at different altitudes in the municipalities of Sandoná, Consacá and La Unión did not show variability. In La Florida, there were differences between the different altitudes (Table 5). These results coincide with Alfonse et al. (2018) and Arcila (2007b), who stated that the latitude and altitude of a region influence the behavior of the climate, affecting the phenology and speed of plant growth.
Table 5. Mean squares of the variable basal stem diameter (cm) in coffee crops located at three altitudes in coffee municipalities in the Department of Nariño.
| FV | GL | Squared means | |||
|---|---|---|---|---|---|
| Sandoná | Consacá | La Florida | La Unión | ||
| Repetition | 15 | 0.026 | 0.27 | 0.097 | 0.09 |
| Treatment | 2 | 0.011ns | 0.46 ns | 0.74* | 0.10ns |
| Error | 30 | 0.139 | 0.27 | 0.14 | 0.14 |
* Highly significant difference (p<0.05); ns= non significant differences
In La Florida, the greater diameters were in crops located at 1677msnm and 2030msnm, with 2.24cm and 2.18cm, respectively, with statistical differences with respect to the cultivation of the middle zone, with 1.84cm (Table 6).
Table 6. Average comparison for the basal stem diameter in the municipalities of Sandoná, Consacá, La Florida and La Unión.
| Altitude | Sandoná | Consacá | La Florida | La Unión |
| Low | 2.08 a | 1.65 a | 2.24 a | 1.82 a |
| Half | 2.12 a | 1.51 a | 1.84 b | 1.98 a |
| High | 2.07 a | 1.85 a | 2.18 a | 1.88 a |
Values with the same letter were not statistically different from each other (Tukey < 0.05)
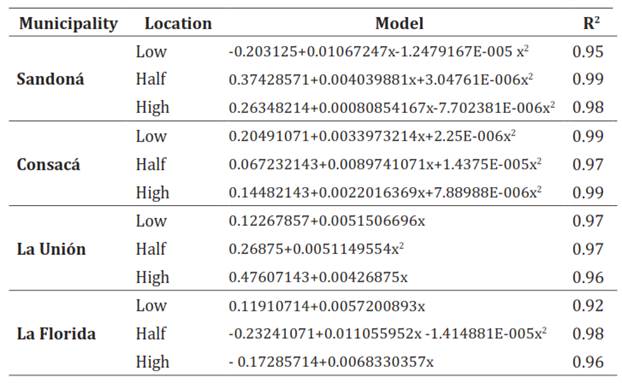
In Sandoná and Consacá, the behavior of the stem diameter variable followed a quadratic model, with an R2 that ranged between 0.95 and 0.99. In the municipalities of La Unión and La Florida, the basal diameter of the plants in the lower and upper zones was adjusted to a linear model, and, in the middle zone, it was adjusted to a quadratic model (Table 7).
Table 7. Models for the basal stem diameter behavior in coffee plants in the different study locations.
According to Razz et al. (1994), stem development is due to a response from the plant that ensures better anchorage in the face of an increase in the weight of the aerial part. On the other hand, temperature could influence normal stem development, as stated by Loreto and Centritto (2008), who suggested that temperature can alter the physiological properties of plants, plant composition, general growth rates, structure and canopy architecture and root depth. However, in this study, the effects of temperature were not clearly detected, possibly because the processes related to growth were influenced by genetic, climatic, edaphic and agronomic factors that occur in each altitudinal range, masking the effects individual.
Number of branches per plant. The Analysis of Variance of the number of branches of the one-year-old coffee plants established highly significant differences between the treatments in the municipality of La Florida, while in the municipalities of Sandoná, La Unión and Consacá, there were no statistical differences between the treatments (Table 8).
Table 8. Mean squares of the variable number of branches in the coffee crops located at different altitude ranges in four coffee municipalities in the Department of Nariño.
| FV | GL | Squared means | ||||
|---|---|---|---|---|---|---|
| Sandoná | Consacá | La Florida | La Unión | |||
| Repetition | 15 | 22.68 | 41.92 | 11.82 | 8.93 | |
| Treatment | 2 | 43.27 ns | 139.14 ns | 199.31** | 1.89ns | |
| Error | 30 | 30.35 | 59.41 | 14.06 | 16.20 | |
** Highly significant difference (p<0.05); ns= non significant differences
In La Florida, the plants in the upper zone reached the highest number of branches (31.56), with statistical differences from the lower zone (25.75 branches) and the middle zone (25.18 branches). Variations in the number of branches per plant may have been influenced by the high rainfall observed in the first semester at the high and low altitudes. According to Camayo-Velez et al. (2003) and Arcila (2007a), high water availability can induce the formation of a greater number of secondary and tertiary branches. In the municipality of La Unión, the cultivation in the middle zone had the highest average of branches per plant with 22.37, without statistical differences from the low zone plants (22.31 branches) and the high zone plants (21.75 branches) (Table 9).
Table 9. Comparison of means for number of branches per coffee plant in the municipalities of Sandoná, Consacá, La Florida and La Unión.
| Altitude | Sandoná | Consacá | La Florida | La Unión |
| Low | 27.87 a | 18.87 a | 25.75 b | 22.31 a |
| Half | 25.06 a | 23.75 a | 25.18 b | 22.37 a |
| High | 24.81 a | 24.18 a | 31.56 a | 21.75 a |
Values with the same letter were not statistically different from each other (Tukey < 0.05).
Studies in Colombia show that, in the central coffee zone, there is greater growth of the stem and branches between the months of March and April and September and October. Also, it is important to note that, in these regions, where there are accentuated dry periods, the behavior of coffee plants is mainly conditioned by variations in rainfall or soil moisture, while in regions where water deficiencies do not occur in the soil, coffee behavior is closely related to the availability of solar radiation (Arcila, 2007b; Villers et al., 2009).
Leaf area index (LAI). The LAI was calculated based on the LA and the planting distance of the coffee plants, grown at different altitudes in coffee-producing municipalities of Nariño, with statistical differences only in La Florida (Table 10), where the plants in the upper area presented an LAI of 15.28 with statistical differences from the low zone (7.16) and middle zone (7.03). This can be explained by the greater rainfall and seasonal availability of irrigation water in the upper La Florida area. These data coincide with those reported by Rezende et al., (2013), who observed LAI values between 7.97 and 8.41, with a density of 5000 plants.ha-1; the lowest value corresponded to plots without irrigation.
Table 10. Analysis of Variance of the variable leaf area index in coffee crops located in different altitude ranges in four coffee municipalities in the Department of Nariño.
| FV | GL | Squared means | ||||
|---|---|---|---|---|---|---|
| Sandoná | Consacá | La Florida | La Unión | |||
| Repetition | 15 | 5,71 | 2,40 | 10,22 | 3,72 | |
| Treatment | 2 | 13,28 ns | 15,38 ns | 357,34** | 3,80ns | |
| Error | 30 | 8,93 | 5,64 | 14,70 | 5,42 | |
** Highly significant difference (p<0.05); ns= non significant differences
The LAI is an important variable for modeling water and energy exchange mechanisms that aid in understanding crop-environment interactions (Gomes et al., 2000). According to Da Matta et al. (2003), reductions in the LAI are largely related to deficiencies in nutrition, cellular damage and reduction of the leaf area.
The canopy structure plays a fundamental role in the processes of exchange of matter and energy between the plant and the atmosphere, so its condition constitutes a priority and fundamental objective in studies on plant growth. Gordon et al. (1994) stated that both the leaf area index and the angular distribution of the leaves are indicators that are widely used to represent the vegetative architecture of the aerial part.
The upper areas of La Florida and Consacá were characterized by their greater rainfall and greater height of coffee plants. The height of the plants in La Unión and Sandoná was not significantly affected by altitude.
In La Florida, the number of branches and the LAI were higher in the upper zone plants, while the diameter of the stems was higher in the middle zone. In the other locations, these variables were not affected by altitude.

