


 Inglés (pdf)
 Articulo en XML
 Referencias del artículo
 Enviar articulo por email
 Citado por SciELO
  Citado por Google
  Similares en
SciELO
Similares en
SciELO  Similares en Google
 Permalink
INTRODUCTION
Potato (Solanum tuberosum) belongs to the Solanaceae family, originated and domesticated for the first time in the Andes mountains of South America, presenting more than 4,000 varieties of native potatoes, In terms of human consumption it is the fourth most important food crop in the world after rice, corn and wheat (International Potato Center, 2015). According to the CIP in 2015, approximately 1.4 billion people consume potatoes regularly and the total world production of the crop exceeds 300 million metric tons.
In Colombia, the potato crop (Solanum tuberosum L.) generates a large number of rural jobs, by 2017 according to the potato value chain; 264 thousand jobs were generated, of which 75 thousand were direct and about 189 thousand indirect. Nationally about one hundred thousand families are engaged in potato production distributed in 10 departments, although 90% of the planted area is concentrated in the departments of Cundinamarca (37%), Boyacá (27%), Nariño (20%) and Antioquia (6%) (Sistema de Información de Gestión y Desempeño de Organizaciones de Cadenas, 2019). In the country a wide availability of potato varieties stands out, being the main Pastusa Suprema, Parda Pastusa, Criolla Colombia, Tuquerreña, Sabanera, Única, Rubí and Diacol Capiro which is the most used in the industry (Gómez, 2015).
National production has a 0.5% share worldwide; however it stands out from other countries because it has a growth rate of 1.35% (Fondo Nacional de Fomento de la Papa, 2016). In Colombia, the potato area in 2017 was 128,622 ha, representing a production of 2,701,062 tons and an average yield of 21.0 t.ha-1, with a 3.3% participation in agricultural GDP, while the participation in Nariño in the same period reports an area of 24,906 ha, with a production of 569,163t and a yield of 21.5 t.ha-1 (SIOC, 2019), in addition, the crop has a great socio-economic importance, because it is one of the fundamental pillars of the departmental economy and from this the income of around 20,000 rural families is derived (Instituto Colombiano Agropecuario, 2018).
In Colombia, the most important disease in potato crops is late blight caused by Phytophthora infestans Mont. De Bary belonging to the Phylum Oomycota (Carreño et al., 2007), which is a hemibiotrophic organism as stated by Nicks and Linhout (2004). It should be mentioned that late blight is a polycyclic disease, that is, it has several cycles of infection and inoculum production during the same season of the crop (Forbes et al., 2014), the main symptoms are brown spots on the leaflets that start from the edges and expand progressively. On the underside, a whitish mycelium is formed that also contains the asexual reproduction structures of the pathogen (sporangia and sporangiophores) (Bustamante, 2015). This disease can present high percentages of incidence and severity in crop areas, becoming epidemic (Silva et al., 2009), and can destroy a crop between 10 to 15 days when control is not appropriate (Bustamante, 2015). In order to maintain the disease level damage below the acceptable economic limit, integrated management must be carried out using cultural, biological, genetic and chemical controls (Programa Regional de Investigación e Innovación por Cadenas de Valor Agrícola, 2017).
For this reason, it is important to make controlled applications of nutrients, especially Nitrogen since it can generate an excess in the foliage when is applied in large quantities, which favors the progress of the disease (PRIICA, 2017), as Juárez et al. (2001) when conducting studies with different genotypes and nitrogen doses, where 33% ammonium nitrate was used as a nitrogen source: 0.160 and 320 kg.ha-1 and two moderately resistant genotypes, concluding that the nitrogen increase in folioles it is the most important factor in the development of P. infestans and directly affects the resistance components of the plant.
Chemical control is the most used, since it involves the utilization of systemic or contact products capable of preventing infection or performing some type of control after the symptoms onset, in the market there are several chemical groups such as acylalanines, carbamates, dithiocarbamates, acetamides, ptalamides and organophosphates, among others that are used for the management of P. infestans (Pérez and Forbes, 2008). The repeated use of these molecules can lead to pathogen resistance and at the same time increase production costs. According to FEDEPAPA (2017), in Nariño agricultural supplies correspond to 19% of production costs, highlighting insecticides and fungicides, after fertilizers, amendments and seeds.
Genetic control is also recommended and consists in using the ability of some varieties or plant species to counteract the disease development due to its intrinsic characteristics (Pérez and Forbes, 2008). Therefore, obtaining resistant crops to late blight has been accepted as one of the main strategies to combat the attack of this disease (Juyó et al., 2011) many authors have worked on this subject but Ñustez (2010) has managed to release improved genotypes such as the Pastusa suprema among other released varieties such as Betina and Roja Nariño, a result that was the product of a participatory research process. Consequently, it is considered that resistant, tolerant or susceptible genotypes or intermediate categories can be recognized in plants (Nicks and Linhout, 2004).
On the other hand, the pathogen genetic variability makes vertical resistance not lasting, forcing the use of new products or finding new sources of resistance (Carreño et al., 2007).
With respect to the Solanum genus, the petota section (species that produce tubers) (Spooner and Castillo, 1997) had its center of origin in the Andean zone of South America (Porras, 1999; Rodríguez, 2010), and unlike other crops, the potato presents an extremely large secondary genetic pool, composed by nearby wild species that form small edible tubers (Van den Berg and Jacobs, 2007; Rodríguez, 2010). In the case of Colombia, the two mainly planted species S. tuberosum Phureja group known as “criollas” and S. tuberosum Andigena group known as “guatas” are the source of this germplasm with utility for genetic improvement.
For the above and as a contribution to the disease management knowledge, in this research the behavior of different potato genotypes was evaluated, regarding the P. infestans reaction to explore the presence of resistance sources or disease tolerance.
MATERIALS AND METHODS
Location. This research was carried out at the "Guadalupe" farm, in the village of Catambuco, Pasto, Nariño, Colombia, located 9 km from the city of Pasto, with geographical coordinates 1 ° 09'38.6 "N and 77 ° 16'57.9" Or a an altitude of 2,796msnm (Plan de Ordenamiento Territorial - POT, 2015), with an average temperature of 13ºC and an annual rainfall of 967mm according to the data obtained from the meteorological station of the Botanical Experimental Farm of the University de Nariño.
Plant material. Genotypes evaluated correspond to the work collection belonging to the Plant Health Research group of the University of Nariño, composed of thirty genotypes collected in different producing areas of the Nariño department. The treatments correspond to the genotypes regionally named by the producers, such as: Aguacata, Andina, Borreguera, Botella roja, Cachona, Cachuda, Calabera negra, Chaucha, Chaucha manzana, Chaucha paisa, Criolla, Criolla Colombia, Criolla galeras, Criolla latina, Curiquinga, Guaneña, Huevo de indio, Malvaseña, Mambera, Ñoña, Punte, Ratona, Ratona amarilla, Ratona negra, Ratona morada, Ratona roja, Tornilla negra, Tornilla roja, Uvilla and Yana shungo.
Area and experimental design. The experimental area corresponded to 1,020m2, where three blocks of 5 x 60m were distributed with a separation of one meter between each block.
The experimental design corresponded to Random Complete Blocks with three repetitions, where 30 genotypes were established in experimental units five meters long and two meters wide. The experimental unit corresponded to five rows separated by one meter and with a distance between plants of 0.40 meters. The genotypes were evaluated in field conditions during two production cycles (First cycle: October and January 2017 and Second cycle: March to June 2018) under the influence of the effect of the natural inoculum present in the area, for a total of 2700 plants per experimental unit.
In each test, a land plot equal to the one described above, was used as a reference with chemical control, only for the evaluation of the performance variable.
Response variables
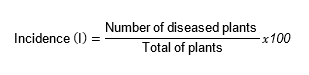
Incidence. It was calculated as the reference between the number of diseased plants and the total of plants expressed as percentage of the useful land plot of each experimental unit, according to the formula:
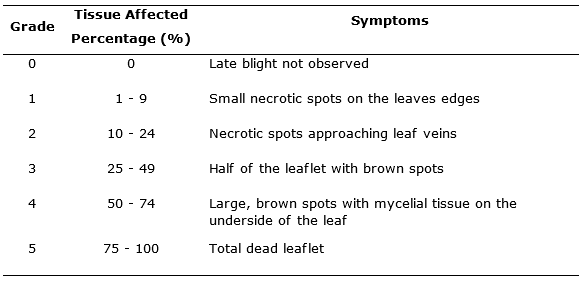
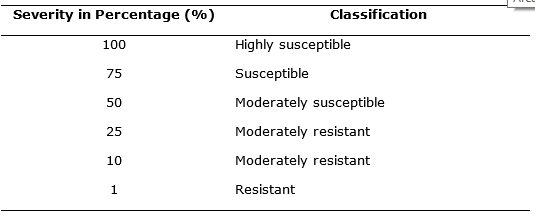
Severity. It was evaluated using the modified graphic scale proposed by Clive (1971) (Figure 1), this scale includes the values: 1, 10, 25, 50, 75 and 100%. The readings were made from the symptoms appearance in plants, with an interval of three to four days. For this, three compound leaves were selected in the three central grooves of each experimental unit, one in the lower third, one in the middle third and one in the upper third, visually evaluating and considering the description presented (Table 1).
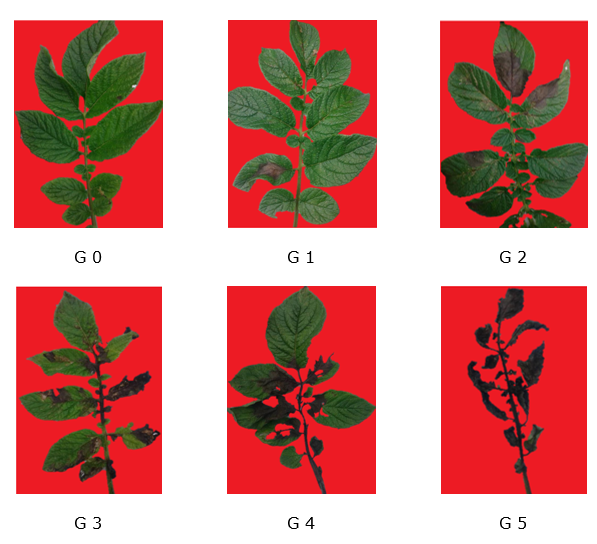
Figure 1. Graphic scale for severity evaluation of late blight in potatoes (Phytophthora infestans) according to Clive (1971).
Disease development rate. It was calculated applying the equation proposed by Van der Plank (1963) for each genotype.
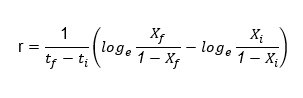
r: Development rate. tf: Final time. ti: Initial time. Loge: Natural logarithm. Xf: Proportion of the disease in the final time. Xi: Proportion of the disease in the initial time.
Area under the disease progress curve (AUDPC). It was calculated from the percentages of the diseased leaf area recorded at different times during the epidemic in both cycles, using the formula proposed by Campbell and Madden (1990) and (Forbes et al., 2014).
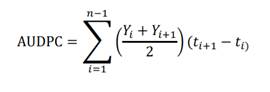
t: Time of each reading. Y: affected foliage percentage in each reading. n: Number of readings.
Performance. The production of the useful land plot corresponding to the three central rows of each experimental unit was evaluated and the calculation per hectare was performed. In the same way, the yield value corresponding to the land plot with chemical control was obtained.
Statistical analysis. For the severity variable, genotypes were categorized based on the scale Clive (1971), classifying them from resistant to highly susceptible (Table 2).
For the variables of development rate, AUDPC and performance, they underwent an Analysis of Variance under the design model of Randomized Complete Blocks (BCA). For comparison of means differences between genotypes, the Duncan comparison test was used. The values of the variable expressed as a percentage were transformed with the formula

RESULTS AND DISCUSSION
Incidence. Most of the genotypes evaluated belonging to S. tuberosum Phureja and Andigena groups during the first cycle had a 100% of incidence, with the exception of Yana Shungo, which showed a 89% of incidence, while in the second cycle the disease was presented in The totality of the genotypes evaluated reaching 100% of incidence, reason why it demonstrates that genotypes do not show vertical resistance to P. infestans.
According to the proposed by Pérez and Forbes (2008), most of the known genes that provide the characteristic of vertical type resistance to late blight come mainly from S. demissum, as well as some genotypes that share inheritance from wild species S. berthaultii and S. commersonii, reported by Schilde-Rentschler (2003), which have low levels of damage from late blight, This suggests that the disease resistance influences the effect of major genes, and whose expression depends on the virulence variation in P. infestans population, present in the corresponding locality (Barquero et al., 2005).
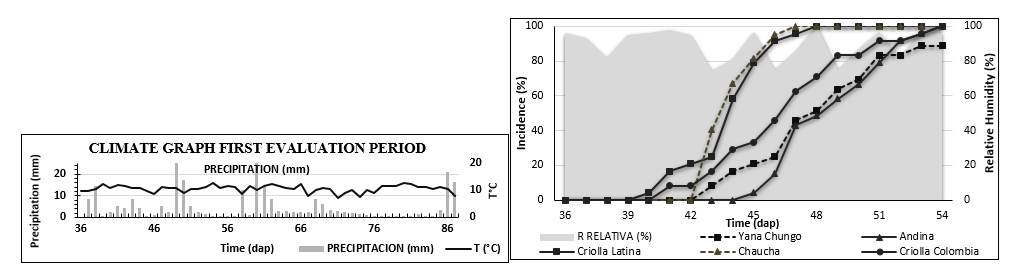
The disease symptoms appearance were similar in the two evaluation cycles, it began after continuous rainfall and relative humidity greater than 70%, where the disease progress is faster and in all genotypes synchronizes this epidemiological phenomenon (Figures 2 and Figure 3). The observed results in this study against the onset of the disease were consistent with the data presented by Vaillant and Gómez (2008), who state that after the environmental conditions that favor the incidence of late blight are presented, the disease appears in crops with more than thirty days of age in such a way that if there is no timely control it reaches 100% of the crop.
*dap: Days after planting.
Figure 2. Incidence curve of the most representative genotypes during the first cycle, including temperature precipitation temperature.
*dap: Days after planting. H. RELATIVE (%)
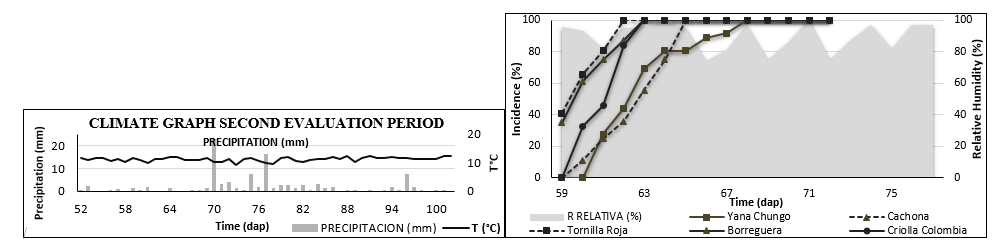
Figure 3. Incidence curve of the most representative genotypes during the second cycle, including temperature precipitation temperature.
The incidence in the most representative genotypes such as Yana Shungo and Andina, show fewer symptoms development unlike the Criolla latina, Chaucha and Criolla Colombia genotypes during the first cycle (Figure 2). In the second cycle, Yana Shungo and Cachona stand out again for having a low incidence, while Borreguera and Tornilla roja have a rapid disease symptoms development (Figure 3). In both cycles, the Criolla Colombia genotype is one of the most cultivated genotypes, and being susceptible, it indicates that its incidence reaches 100% and the incidence curve is in an intermediate range with respect to the total genotypes.
The incidence curve that expresses the disease presence for the two evaluation cycles (Figure 2 and Figure 3), shows that all genotypes are susceptible, possibly due to the different existing races of the pathogen found, as they have expressed in other studies Pérez and Forbes (2017) or the lack of R genes in the host or compatibility between the host and the host.
S. phureja susceptibility is due to the fact that its reaction against the pathogen is based on minor genes (Landeo, 1997; Rubio et al., 2016), there are genotypes that have lower resistance genes, which indicates that there are an effect on the change of incidence rate among the genotypes evaluated. In addition, it has been proposed that horizontal resistance can be an expression of several genes, including R gene alleles, that manifest an additional effect on the activation of defense mechanisms (Ghislain et al., 2018; Gebhardt and Valkonen 2001; Rubio et al., 2016).
Severity. From the disease visual characterization based on James Clive graphic scale, the different genotypes could be classified with respect to their biological reaction against the pathogen, indicating that the majority of genotypes showed a percentage of affection greater than 56%, being classified as: moderately susceptible to highly susceptible (Table 3). However, during the first cycle, genotypes such as Andina stand out, which have a moderately susceptible reaction, and genotypes such as Cachuda, Aguacata, Borreguera and Ratona Roja categorized as susceptible, reached affection levels between 76 and 83%.
Table 3. Reaction classification of the Solanum tuberosum group Phureja and Andigena genotypes against P. infestans with regard to Severity, from 39 to 54 dap, during the first cycle and between 59 to 67dap, during the second cycle.
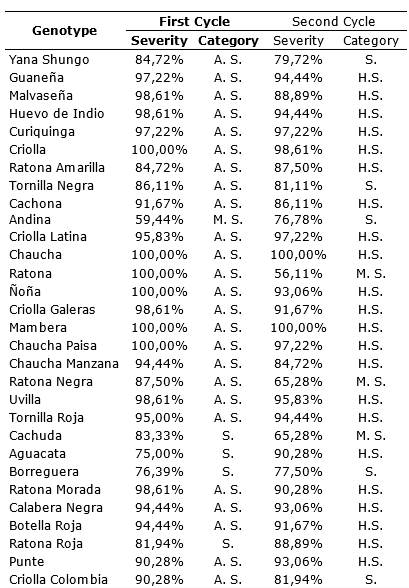
H.S: Highly susceptible; S: susceptible; M.S: Moderately susceptible.
During the second cycle, among the genotypes that have a lower susceptibility reaction and are classified as moderately susceptible, they predominate: Ratona, Ratona Negra and Cachuda, with percentages between 56 and 65%; and susceptible genotypes such as: Yana Shungo, Tornilla Negra, Andina, Borreguera and Criolla Colombia, whose levels do not exceed 81%, this information can be seen in Table 3.
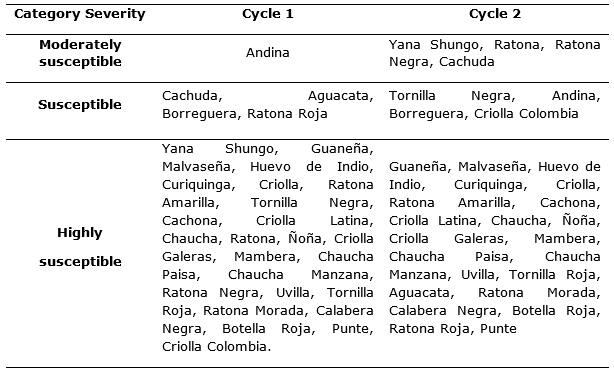
The graphic severity scale allowed genotypes to be categorized according to their biological reaction to the pathogen, presenting highly susceptible, moderately susceptible and susceptible materials, specified in Table 4.
Considering that the genotypes evaluated showed a similar behavior in the two crop cycles, the severity curves for genotypes with high and low susceptibility were plotted, highlighting during the first cycle: Chaucha Paisa and Criolla, whose severity degree is higher than the rest and Andina and Borreguera with values of 60 and 80% respectively, as shown in Figure 4.
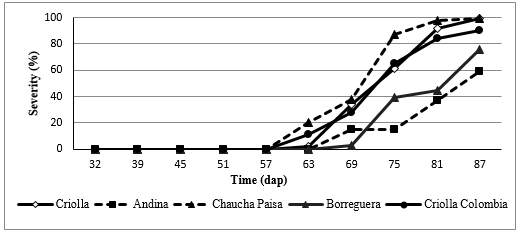
*dap: Days after planting.
Figure 4. Severity curve of a commercial genotype, with the most representative genotypes of the First Cycle.
The two most affected genotypes during the second cycle are: Mambera and Chaucha with a 100% of severity, while the less affected genotypes are Ratona and Cachuda with 56 and 65% of severity respectively (Figure 5).
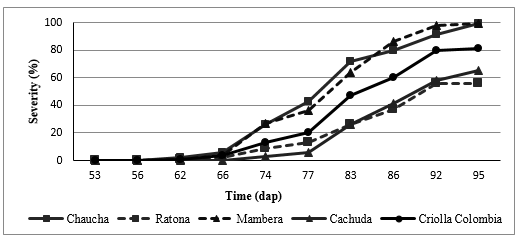
*dap: Days after planting.
Figure 5. Severity curve of a commercial genotype, with the most representative genotypes of the Second Cycle.
The ideal conditions for the disease development range from temperatures between 15 and 22ºC and relative humidity greater than 80% (Cardona-Piedrahita et al., 2016) (Agrios, 2005), which largely coincides with the conditions presented in the two evaluated crop cycles, considering that the disease began to manifest at 56dap, where there was a minimum temperature of 11°C that was ideal for germination of the sporangia, and a maximum temperature of 20°C, in addition a relative humidity of 74 to 89% during the two crop cycles, and similarly in the second cycle with a humidity in a range of 96 - 98%, minimum and maximum temperatures of 8 and 18°C respectively, these being the higher during this crop cycle and manifested 70 days after planting, in this cycle the conditions favored the disease development in the field.
Additionally, the Ratona genotype during the first cycle was a highly susceptible genotype, reaching 100% of severity values, while during the second cycle it showed the lowest severity value, so is classified as moderately susceptible genotype (Table 4), having said that during the second evaluation cycle, the development conditions of the disease were not ideal to this patosystem, according to Rivera (2007), if for some reason one of the three elements of the triangle of the disease does not match precisely with others, will not develop.
The Universidad Nacional de Colombia from 2005 to 2007, released the genotypes Gueaneña, Galeras and Criolla Latina, which present a moderate resistance to late blight (Grupo de investigación en papa, 2014), but in this research they showed a highly susceptible behavior, which indicates a resistance rupture observing different severity degrees (Agrios, 2002), something similar happened with Huevo de Indio genotype that despite being resistant to late blight according to the CIP (2015), was a highly susceptible genotype in both crop cycles.
Research conducted by Mosquera et al. (2008), affirm that some improvement programs have focused on obtaining horizontal resistance varieties, controlled by smaller genes actions, which is more stable and durable than vertical resistance. Identifying eleven resistance genes that come from the wild S. demissum species, which induce hypersensitive response (HR) to infection with specific P. infestans races (Malcolmson and Black, 1966; Mosquera et al., 2008) However, despite of these gene existence, there is no significant resistance in the present research, considering that all the genotypes evaluated reached high percentages of severity, ensuring the genes absence that confer resistance, new races or more aggressive pathogens.
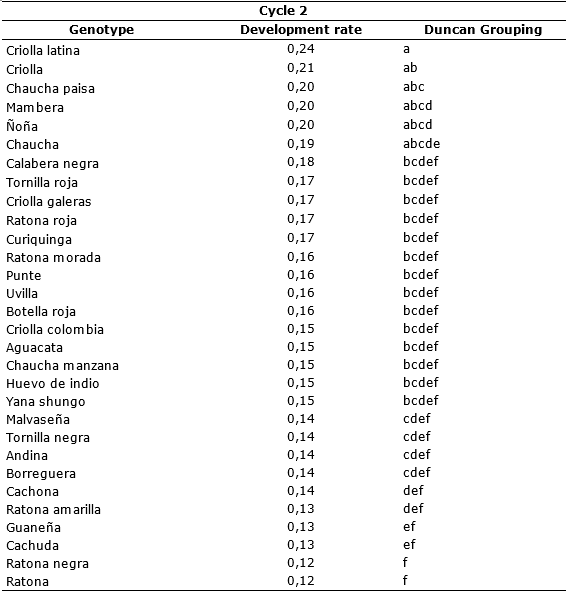
Development Rate (r). Analysis of Variance shows that the disease development rate was statistically significant (p≤ 0.005) among the materials evaluated, having a Pr> F value of < 0.0001 and 0.0044 for the first and second cycle.
Comparison of means according to Duncan Table 5 and Table 6, for first and second cycle, there is a range of susceptibility levels. Largely of genotypes showed high levels of susceptibility, however, the Andina genotype during the first cycle had a growth rate (r) of 0.11 growth units per day, being the lowest of all. The Chaucha paisa genotype is the most susceptible reached a rate r = 0.29 (Table 5).
In the second cycle, genotypes with best behavior were Ratona negra and Ratona with a development rate r = 0.12 and the most susceptible Criolla latina with r = 0.24 growth units per day (Table 6). This demonstrates that the environmental conditions and the genetics of the material evaluated allow the pathogen to show its infection potential and increase all epidemiological values of late blight disease on the host.
Table 5. Comparison of means according Duncan of the disease development rate for genotypes S. tuberosum groups Phureja and Andigena. First cycle.
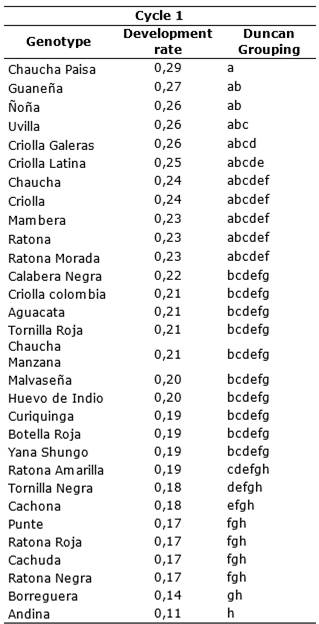
Table 6. Comparison of means according Duncan of the disease development rate for genotypes S. tuberosum groups Phureja and Andigena. Second cycle.
Ghislain et al. (2018) Affirm that the resistance durability of some genotypes depends on the essentiality of the pathogenicity effector for the pathogen, as well as the pathogen's ability to suppress host immunity, population diversity of the pathogen and how many late blight disease resistance genes are at stake.
In S. phureja genotypes there are minor genes for late blight resistance, which confer different degrees of disease reaction. This condition is important, since, as Estrada and Guzmán (1969) state, it is possible to improve a character controlled by minor genes through a planned combination of its components, through inheritance of horizontal resistance to late blight.
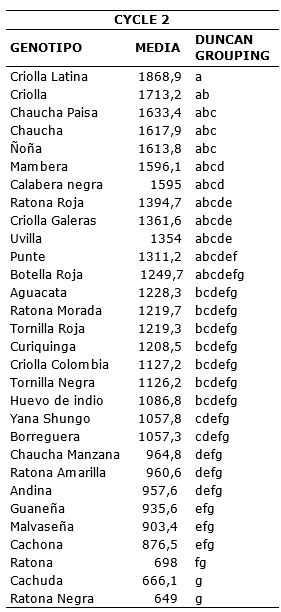
Area under the disease progress curve (AUDPC). The Analysis of Variance showed that the AUDPC was statistically significant (Pr> F ≤ 0.05) among the materials evaluated, having a value of Pr> F of 0.0029 and 0.0002 for the first and second cycle.
In the comparison of means according Duncan during both cycles, it shows a wide range of susceptibility levels that can be evidenced in Tables 7 and 8.
During the first cycle, the comparison of means test shows that the Andina genotype presented the lowest value (647.5) of the amount of accumulated disease found throughout the evaluations. While the genotype with the highest value of AUDPC was Ñoña with a value of 2133.3 being the most susceptible (Table 7).
For second cycle of evaluations the genotypes that obtained less disease accumulation throughout the evaluations were Ratona Negra and Cachuda with 649 and 666.1 they presented a similar reaction according to the comparison of means test performed. On the contrary, the most susceptible genotype was Criolla Latina with 1868.9 (Table 8).
Table 7. Comparison of means according Duncan of the AUDPC for genotypes of S. tuberosum groups Phureja and Andigena. First cycle.
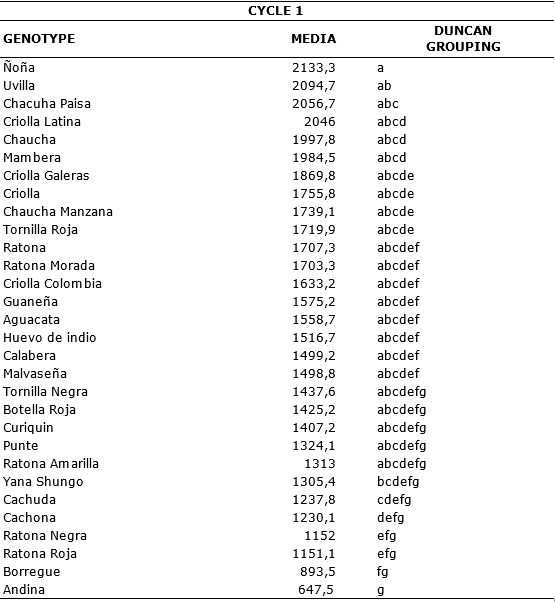
Table 8. Comparison of means according Duncan of the AUDPC for genotypes of S. tuberosum groups Phureja and Andigena. Second cycle.
The disease expression behavior is due to the plant ability to serve as host and its reaction to the pathogen which depends on its genetic constitution and the interaction between the pathogen and plant tissues (Nicks and Lindhout, 2004).
Quantitative resistance, unlike qualitative resistance, is controlled by Quantitative Trait Locus (QTL) or by several genes (Agrios, 2005; Collard et al., 2005) and comprises different reactions that include: penetration rate, restrictions on penetration, restrictions on the rate of invasion of cellular tissue and sporulation rate of the pathogen in the plant. These genes act together for the defense of the plant and the gene performance may be insufficient if it is expressed alone.
Use of R genes against P. infestans has been abandoned by plant breeders in favor of the use of quantitative resistance genes. Quantitative resistance opens the possibility of exploring information on the location of positive and negative genetic factors that affect resistance, useful for assisted selection with molecular markers (Mosquera, 2007).
Performance. Analysis of Variance of Performance in first and second cycle indicate statistical differences between genotypes evaluated presenting a value of Pr>F of < 0.0001 for the first and second.
Using the Duncan comparison of means test (Table 9), the best genotypes were grouped and identified in descending order according to their performance behaviors in uncontrolled disease environments, highlighting genotypes during the first cycle: Chaucha Manzana, Cachuda, Borreguera, Criolla Colombia, Tornilla negra and Cachona that have high yields between 10 and 26.32 t/ha. In the second cycle, Calaverá Negra, Chaucha manzana, Guaneña, Criolla Colombia, Chaucha paisa, Ratona, Criolla Galeras, Ratona Roja, Tornila Roja and Malvaseña stand out for presenting high yields that range between 21 and 28 t/ha.
Table 9. Comparison of means according to Duncan corresponding to diseased plants performance and their respective performance in control treatment.
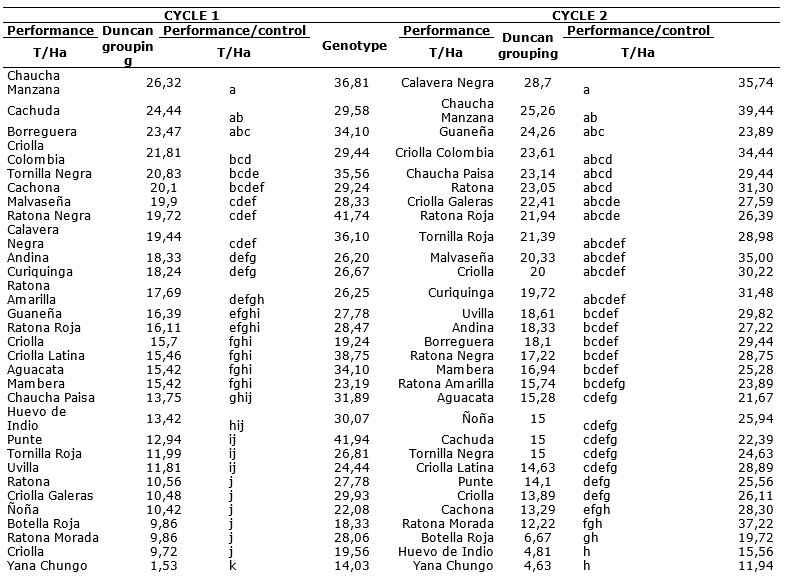
The evaluations carried out in the two crop cycles, affirm that the disease manifested between 50 and 60 dap, shown in the tables of both incidence and severity and at the same time in Table 9, which reflects the existing differences between the control performance and the control, demonstrating that the disease development not only influenced the physiologically active foliage duration but also had an impact on the obtained yield (Waggoner and Berger, 1987; Montes et al., 2011). Since the disease development affects tuberization, one of the most important events in the crop (Sands et al., 1979; Kooman and Haverkort, 1995; Morales et al., 2011), and directly affecting the productive stage which occurs in early varieties at 30 days and in intermediate varieties between 35 and 45 days (Instituto Nicaraguense de Tecnología Agropecuria, 2004).
Results of earlier researches such as Lozoya and Hernández (2001), state that by presenting genotypes with severity greater than 35%, the yield is considerably reduced, which coincides with the results obtained in the present research since affectation levels were presented over 56%.
Consequently, Yepéz (2016), states that the decrease in the leaf area caused by the disease influences the decrease in performance, however, according to the disease epidemiological evaluation and based on performance, tolerant genotypes are evidenced, and despite presenting the disease, they did not have significant decrease in their performance when compared to the control, this phenomenon showed a polygenic resistance in the genotypes where the pathogen developed widely reaching high severity values, but finally the plant reached high yields.
Evidently, the disease development significantly influences performance, and for this reason it is important to continue the research and use new verification methods, such as other researches carried out where they consider that using the AUDPC as a response variable being this a good approximation to determine the type of reaction, which according to Portilla and Salas (2007), is an important source of information to obtain potentially productive and disease tolerant materials.
CONCLUSIONS
The genotypes evaluation of Solanum tuberosum group Phureja and Andigena focused on the reaction against the late blight disease presence (P. infestans), which did not present resistance of vertical type but it is possible to highlight the existence of tolerant materials such as: Criolla, Criolla Colombia, Chaucha Paisa, Andina, Ratona Roja and Guaneña, which, despite having severity and incidence high percentages, showed a better performance.
Through evaluations of the epidemiological variables and performance, tolerant materials that can serve as a genetic alternative to counteract the effect of the pathogen were observed and used as an option for genetic improvement.

