


 English (pdf)
 Article in xml format
 Article references
 Send this article by e-mail
 Cited by SciELO
  Cited by Google
  Similars in
SciELO
Similars in
SciELO  Similars in Google
 Permalink
INTRODUCTION
Surface waters are subject to natural pollution, due to the dragging of particulate and dissolved material in addition to the presence of natural organic matter and of anthropic origins, such as domestic wastewater discharges, agricultural runoff, effluents from industrial processes, among others. The deterioration of wáter supply sources directly affects the level of health risk present and the type of treatment required to reduce it. A very common tool is the wáter quality indexes-WQI, Germany in 1848 already made some attempts to relate the presence of biological organisms with wáter purity. Over the last 130 years, several European countries have developed and applied different systems to classify wáter quality (Torres et al., 2009).
Fuzzy logic is conceived in the 1960s by Iranian electrical engineer Lofty Zadeh, at the University of California, Berkeley, publishing an article entitled “Fuzzy Sets” (Zadeh, 1965). Later this technology, which was born in the USA, was perfected in Europe, and finally applied in the East, mainly in Japan (Rodriguez, 2009). It plays an important role in all fields of our life. The fuzzy expert system presents specialized knowledge and has been effectively applied to problem-solving, classification and modeling in áreas as diverse as science, engineering, business, and medicine (Mishra and Jha, 2014a).
The Amazon-Peru region towns of Leymebamba, Chachapoyas, Pedro Ruiz Gallo, Bagua Grande, Cajaruro, El Milagro, and Bagua, with a total population of over 150,000 inhabitants, are the main urban settlements on the banks of the river, or with direct influence over it (Gamarra et al., 2018b). For this reason, it is necessary to complement the information from studies carried out that allow us to estimate the current degree of wáter pollution in the basin and thus provide proposals for solutions for the well-being of the population and the aquatic ecosystem.
The objective of the research work was to develop and WQI based on fuzzy logic, which would allow the estimation of wáter quality in the Utcubamba River. The proposed index is a computer application, which also allows the use of approximate reasoning considering field information.
MATERIALS AND METHODS
Study area. The Utcubamba River belongs to the Eastern Andeans slopes of northern Peru. It begins at about 3100 meters above sea level in the vicinity of Punta de Arena hill in the province of Chachapoyas and flows into the Marañon River in the province of Bagua, crossing five of the seven provinces that make up the Amazon region. The river basin has an area of 6,650.07Km2 and a length of approximately 250Km of the main channel. Land use in the basin is conditioned by altitude and temperature, so that in the upper basin of the Utcubamba River and its main tributaries, livestock activity is practiced, while in the middle and lower basin the main uses are for agriculture, with coffee crops in the middle section, as well as rice in the lower section (Gamarra et al., 2018b).
Data matrix. The data used to employ and validate the proposed quality index consisted of sixteen sampling points of the Utcubamba River and its tributaries, the same ones that were subtracted from a previous study (Gamarra et al., 2018a). These water samples were collected during the rainy season (October 2014). For the physical-chemical analysis and microbiological, the protocol for monitoring the sanitary quality of surface water resources was followed, established by the General Directorate of Environmental Health of Peru (DIGESA, 2007), while for the analysis of physicochemical variables and microbiological, the same was done with the procedures (APHA, 2005). Figure 1shows the study area and the sampling points on the main course of the Utcubamba River.
Water Quality Indexes. To facilitate the interpretation of physical, chemical, and biological data, more institutions are using water quality and pollution indexes (WQI & ICO), which, through a mathematical expression representing all the variables assessed, make it possible to evaluate the water resource. The development and application of any indicator are specific to each particular region or source. The developed and application of any indicator is specific to each particular region or source (Samboni et al., 2007).
Since 1965, when Horton proposed the first water quality index, a great deal of consideration has been given to the development of index methods, where the variables most commonly used in WQI are dissolved oxygen and hydrogen potential, followed by BOD, nitrates, fecal coliforms, temperature, turbidity and total dissolved solids (Torres et al., 2009). Several types of arithmetic methods have been used, including aggregation of quality monitoring data to produce an overall quality index (Castro et al., 2014).
NSF WQI quality index. The National Sanitation Foundation (NSF) of the United States developed the NSF WQI in 1970 using Rand Corporation´s Delphi survey technique. This index has the characteristic of being a multi-parametric index based on three studies. The first study adopted 35 contamination variables and included the opinión of recognized experts in the field. The second study recognized nine variables identified as the most important, such as temperature (T), dissolved oxygen (DO), biochemical oxygen demand (BDO5), total dissolved solids (TS), turbidity (Tur), phosphates (PO4), nitrates (NO3), hydrogen potential (pH), and fecal coliforms (CF). Finally, the third study developed a series of rating curves for each of the variables identified in the second study (Castro et al., 2014). Each of the nine variables has a specific percentage assigned according to its importance, related to water quality. These are shown in Table 1, which are applied with the variables to generate the weighted mean that constitutes the WQI (Behar et al., 1997). However, the first equation in the index was a weighted geometric average, and currently, a weighted linear sum is used, see equation (1) (Wayne, 1978; Parastar et al., 2015).
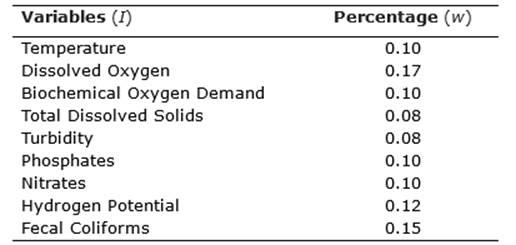
If we denote by I i to the sub-index for the variable ′I′ and by 𝑤 𝑖 their respective weighting, the WQI is expressed by e1:
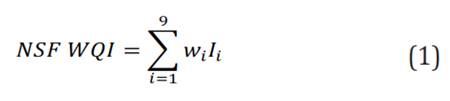
Table 2 shows the water quality classification, using the 𝑁𝑆𝐹 𝑊𝑄𝐼, which expresses it in five categories, which are: Very bad, bad, average, good, and excellent. The WQI calculator of the Water Research Center was used to calculate online this index (Water Research Center, 2018).
Table 2. Water quality classification, according to NSF WQI.
| Water Quality | Numerical Range |
|---|---|
| Very bad | 0 - 25 |
| Bad | 26 - 50 |
| Average | 51 - 70 |
| Good | 71 - 90 |
| Excellent | 91 - 100 |
Methodology for determining the Diffuse Water Quality Index (DWQI). Conventional water quality classification criteria are based either on clear sets with discontinuous limits (e.g. clean versus polluted) or on continuous variables whose values are only meaningful to experts (such as ppm of a toxin). Fuzzy sets allow these approaches to be combined. DWQI is a rule-based fuzzy expert system where fuzzy logic is used as a tool to represent the estimation of water quality base on physical, chemical, and microbiological variables. Using the methodology proposed by Icaga (2007) This index was developed, which consists of six steps:
(Step 1) Determine the classes of the variables using the possible values observed in the field.
(Step 2) Organize the variables so that your classes are five groups.
(Step 3) Use the membership functions to standardize natural quality measurement scales for each variable.
(Step 4) Determine the rules of inference with expert guidance.
(Step 5) Employ a fuzzy algorithm that uses the inference rules and where the variables use the membership functions.
(Step 6) Defuse the ten fuzzy group inferences to obtain an index number between 0 and 100.
DWQI validation. The computational tool used in the modeling process was MATLAB 2017, using the fuzzy logic simulator. To carry out the validation process, the correlation between DWQI values and NSF WQI values was made using the Software R version 3.5.1.
RESULTS Y DISCUSSION
In recent years, several countries have developed different QWIs using fuzzing logic, the same ones that use various variables for this purpose, (Table 3).
Table 3. Physicochemical and microbiological variables used by different WQIs using fuzzy logic.
| Country/Applicatión/Name | Variables | Inference Engine | Reference |
|---|---|---|---|
| Spain Ebro River. FWQ índex | Twenty-six (26): Dissolved Oxygen, Conductivity, Hydrogen Potential, Suspended Solids, Biochemical Oxygen Demand, Total Organic Carbon, Total Coliforms, Fecal Coliforms, Salmonellas, Fecal Streptococci, Phosphates, Nitrates, Sulfates, Chlorides, Fluorides, Ammonia, Atrazine, Benzene- Ethyl Benzene-Xylene, Nickel, Simazine, Trichlorobenzenes, Chromium, Hexa chlorbutadiene, Polycyclic Aromatic Hydrocarbons, Arsenic, Lead and Mercury. | Mandani type fuzzy inference system consisting of ninety-six (96) rules were defined. | Ocampo-Duque et al. (2006) |
| Turkey. LaKe Eber. | Eleven (11): Temperature, Hydrogen Potential, Dissolved Oxygen, Chloride, Sulfate, Ammonia, Nitrite, Nitrate, Total Dissolved Solid, Color, and Sodium. | Mandani type fuzzy inference system consisting of four (04) rules. | Icaga (2007) |
| India. Semenyih River. UNIQ2007. | Six (06): Dissolved Oxygen, Biochemical Oxygen Demand, Chemical Oxygen Demand, Suspended Solids, Hydrogen Potential, Ammonia Nitrogen. | Mandani type fuzzy inference system consisting of eighty-six (86) rules. | Raman et al. (2009) |
| Brazil Iguape River FWQI | Nine (09): Temperature, Hydrogen Potential, Dissolved Oxygen, Biochemical Oxygen Demand, Thermotolerant Coliforms, Dissolved Inorganic Nitrogen, Total Phosphorus, Total Solids, Turbidity | Mandani type fuzzy inference system consisting of three thousand one hundred and twenty-five (3125) decisión rules. | Lermontov et al. (2009) |
| Irán. Karoon River | Six (06): Dissolved Oxygen, Turbidity, Nitrate, Total Coliforms, Hydrogen Potential, and Total Dissolved Solids. | Mandani type fuzzy inference system consisting of fifty-eight (58) rules. | Semiromi et al. (2011) |
| Irán Mamloo dam River. | Twenty (20): Dissolved Oxygen, Biochemical Oxygen Demand, Hydrogen Potential, Temperature, Total Solids, Turbidity, Cryptosporidium, Total Coliforms, Arsenic, Lead, Mercury, barium, Cadmium, Chromium VI, Nitrite, Nitrate, Total Phosphate, Sulfate, Chloride, and Fluoride. | Mandani type fuzzy inference system consisting of 550 rules. | Gharibi et al. (2012) |
| India. Ganga and Yamuna Rivers | Five (05): Turbidity, Dissolved Oxygen, Biochemical Oxygen Demand Hydrogen Potential, and Fecal Coliforms. | Use Zadeh´s rule of compositional inference. Where it finds the relational matrix R. | Srivastava et al. (2013) |
| Colombia. Aburra River. | Dissolved Oxygen Deficiency and Biochemical Oxygen Demand. | MGDACR gray diffuse model of waste load assignment. | Serna (2013) |
| India. FDWQI. | Five (05): Turbidity, Dissolved Oxygen, Biochemical Oxygen Demand, Hydrogen Potential, and Fecal Coliforms. | Mandani type fuzzy inference system consisting of ten (10) rules | Mishra and Jha (2014b) |
| Algeria. Oued El Hai Basin. FWQI | Ten (10): Hydrogen Potential, Total Dissolved Solids, Calcium, Magnesium. Sodium, Potassium, Chloride, Sulfate, Bicarbonate, and Nitrate. | Mandani type fuzzy inference system does not stipulate the number | Tiri et al. (2018) |
Determinatión of DWQI. (Step 1) Each input and output variable has been sorted into five classes, taking the NSF WQI classification as a reference: Very Poor, Poor, Medium, High, and Very High.
(Step 2) The variables were grouped into their classes.
(Step 3) The membership functions used were triangular and trapezoidal. In Table 4, the values determined for each variable and their corresponding fuzzy sets, as well as the respective linguistic terms are given. In Figure 2, the fusion of Dissolved Oxygen can be seen, employing the two membership functions.
Table 4. Fuzzy sets for each variable and linguistic terms for the development of DWQI.
| Variable | Very Poor | Poor | Medium | High | Very High | ||||||||||
|---|---|---|---|---|---|---|---|---|---|---|---|---|---|---|---|
| a=b | c | d | a | b | c | a | b | c | a | b | c | a | b | c=d | |
| DO | 0 | 2 | 4 | 2 | 4 | 6 | 4 | 6 | 8 | 6 | 8 | 10 | 8 | 10 | 12 |
| BOD5 * | 0 | 1 | 2 | 1 | 2 | 3 | 2 | 3 | 4 | 3 | 4 | 5 | 4 | 5 | 6 |
| NO3 * | 25 | 30 | 35 | 20 | 25 | 30 | 15 | 20 | 25 | 10 | 15 | 20 | 0 | 10 | 15 |
| FC * | 2000 | 3500 | 4000 | 877 | 1500 | 3000 | 255 | 897 | 2000 | 10 | 255 | 500 | 0 | 10 | 20 |
| pH** | 0 | 3 | 5 | 3 | 5 | 7 | 5 | 7 | 9 | 7 | 9 | 11 | 9 | 11 | 14 |
| Tur * | 8 | 10 | 90 | 5 | 8 | 10 | 2 | 5 | 8 | 1 | 2 | 3 | 0 | 1 | 2 |
| DWQI | 0 | 10 | 30 | 10 | 30 | 50 | 30 | 50 | 70 | 50 | 70 | 90 | 70 | 90 | 100 |
* Less value of these variables, the better the quality of the water.
** Very Poor = Very High, Poor = High Better quality is obtained when the variable takes values of Medium
(Step 4) Since there are six inputs variables and each variable is broken down into five classes, by combining all of them with different classes there will be 15,625 (56) rules. Defining all these rules will make the system more complex, so the number of rules was reduced. The six input variables were grouped into four groups. Group 1 consisted of Dissolved Oxygen and BOD, because they are chemical variables of water quality. Group 2 was formed only with Nitrate, which is the variable that provides the information of nutrients in the water. On the other hand, Group 3 was formed by the fecal coliforms, which is the microbiological variable that determines the quality of the water. The pH and turbidity were part of group 4 since they are physical-chemical and physical variables, respectively, of water quality. Initially, the rules were defined for group 1 and group 4 separately. With the help of the experts, 10 inference rules were defined (Table 5).
Table 5. Fuzzy inferences rules, required for water quality estimation using DWQI.
| Name | Description of the fuzzy inference rule |
|---|---|
| Rule 1 | If Turbidity is too high or the dissolved oxygen is too low or the BOD is too high or the pH is too low or the fecal coliforms are too high or the Nitrate is too high, Then the water quality is too low. |
| Rule 2 | If turbidity is high or dissolved oxygen is low or BOD is high or pH is low or fecal coliforms are high or the nitrate is high, then the water quality is low. |
| Rule 3 | If turbidity is medium or dissolved oxygen is medium or BOD is medium or pH is medium or fecal coliforms are Medium or nitrate is Medium, then the water quality is medium. |
| Rule 4 | If turbidity is low or dissolved oxygen is high or BOD is low or pH is medium or fecal coliforms are low or the nitrate is low, then the water quality is high. |
| Rule 5 | If turbidity is very low or dissolved oxygen is very high or the BOD is very low or the pH is high or the fecal coliforms are very low or the nitrate is very low, then the water quality is very high. |
| Regla 6 | If Turbidity is high and dissolved oxygen is very low and BOD is very high and pH is very low and fecal coliforms are very high and nitrate is very high, then water quality is very low. |
| Regla 7 | If Turbidity is high and dissolved oxygen is low and BOD is high and pH is low and fecal coliforms are high and nitrate is high, then water quality is low. |
| Regla 8 | If turbidity is medium and dissolved oxygen is medium and BOD is medium and pH is medium and fecal coliforms are medium and nitrate is medium, then water quality is medium. |
| Regla 9 | If turbidity is low and dissolved oxygen is high and BOD is low and pH is medium and fecal coliforms are low and itrate is Lolw, then water quality is high. |
| Regla 10 | If turbidity is very low and dissolved oxygen is very high and BOD is very low and pH is very high and fecal coliforms are very low and nitrate is very low, then water quality is very high. |
(Step 5) In the fuzzy algorithm, the approach used is the Mamdani type, which is implemented in Matlab.
(Step 6) To defuse the proposed inferences, the centroid method representing the center of gravity of the membership function was used.
Evaluation of the Indexes. Tables 6 and 7, respectively, show the results when applying the NSF WQI and ICAD index. For this purpose, sixteen sampling points (MS) have been considered in the Utcubamba River and its tributaries, which were carried out in October 2014.
Table 6. Variables y calculation of the NSF WQI index at sampling stations, 2014.
| EM | T | DO | BOD5 | TS | Tur | PO4 | NO3 | pH | FC | NSF WQI |
|---|---|---|---|---|---|---|---|---|---|---|
| EM1 | 11.2 | 8.62 | 1.35 | 69.72 | 1.06 | 0.16 | 0.08 | 8.21 | 50 | 65 |
| EM2 | 12.2 | 8.12 | 2.97 | 52.01 | 0.77 | 0.1 | 0.6 | 8.12 | 4 | 67 |
| EM3 | 12.3 | 8.03 | 1.49 | 60.97 | 1.37 | 0.03 | 0.1 | 8.3 | 23 | 66 |
| EM4 | 11.8 | 7.57 | 1.13 | 54.6 | 2.39 | 0 | 0.53 | 8.29 | 300 | 62 |
| EM6 | 15.1 | 8.4 | 2.72 | 43.12 | 3.3 | 0.05 | 0.19 | 8.01 | 11 | 65 |
| EM7 | 13.4 | 8.32 | 0.79 | 50.26 | 1.46 | 0 | 0.78 | 8.14 | 500 | 62 |
| EM9 | 14 | 8.18 | 2.75 | 29.4 | 0.94 | 0.01 | 0.24 | 8.14 | 23 | 64 |
| EM15 | 16.9 | 7.89 | 3.89 | 53.83 | 10.04 | 0.12 | 0.43 | 8.48 | 500 | 54 |
| EM16 | 13.8 | 8.39 | 5.73 | 40.11 | 28.37 | 0.08 | 0.49 | 8.27 | 1600 | 51 |
| EM18 | 14.5 | 8.45 | 1.81 | 41.79 | 29.16 | 0 | 1.11 | 8.2 | 900 | 56 |
| EM27 | 20.9 | 8.45 | 2.41 | 49.07 | 2.19 | 0 | 0 | 8.32 | 170 | 58 |
| EM29 | 20.3 | 8.82 | 2.12 | 73.29 | 51.45 | 0.05 | 0.9 | 8.49 | 1600 | 51 |
| EM30 | 19.8 | 8.45 | 1.59 | 33.11 | 21.31 | 0.09 | 0.89 | 8.34 | 900 | 54 |
| EM31 | 20.8 | 8.25 | 5.15 | 68.18 | 49.22 | 0.08 | 1.61 | 8.23 | 1600 | 49 |
| EM37 | 21.4 | 7.9 | 2.66 | 84.21 | 7.87 | 0.02 | 0.5 | 8.51 | 300 | 55 |
| EM42 | 25.6 | 8.27 | 2.95 | 95.97 | 80.99 | 0.18 | 1.96 | 8.16 | 350 | 50 |
Table 7. Variables y calculation of the DQWI index at sixteen sampling stations, 2014.
| EM | T | DO | BOD5 | TS | Tur | PO4 | NO3 |
|---|---|---|---|---|---|---|---|
| EM1 | 1.06 | 8.62 | 1.35 | 8.21 | 50 | 0.08 | 73 |
| EM2 | 0.77 | 8.12 | 2.97 | 8.12 | 4 | 0.6 | 70 |
| EM3 | 1.37 | 8.03 | 1.49 | 8.3 | 23 | 0.1 | 74 |
| EM4 | 2.39 | 7.57 | 1.13 | 8.29 | 300 | 0.53 | 74 |
| EM6 | 3.3 | 8.4 | 2.72 | 8.01 | 11 | 0.19 | 71 |
| EM7 | 1.46 | 8.32 | 0.79 | 8.14 | 500 | 0.78 | 73 |
| EM9 | 0.94 | 8.18 | 2.75 | 8.14 | 23 | 0.24 | 71 |
| EM15 | 10.04 | 7.89 | 3.89 | 8.48 | 500 | 0.43 | 50 |
| EM16 | 28.37 | 8.39 | 5.73 | 8.27 | 1600 | 0.49 | 50 |
| EM18 | 29.16 | 8.45 | 1.81 | 8.2 | 900 | 1.11 | 53 |
| EM27 | 2.19 | 8.45 | 2.41 | 8.32 | 170 | 0 | 73 |
| EM29 | 51.45 | 8.82 | 2.12 | 8.49 | 1600 | 0.9 | 50 |
| EM30 | 21.31 | 8.45 | 1.59 | 8.34 | 900 | 0.89 | 53 |
| EM31 | 49.22 | 8.25 | 5.15 | 8.23 | 1600 | 1.61 | 50 |
| EM37 | 7.87 | 7.9 | 2.66 | 8.51 | 300 | 0.5 | 60 |
| EM42 | 80.99 | 8.27 | 2.95 | 8.16 | 350 | 1.96 | 53 |
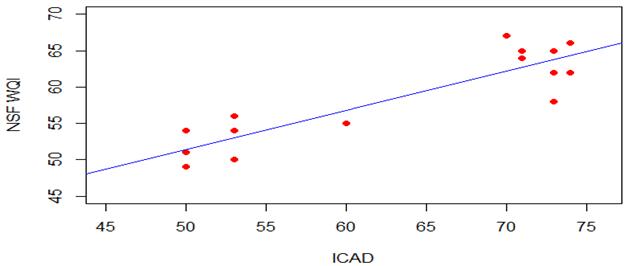
DQWI validation. The correlation between the two índices (Figure 3) was used to validate the proposed model. A value of R2 = 0.81 was obtained. Having a correlation value close to 1, the índices should show very similar values. Therefore, the correlation obtained satisfied the objective of the research, which was to develop a new index that was more rigorous in its ranking performance
Water quality is a multi-parametric attribute, its evaluation depends mainly on information about wáter quality variables at different times and places, this information is processed and culminates in a score scale that could be represented by an index (Terrado et al. 2010). Many WQIs have been formulated, such as the NSF WQI, the Canadian Council of Ministers of the Environment (CCME WQI), the British Columbia WQI (BC WQI), and the Oregon WQI (OW QI). However, due to the number of variables and their averages, it presents failure in its sum of products and that water quality can be considered “good” even if one of the parameters is classified as” “ so bad” (Choupina et al., 2019). Therefore, the need arises to determine an index to determine the water quality of the Utcubamba river in Peru.
Fuzzy logic has been applied a lot in several Middle Eastern countries, so it is not surprising that most of the applications are in Turkey, Israel, etc. However, in Peru there are no indicators base on this area of knowledge, which allow us to facilitate the interpretation of physical, chemical, and biological data obtained in the field, through a mathematical expression base on this type of logic, considering some valued variables, allowing us to evaluate the water resource as a whole
The variables considered for the present quality index were six (06): Nitrate was added because it provides information on water nutrients, to the five proposed by Mishra y Jha (2014b) and that also coincides with the work of Srivastava et al. (2013), where turbidity (Tur), dissolved oxygen (DO), iochemical oxygen demand (BOD5), hydrogen potential (pH) and fecal coliforms were considered. These selected physical-chemical and microbiological variables were employed by various WQIs using fuzzy logic. Of the works described in Table 3, except for Serna (2013) and Srivastava et al. (2013), they use the Mandani type fuzzy inference system that consists of decisión rules, which are given by the “and” or “or” operators. However, in this research the decisión rules have both operators, five use the “or” operator and the remaining use the “and” operator. The rules have been of the conditional type if “antecedent” then “consequent”. We considered the classes very poor, poor, medium, high, and very high of the variables Tur, DO, BOD5, pH, FC, NO3 were part of the antecedent and the variable DWQI the consequent, according to the possible values that can be obtained in field or laboratory. However, it is worth pointing out that the classes of each variable contribute differently to water quality, so that the variables BOD5, NO3, FC, and Tur behave in a such way that when the value of these variables is lower, DQWI is high. The case of pH is particular because there are classes that contribute equally to water quality, Very Poor= Very High, Poor=High and greater DQWI is obtained when the variable takes on values of medium. The DO and DWQI, the higher the value, the better the quality of the water. For example, Rule 2 states that: If turbidity is high or dissolved oxygen is low or BOD is high or pH is low or fecal coliforms are high or nitrate is high, the water quality is low.
DWQI, based on fuzzy logic, produces results statistically similar to the NSF WQI, R2 = 0.81. The advantage of this index is that it considers six relevant variables in contrast to the nine of its similar It seems to produce accurate and reliable results. In this sense, DQWI can be used as a comprehensive tool for the assessment of water quality by interested persons or institutions according to their environment, realities, and purposes, with minor modifications.
Of the sixteen sampling points, using the DWQI, it is concluded that eight are classified as good; the values are in the range of 71 a 90, considering the NSF WQI the water can be used for public supply through a purification treatment, for recreation, for use in fishing and aquatic life is limited for very sensitive fish, for agriculture with a minor purification for crops that require high quality. At eight sampling points, the water is classified as Medium quality because it is in the range of 51 to 70 can be used for public supply with a pre-treatment, for recreation would have to take precautions if ingested given the possibility of the presence of bacteria, for use in fisheries and aquatic life would not be health risks, but the doubtful presence of aquatic species, for agriculture usable in most crops. We will be able to note in Table 7 how the quality of the water descends from Good to Medium in the main water source, due to the different uses that are given to them during their journey, however, in EM 27 and EM37 the quality is Good, because they are tributary water sources of the river.
The inhabitants of the Utcubamba riverbanks are affected by water pollution. They use the water from the river for various purposes, such as crop irrigation, cattle raising, laundry, and recreation (García-Huamán et al., 2011; Chávez et al., 2016).
CONCLUSIONS
This research developed an index to determine water quality for the Utcubamab River called the “Diffuse Water Quality Index” (DWQI). Base on expert opinions and international experiences, six water quality variables, DO, turbidity, pH, Nitrate, and Fecal Coliforms, were considered as indicators of DWQI. The application of the new Index was demonstrated at sixteen sampling points on the Utcubamba River and its tributaries during October 2014 in the Amazon region of Peru, based on observed water quality data.
It is demonstrated that DQWI has a value of the correlation coefficient R2 = 0.81, with the NSF WQI, therefore, it would allow having a high similarity with the expected results in the Utcubamba River and its tributaries.
The new index makes it possible to know the condition of water quality and to investigate spatial and temporal changes in the river. Therefore, fuzzy logic concepts are an effective tool to address these types of problems.

