


 Inglês (pdf)
 Artigo em XML
 Referências do artigo
 Enviar este artigo por email
 Citado por SciELO
  Citado por Google
  Similares em
SciELO
Similares em
SciELO  Similares em Google
 Permalink
INTRODUCTION
Propolis is a resinous, hard and brown compound which is produced by honey bees (Apis mellifera carnica) from the gum, sprout and other parts of various plants such as eucalyptus, poplar, chestnut, pine, elder, willow, and white poplar. The primary collected substance is hydrolyzed by the β-glucosidase enzyme secreted from the hypopharyngeal salivary glands of honey bees (Ahangari et al., 2011). Propolis is usually brown, but its color changes from yellow to black with a color reflection of red or green, light brown to greenish brown. This color depends on the percentage of its ingredients, the type of the plants used, the time, and location where the propolis is collected by the worker bees (Eshraghi and Valafar, 2008). Propolis contains chemical compounds such as polyphenols (flavonoids, phenolic acids, and their esters), terpenoids, steroids, and wax (depending on the vegetation of the location). It has been proven that propolis has a wide range of biological activities such as antibacterial, antifungal, antiviral, anti-inflammatory, immune enhancer, anticancer, and antioxidant activity (Bonvehí and Gutiérrez, 2011). Additionally, propolis can be considered as a natural source of antioxidants (Andrade et al., 2017). One of the most effective ways to prevent fat oxidation in foods is using antioxidants (Vázquez et al., 2010).
Oils and fats comprise 80% of the world’s food products, and presently more than 100 million tons of them are directly used in human food industries (Gurr, 2009). In the meantime, fat oxidation is the main reason for the diminished quality of foods, and it is a challenge both for the manufacturers and the researchers in the food sciences (Shahidi and Zhong, 2007). One of the most effective ways to prevent fat oxidation in foods is using antioxidants. Antioxidants delay the oxidation process by controlling the oxidation of compounds (fats, oxygen), controlling peroxides, and scavenging free radicals (Vázquez et al., 2010). Due to the undesired effects of synthetic antioxidants in higher concentrations and their low thermal stability during thermal processes and the frying of food products, replacing them with natural antioxidants seems logical (Taghvaei and Jafari, 2015).
Bonvehí and Gutierrez (2011) investigated the antioxidant activity and total phenolics of propolis in northeastern Spain. In this study, the antioxidant activities of 19 samples of propolis extracts with different solvents (ethanol and propylene glycol) were investigated. The results showed that all the studied samples had antioxidant activities (Bonvehí and Gutiérrez, 2011; Castro et al., 2014; Mihai and Mărghitaş, 2010; da Silva Frozza et al., 2013) studied the antioxidant and antitumor activities of a specific kind of propolis extract found in the northeastern Brazil (da Silva Frozza et al., 2013). They reported that red propolis is comprised of complex molecules and has important biological properties such as the capacity of scavenging free radicals and inhibition of tumor cells. In a study conducted by Cottica et al. (2015) , propolis was used as an antioxidant in a dairy drink enriched with conjugated linoleic acid (CLA). The results showed that adding propolis to the formulation of foods containing conjugated linoleic acid leads to the improvement of their nutrition properties and their stability during storage. Thus, the aim of the present work was the optimization of the extraction process of the ethanol extract of propolis using the response surface method (RSM) and investigating the antioxidant effect of this extract on the sunflower oil stability.
MATERIALS AND METHODS
Sample preparation. Sunflower oil without the added synthetic antioxidants was provided from the segol vegetable oil Factory in Khorasan and was stored at 4°C until use. Propolis was collected from the honey beehives in different areas of Esfarayen and cut into small parts and stored in the -20 °C freezer until further analysis. The extraction was performed by two methods:
Preparation of the dry propolis extracts (maceration). The method described by Cottica et al. (2015) with a few adjustments, was used to prepare the ethanol extract of propolis. For this purpose, Propolis was grated. Then the sample and the solvent were integrated (with a 1:10 ratio) with a magnetic mixer at room temperature. In the next step, the mixture was filtered under vacuum conditions by a Buchner funnel with Whatman filter paper No. 1 and was concentrated by a Rotary Evaporator (Model 4001 Laborat) at 40°C. Finally, the extracts were dried under vacuum by a dryer at 36°C and stored in a closed container impervious to air and light at 20°C (Cottica et al., 2015).
Ultrasound-assisted extraction. The extracts were prepared by maceration method with the difference that, using an ultrasonic bath (model DT 255 H), the sample and solvent mixture was exposed to ultrasound waves with the constant frequency of 35 kHz at three times (10, 20, 30 mins) and temperatures (50, 37.5 and 25°C). The ultrasonic bath temperature was continuously controlled by a thermometer, and in case of any change in the temperature, cold water was circulated in the bath to maintain a steady temperature. Also, in order to prevent the evaporation of the solvent, the glassware was covered by foils (Trusheva et al., 2007; Khacha-Ananda et al., 2013; Jug et al., 2014).
Chemical assays
Total phenol and total flavonoid content. Total phenolic compounds content was assayed using the Folin-Ciocalteu reagent, following the method used by Mouhoubi-Tafinine et al. (2016) with a few modifications. An aliquot (0.1ml) of extract was added to 1ml of ethanol and 2.5ml of the Folin-Ciocalteu reagent. The mixture was shaken and allowed to stand for 10min. After that, 2ml of sodium carbonate solution was added to the mixture. The absorbance was read at 760nm after 90min of incubation in dark. The outcome data were expressed as mg/g of gallic acid equivalents in mg per gram (mg GAE/g) of dry extract (Mouhoubi-Tafinine et al., 2016).
Assessment of antioxidant activity - DPPH radical scavenging. In this method, stable radicals (1,1-diphenyl-2-picrylhydrazyl or DPPH) were used as reagents. Following the method described by Miguel et al. (2014) with a few modifications, briefly, 1ml of the extract with different concentrations was added to 3ml of 0.004% (v/v) DPPH and was kept in the dark at room temperature for 20 minutes. Then, its absorbance was measured at 517nm using a spectrophotometer. Ethanol solvent was used to calibrate the device. DPPH inhibition was calculated using the following formula 1:

Where Abs blank shows the optic absorbance of negative control which does not have the extract and Abs sample represents the optical absorption of different concentrations of the extract. Synthetic antioxidant (BHT) was used for comparison (Miguel et al., 2014).
Oven Test. The extracts were added to sunflower oil (without synthetic antioxidant) in three levels of control: the optimized sample (ultrasound), the extract resulted from maceration in the optimal concentration (997.5ppm), and the synthetic antioxidant (BHT). The effect of the treatments on the oxidation of sunflower oil in the oven at the 65°C temperature after 0, 24, 48, and 72 hours was investigated by measuring the peroxide index, thiobarbituric acid index, and the oxidative stability index (Horwitz, 1975; Shahidi and Zhong, 2005).
Peroxide Value (PV). Peroxide value was determined using the AOCS Cd 8-53 standard procedure by employing the acetic acid chloroform solution (with the chloroform to acetic acid ratio of 2:3) and titration with 0.02 N sodium thiosulphate. It was expressed as milliequivalents of peroxide per 100 grams of oil (AOCS, 1998).
Calculation of Thiobarbituric Acid Index (TBA). To determine the TBA index, one gram of oil was added to 1 milliliter of 0.75% Thiobarbituric acid solution and 2 ml of 35% Trichloroacetic acid. Then, the mixture was placed into the boiling-water bath and centrifuged. After that, the aqueous phase was removed by a syringe and was transferred to a Spectrophotometer cell. The absorbance of the sample was measured with a spectrophotometer device at a wavelength of 532nm (Buranasompob et al., 2007).
Oxidative Stability Index (OSI). The oxidative stability was determined in 743 Rancimat apparatus from Metrohm (Made in Switzerland). For this purpose, 2.5-5g of the sample oil was tested at 110oC, under a constant air flow (20L h−1). Volatile products released during the oxidation process were collected in a flask containing distilled water. The oxidation process was recorded automatically by measuring the change in conductivity of the distilled water due to the formation of volatile compounds. The oxidative stability index (OSI) is defined as the point of rapid change in the rate of oxidation, and the results are expressed in hours (h) (Tabee et al., 2008).
The study design. To optimize the extraction of phenolic and antioxidant compounds the Box-Benhken design was used. The studied variables included the concentration of the extract (30-1000ppm), time of extraction (10-30min), and temperature (37.5 - 50°C). The effect of the three factors study and their interactions on the response’s variables (the Peroxide index, Thiobarbituric acid index and Oxidative stability) were carried out by analysis of variance (ANOVA). ANOVA and multiple regression analysis of experimental data were conducted for fitting the second order polynomial model (Formula 2).
Where Y is the response associated with each factor level com-bination; β0 is an intercept; βi is the regression coefficients calculated from the observed experimental values of Y; and Xi is the coded levels of independent variables. The terms XiXj and Xi 2 represent the interaction and the quadratic terms, respectively. The quality of the model was expressed by the F-test at 5% significance level.
RESULTS AND DISCUSSION
The results of the variance analysis of antioxidant and phenolic compounds are presented in Table 1.
Table 1 The results of the variance analysis of antioxidant and phenolic compounds.
| Source | Degrees of freedom | Mean square of antioxidant compounds | Mean squares of phenolic compounds |
|---|---|---|---|
| Model | 9 | 1133.1 + | 6461.37 + |
| A (Concentration of Extract) | 1 | 9090.24 ++ | 16551.08 + |
| B (Time) | 1 | 40.95 ns | 13398.68 + |
| C (Temperatures) | 1 | 11.74 ns | 41.76 ns |
| AB | 1 | 25.15 ns | 881.5 ns |
| AC | 1 | 110.67 ns | 430.56 ns |
| BC | 1 | 116.53 ns | 12447.64 + |
| A2 | 1 | 700.03 ns | 8679.29 + |
| B2 | 1 | 53.51 ns | 1022.99 ns |
| C2 | 1 | 114.13 ns | 4236.51 ns |
| Residual | 1 | 211.41 | 1494.9 |
| Lack of Fit | 3 | 64.04 | 2177.82 |
| Pure Error | 5 | 299.83 | 1085.15 |
| Cor Total | 17 |
*+, ++, and ns represent significance at the levels of 5%, 1%, and insignificance, respectively. R2 (antioxidant compounds)=0.85, R2 (phenolic compounds)=0.97
The results of model processing show that the second-degree level model had the most coefficient of determination for both antioxidant and phenolic compounds. Among the linear effects, the extract concentration for both of the factors had the most effect; among the reciprocal effects, the effect of time and temperature; among the second-degree effects, the effects of extract concentration had the most effect on the amount of antioxidant and phenolic compounds.
DPPH =59.16 +33.71 * A +2.26 * B +1.21 * C +2.51 * A * B +5.26 * A * C +5.4 * B
* C -12.67 * A2 3.5 * B2 + 5.11* C2
Folin-Ciocalteu =196.58 +45.48 * A +40.92 * B -2.28 * C -14.84 * A * B -10.38 * A *
C -55.78 * B * C -44.6 * A2 +15.31 * B2 -31.16 * C2
Effect of free radical (DPPH) scavenging activity of the ethanol extract of propolis. As shown in Figure 1a the highest free radical scavenging activity was observed at the concentration of 1000 ppm and the extraction time of 30min and was equal to 89%. According to the figure, only concentration influences the response variable, and it is supported by the ANOVA results. In low concentrations of the extract, the antioxidant activity was less than the high concentrations. However, in both concentrations, the trend of antioxidant activity changes was relatively constant with the passage of time and followed a direct relationship.
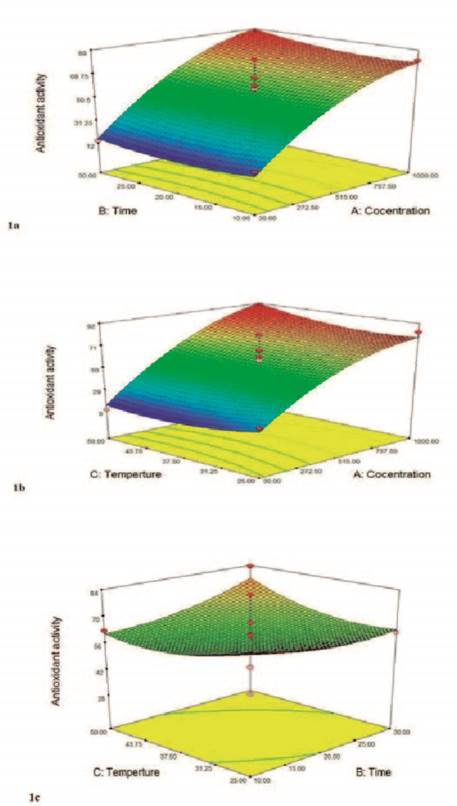
Figure 1. Response surface for the effect of (a); concentration and time (b); concentration and temperature (c); time and temperature on the the free radical scavenging percentage.
With the increase of concentration due to the increase of Hydroxyl groups in the reaction environment, the possibility of donating hydrogen to the free radicals increases. As a result, the scavenging capacity of the extract increases and this leads to the increase in the antioxidant properties (Wardhani et al., 2013).
The trend of changes in antioxidant activity based on time and temperature is shown in Figure 1b. With the rising of temperature, the antioxidant activity increased in both low and high concentrations of the extract. The highest antioxidant activity was observed at the 1000ppm concentration and 50°C temperature, and the least activity was observed at 30ppm and 25°C. The rising in the temperature led to the reduction of solvent viscosity and the increase of the transfer rate of substances from the sample matrix to the solvent (Tabaraki et al., 2012).
This parameter improves the diffusion coefficient of the extracted solvent by improving the dispersion and diffusion and consequently accelerates the extraction process.
Herrero et al. (2005) conducted a study on the optimization of the extraction of antioxidant compounds from the Spirulina platensis algae and observed that increased temperature leads to higher extraction efficiency by improving the physical characteristics (especially viscosity and density) through increasing the solvent dispersion and the antioxidant solubility (Herrero et al., 2005). These results are consistent with the result of the study conducted by Bassani et al. (2014) on the optimization of the extraction conditions of phenolic and flavonoids contents and the investigation of the antioxidant properties of Yerba-Mate leaves (Bassani et al., 2014).
Figure 1c demonstrates the three-dimensional response level curve of the effect of extraction time and temperature on the antioxidant activity response of propolis extracts. Temperature leads to the reduction of viscosity and the increase of solubility of substances in the solvent; also, this factor increases the diffusion coefficient in the extraction assisted by ultrasound. According to this figure, the maximum temperature is about 60°C and the maximum extraction time is 30min. The increase in the extraction time might increase the diffusion of the target substances to the extraction solvent (Ghafoor et al., 2009). According to Oldoni et al. (2015) , the mass transferred to the solvent depends on the extraction time and temperature. Mass transfer increases with the passage of time until the maximum extraction is achieved. Temperature increases extraction by increasing the diffusion rate. However, high temperature can lead to a reduction of antioxidant activity (Oldoni et al., 2015).
Measurement of phenolic compounds of the propolis extract. Figure 2a shows the effect of time and concentration variables on the number of phenolic compounds. As apparent from this figure, in low extract concentrations, the increase in the extraction time leads to higher amounts of phenolic compounds whereas, in high concentrations of the extract, the increase of extraction time leads to lower phenolic compounds. The highest phenolic content was obtained in the 1000ppm concentration and 10 min extraction time. When Li et al. (2017) investigated the optimization of the ultrasound-assisted extraction of polyphenolic content from rattan tea extract; they reached the conclusion that the total phenolic content is negatively impacted by the increase of the concentration of rattan tea extract and its extraction time. These effects showed that higher concentrations of rattan tea extract block the transfer of antioxidant polyphenolic content from the extract due to the increase of viscosity. Moreover, due to the long ultrasonic time, more impurities enter the solvent, which leads to the reduction of total phenolic contents.
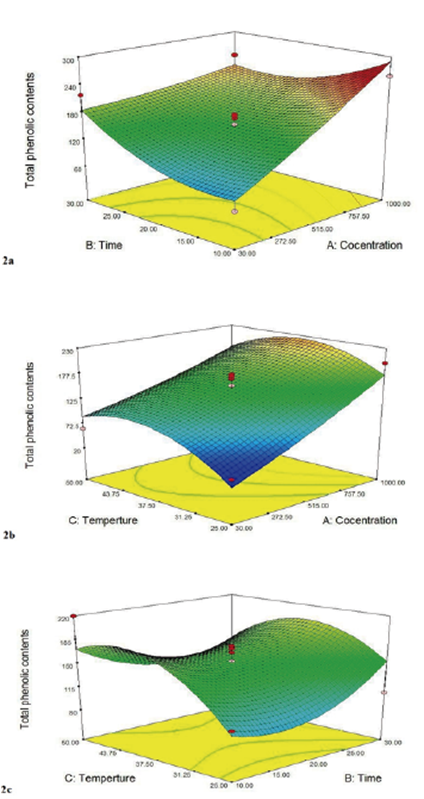
Figure 2 Response surface for the effect of temperature and concentration (a); concentration and temperature (b); temperature and time (c); on the total phenolic conten.
Many researchers have reported the effect of the increase of temperature on the efficiency of phenolic content extraction (Figure 2b). The Increase of temperature naturally improves the solubility of solutes in the solvent and decreases the viscosity and surface tension. The increase of this factor boosts the mass transfer to a suitable level; therefore, the total number of phenolic compounds increases (Li et al., 2017).
In fact, the increase in temperature leads to the reduction of the extraction time as well as the increase of the extraction rate. On the other hand, it is possible that phenolic compounds undergo denaturation above a certain temperature. This temperature range is different in various studies (Fernández-Agulló et al., 2013; Rezai et al., 2012). In this research, the concurrent increase in temperature and concentration leads to an increase in the total phenolic content. On the other hand, it must be taken under consideration that some bio-active substances such as total phenolic compounds are harmed in high temperatures (Jokić et al., 2010).
The increase of temperature over 45°C leads to the reduction of total phenolic contents and as a result, it is possible that the increase of temperature over 45°C causes the degradation of phenolic compounds. Usually, room temperature is the optimal temperature for the extraction of phenolic compounds (25°C). However, in other experiments the optimal extraction temperature is estimated to be higher, for instance, 40°C for the Citrus hystrix bark, 100°C for the Areca catechu seed, and 65°C for Centella asiatica leaves. Nonetheless, the temperature condition must be meticulously regulated during the extraction of flavonoids and their derivatives since these compounds are sensitive to high temperatures. Moreover, mild heating can lead to the softening of tissues, weakening the cell wall and as a result releasing the phenolic compounds (Bouterfas et al., 2014). Hismath et al. (2011) conducted a study on the optimization of the conditions of the ultrasound-assisted phenolic compound extraction from the Azadirachta indica plant leaves (a plant native to the Indian subcontinent belonging to the Meliaceae family) by three factors including extraction temperature, time, and solvent concentration. They reported that the increase in extraction time and concentration leads to an increase in phenolic compounds (Hismath et al., 2011). Figure 2c displays the three-dimensional response level curve of the effect of the extraction time and temperature on the propolis extract antioxidant activity response. As seen in this figure, the increase in extraction time and concentration leads to a significant increase in the extraction of phenolic compounds from the Propolis extract. The solubility and distribution coefficient of phenolic compounds in the solvent is increased with the increase of temperature. According to the results of this figure the maximum extraction of phenolic compounds is carried out at the maximum temperature of 50°C and at the maximum time of 30 min. Ju and Howard (2003) reported that using high temperatures leads to the breakage of the bond between the phenolic compounds and proteins or polysaccharides. Consequently, the increased solubility of phenolic compounds leads to the reduction of viscosity and surface tension. This, in turn, leads to an increase in diffusion and extraction rate. Using temperatures higher than 60°C might lead to the degradation of phenolic compounds (Ju and Howard, 2003). Chen et al. (2007) reported that when the extraction temperature reaches above 60°C, a reduction in the phenolic content is observed, which is due to the destruction of some of the heat-sensitive compounds (Chen et al., 2007). Yingngam et al. (2015) studied the optimization of the process parameters of the extraction of phenolic compounds from the Cratoxylum formosum leaves using RSM. They demonstrated that the total phenolic content increases significantly with the increase of temperature although a reduction in the phenolic content was seen in high temperatures (Yingngam et al., 2015). Rajaei et al. (2010) showed that the extraction of phenolic compounds from pistachio green hull had a high rate up to 20 minutes. Then from 20 to 45 minutes the rate slowed down, and from 45 to 60 minutes the rate was almost steady. Also, the investigation of the extraction of phenolic content from pistachio green hull revealed that the extraction process increases until 65°C and then from 65 to 85°C. It is constant and does not show any significant changes (Rajaei et al., 2010).
Optimization. For the final optimization, the numerical method was used in which the basis for optimization is maximizing the antioxidant properties and phenolic content. In the optimal conditions, the time, temperature, and concentration were determined as 30 min, 34.64°C and 997.52ppm, respectively. In this condition, the free radical scavenging capacity was 85.9% and phenolic content was 253.1mgGAE/100gDW, and the optimal model desirability was obtained as 0.98%. Therefore, propolis can be considered as a good source of phenolic compounds and antioxidants. In another study, Oldoni et al. (2015) also reported optimization the effect of ethanol concentration, time, and temperature on the extraction of total phenolic compounds and antioxidant activity. It is possible to conclude that both the total phenolic content and antioxidant activity are promising in the propolis. Many studies have also reported that propolis is a potential source of bioactive compounds (De Pontes et al., 2018; Osés et al., 2020; de Oliveira Reis et al., 2020).
In Figure 3, the range of the obtained values for the optimization process and its goal are presented. Also, Table 2 shows the comparison between the phenolic compounds and the free radical scavenging ability of propolis prepared by two extraction methods including maceration and optimized sample.
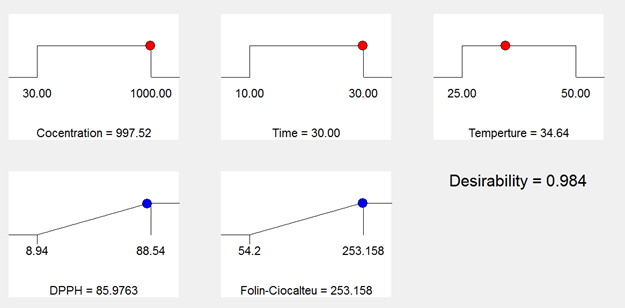
Table 2. Comparison of the Propolis extraction methods by maceration and optimized sample (time: 30min, temperature: 34.64°C, and concentration: 997.52ppm).
| Type of extraction | Phenolic compounds (mgGAE/100gDW) | Free radical scavenging percentage |
|---|---|---|
| Optimized sample | 253.15a±19.34 | 85.97a±9.04 |
| Maceration | 201.7b±19.34 | 70.44b±9.04 |
a,b In each column, numbers with different superscripts are statistically significant (P <0.05)
Determining the Peroxide Index. The changes in the peroxide number of the control, optimal, maceration, and synthetic antioxidant (BHT) containing sample treatments at the times of 0, 24, 48, 72 hours are shown in Figure 4a. In this study, the longer the samples were kept at the temperature of 65°C, the higher the peroxide numbers for all of the samples were; this increase in the peroxide number was gradual and the result of the formation of primary products of oxidation .i.e. hydroperoxides. In the first days of the experiment, the production rate of these products was less than the final day, but with the passage of time, the peroxide index increased significantly. The sunflower oil sample containing the optimized extract had the least peroxide number. Also, the peroxide number of the optimized sample was less than other treatments; this is due to the antioxidant activity of the phenolic compounds in the ethanol extract of propolis. The phenolic compounds in the propolis extract increase the antioxidant properties and scavenging activity of the oil; this, in turn, leads to the reduction of the peroxide index and consequently the increase of oxidative stability of the sunflower oil. These results are consistent with the results of the study conducted by Ghahfarokhi et al. (2012). They investigated the effect of the extraction of phenolic compounds of Quercus branti var persica Lindl with different solvents on their antioxidant activity in the oxidative stability of sunflower oil (Ghahfarokhi et al., 2012).
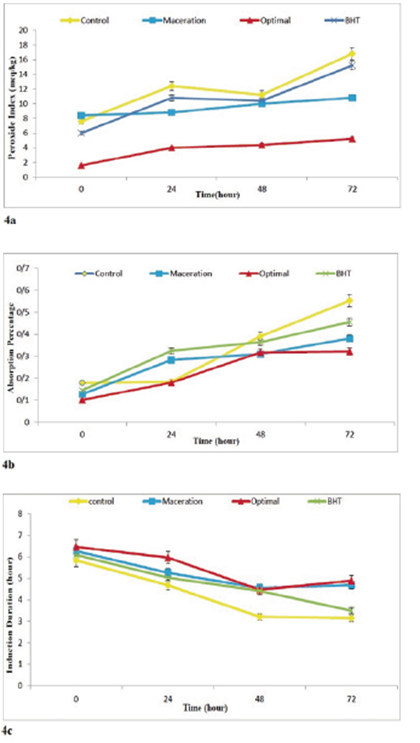
Figure 4. The changes in peroxide index (a), Thiobarbituric Acid index (b) , oxidative stability index(c); on the studied sample oils during 3 days of storage in the temperature of 65°C.
Determination of the Thiobarbituric Acid Index. Sometimes, due to oil spoilage primary products of oxidation such as hydroperoxides degrade into aldehydes and ketones and the peroxide number decreases. Therefore, to measure the secondary products such as aldehydes and ketones the Thiobarbituric Acid test is performed. Figure 4b demonstrates that in the first days of the experiment the production rate of the primary products of oxidation is high but in the final days, the production rate of these products decreased. It is likely that some of the produced hydroperoxides degrade in the diffusion process and create secondary products such as aldehydes and ketones; therefore, the significant increase in the Thiobarbituric Acid index in the final days of the experiment confirms the observed decrease in the rate of the production of hydroperoxides. The amount of malonaldehyde in the oil sample increased from the day of incubation, but this increase had a slow rate until the second day of the experiment. In the samples containing antioxidants, the rate of the production of the secondary products of oxidation was less than the control sample; this may be due to the effect of antioxidants on the prevention of the degradation of hyrdoperoxides.
As mentioned above, hydroperoxides start to degrade in high temperatures and produce more free radicals and continue these chain reactions. However, in some cases, non-radical stable products such as aldehyde, ketones, alcohol, and acids are produced from the degradation of these compounds. In this step, antioxidants break the chain oxidative reactions by donating an electron to the free radicals; on the other hand, they prevent the degradation of peroxides to harmful and stable products by reacting with the alkoxyl (RO°) radicals (Khacha-Ananda et al., 2013). In a study conducted by Rafiee et al. (2011) on the antioxidant properties of olive leaf extract and its application in sunflower oil, the authors concluded that by increasing the storage time of the oil samples in oxidative conditions, the peroxide and thiobarbituric acid indexes increased and as a result the antioxidant activity plunged (Fernández-Agulló et al., 2013).
The Evaluation of oxidative stability. By using the effect of synthetic antioxidant (BHT) on the oxidative stability of sunflower oil during 3 days of storage of the samples at 65°C (Figure 4c), it was revealed that by adding 200ppm of this synthetic antioxidant (BHT), the Rancimat index was higher than the control sample until the third day, and the oxidative stability reduced over time similar to the control sample. Based on the ANOVA test, the oil containing the optimized sample had a higher oxidative stability index compared to the synthetic antioxidant (BHT) during the storage time. This is indicative of the higher stability of the sunflower oil containing the propolis extract compared to the oil containing the synthetic antioxidant (BHT) against oxidation. Investigation of the effect of the optimized sample on the oxidative stability of sunflower oil during the 3-day storage at 65°C revealed that the induction period for the samples containing the ethanol extract of propolis extracted using the ultrasound-assisted method was higher than the maceration sample, synthetic antioxidant (BHT), and control during the 3 days of storage. Overall, by increasing the ovening time, the thermal stability of the oil decreased due to oxidation. Safari et al. (2015) investigated the antioxidant effect of the extract of sesame seed oil on stabilizing edible oils. They reported that the changes in the induction duration in the treatments significantly decreased over time.
CONCLUSIONS
The optimal conditions were a 997.52 ppm of the Propolis extract, temperature of 34.64°C, and Time of 30 min. Under these conditions, the maximum total phenolic content and antioxidant activity were 253.1mgGAE/100gDW and 85.9%, respectively.
The propolis extract with the concentration of 997.52ppm had a suitable effect on the reduction of the peroxide and TBA indexes and the increase of the stability index of the oil compared to the synthetic antioxidant (BHT) in the sunflower oil. Therefore, results showed that propolis extract with a concentration of 997.52 ppm was more effective than BHT synthetic antioxidant for oxidative stability. Thus, propolis can be introduced as a good source of natural antioxidants and this effect is due to the phenolic compounds in it.

