


 Inglés (pdf)
 Articulo en XML
 Referencias del artículo
 Enviar articulo por email
 Citado por SciELO
  Citado por Google
  Similares en
SciELO
Similares en
SciELO  Similares en Google
 Permalink
INTRODUCTION
Global climate change is one of the main factors threatening agriculture (Aryal et al., 2020; Raza et al., 2019; Mârza et al., 2015). Climate variables for crop growth and development, such as precipitation and temperature, directly affect agricultural production (Altieri and Nicholls, 2009; Tao et al., 2011). According to the Food and Agriculture Organization of the United Nations - FAO (2018) drought was the expensive type of disaster from 2005 to 2015 for Latin America and the Caribbean, causing losses of 13 billion dollars in crops and livestock.
The effects of climate variability are specific to each area and crop; in different areas, there may be scenarios of droughts or high rains. For their part, crops require certain climatic conditions for their development (Geng et al., 2016; Mishra et al., 2010). In this context, the vulnerability of different crops has been studied for a specific area (Khan et al., 2021; Reyes et al., 2018; Hatfield et al., 2018). Vulnerability to climate change expresses the susceptibility of a system to adverse effects as a function an exposure, sensitivity, and adaptive capacity (Reyes et al., 2018; Field et al., 2014).
Vulnerability is a concept that conforms to physical, social, economic, and environmental contexts and can therefore be evaluated in different ways. One of the most commonly used methods is an index, through which information is ordered and systematized to plan, assess, and make decisions (Magaña, 2013). Indices provide data on states or specific conditions of systems that cannot be measured directly. Because vulnerability has exposure, sensitivity, and adaptive capacity components, each vulnerability index consists of multiple factors, and indices are selected to quantify such factors (Fritzsche et al., 2014). The index method can be applied in two ways; the first assumes that all indices have the same importance and assign the same weight to them, and the second assigns different weights. In the latter method, the different weights assigned to the indices can be derived from existing literature, from stakeholder data, or from expert opinion (Fritzsche et al., 2014).
Specifically, for coffee growing, climate variability may affect flowering and plant growth (Jaramillo and Arcila, 2009; Ramírez et al., 2011). Colombian coffee zone soils are characterized by variable charge, contents of organic matter greater than 8%, acidity problems (pH less than 5), low phosphorus levels (less than 10mgkg-1), low bulk density (< than 1.0g cm-3) and high porosity (> than 65%) (Lince-Sálazar, 2021; Sadeghian and Duque, 2017; FNC - Federación Nacional de Cafeteros, 2013a; Salamanca and Sadeghian, 2005). The zone is represented mainly by the orders Inceptisol 60.1%, Andisol 17.4%, Entisol 10.4% and Molisol 7.9%, which cover more than 90% of the area (Lince-Sálazar and Sadeghian, 2021; FNC and IGAC-Instituto Geográfico Agustín Codazzi, 2017). Accordingly, the soil is one of the most important resources to consider, requiring sustainable management. Several soil processes can be affected by climate change, which causes problems such as nutrient loss by leaching, decreased organic matter content, and erosion, among others (Elbehri et al., 2017). Leaching means the removal of soluble materials by water moving through the soil profile (SSSA - Soil Science Society of America, 2008). It leads the nutrient loss such as Ca2+, Mg2+ and K+, which are carried into deep soil layers, far away from plant roots (Sadeghian et al., 2015). On the other hand, erosion means the loss of the superficial soil layer by the effect of rain or wind (FNC, 2013b). This process causes soil property degradation, which means loss of soil fertility and low yields (Nunes et al., 2020; Maximillian et al., 2019).
Despite the aforementioned problems, few studies have aimed to find alternatives to reduce soil vulnerability to climate change and cope with its effects on Colombian coffee production. This study opens the door to future research on climatic variability effects on coffee crops. The aim of the study was to analyze soil components involved in the sustainability of the coffee production system as affected by extreme high and low precipitation events.
MATERIAL AND METHODS
The study was conducted from 2016 to 2018 in 432 coffee farms in the municipalities of Balboa and Santuario in Risaralda department and Salamina in Caldas department, located in the central regions of Colombia. There were 140 farms from Balboa, 150 from Salamina 150, and 142 from Santuario. To assess soil vulnerability to climate variability (SVCV) of each location, three key sustainability factors were analyzed during high and low precipitation events. These factors were: i) physical and chemical properties: soil samples were taken at a depth of 0,30 cm and an analysis of pH, Al3+, Ca2+, Mg2+, K+, P, organic carbon, particle size, and water retention capacity. ii) leaching of nutrients applied by fertilization: it was evaluated the leaching of phosphorus, potassium, calcium and magnesium, and iii) soil management encompassed: agricultural system, forestry system, extensive livestock farming, land-use planning, soil management, soil cover (presence of soil cover plants and/or litterfall), integrated weed management, minimum tillage, slope protection, water source protection and water management, natural drainage protection, buffer strip protection in natural drainages, rainwater, domestic, and coffee processing water management (harvesting, plumbing, and piping), maintenance of water storage tanks, pipes, and gutters, soil erosion, erosion evidence, landslide evidence, landslide prevention, erodibility vulnerability index.
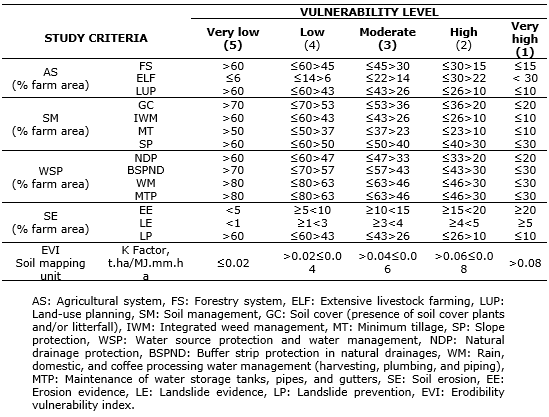
Sensitivity indices. Were measured using a weighted aggregation structure, defining weight values based on expert knowledge. According to Fritzscheet al. (2014), five categories from 1 to 5 were established; 1 was the most vulnerable condition and 5 the least vulnerable to extreme rainfall events. The results from both partial and general aggregations were classified as very low vulnerability for values ≥ 4.25; low < 4.25 and ≥ 3.25; moderate < 3.25 and ≥ 2.25; high < 2.25 and ≥ 1.25; and very high < 1.25. The methods for assessing the three indices and the general parameter (SVCV) are defined below.
Soil nutrient availability and conservation vulnerability index-SNACVI. This dimensionless index was defined based on the i) water retention capacity (WRC), calculated from readily available water (RAW) with weight value of the 50%, organic matter (OM) with weight value of the 25%, and texture (T) with weight value of the 25%, ii) exchangeable acidity and bases (EAB), calculated from pH with weight value of the 25%, Al with weight value of the 25%, K with weight value of the 25%, Mg with weight value of the 15% and Ca with weight value of the 10%, and iii) available phosphorus content (P) with weight value of the 10%.
The properties were weighted according to the following equations, and the criteria were assigned to the categories outlined in Table 1.

Where:
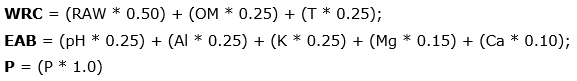
Table 1. Categories of the study criteria for the soil nutrient availability and conservation vulnerability index (SNACVI).
| STUDY CRITERIA | CATEGORIES | |||||
|---|---|---|---|---|---|---|
| 5 | 4 | 3 | 2 | 1 | ||
| Exchangeable acidity and bases (EAB) | pH | ≥5.5 | ≥5.0<5.5 | ≥4.5<5.0 | ≥4.0<4.5 | <4.0 |
| Al3+, cmolc.kg-1 | <0.5 | ≥0.5<1.0 | ≥1.0<1.5 | ≥1.5<2.0 | ≥2.0 | |
| Ca2+, cmolc.kg-1 | ≥4.5 | ≥3.0<4.5 | ≥1.5<3.0 | ≥0.75<1.5 | <0.75 | |
| Mg2+, cmolc.kg-1 | ≥1.2 | ≥0.9<1.2 | ≥0.6<0.9 | ≥0.3<0.6 | <0.3 | |
| K+, cmolc.kg-1 | ≥0.6 | ≥0.4<0.6 | ≥0.2<0.4 | ≥0.1<0.2 | <0.1 | |
| Water retention capacity (WRC) | RAW, mm | ≥40 | ≥30<40 | ≥30<20 | ≥20<10 | <10 |
| MO, % | ≥16 | ≥12<16 | ≥8<12 | ≥4<8 | <4 | |
| Texture-T, Bouyoucos | F | FA, FAr, FArA, FL | AF | ArA, ArL, L | A, Ar | |
| Phosphorus (P) | P, mg.kg-1 | ≥30 | ≥20<30 | ≥10<20 | ≥5<10 | <5 |
The SNACVI was estimated by randomly selecting 432 coffee farms (Balboa: 148; Santuario: 140; Salamina: 144), assigning the respective soil mapping units according to the National Federation of Coffee Growers of Colombia (FNC-Federación Nacional de Cafeteros de Colombia, 2013; Figure 1, Table 2). At each farm, soils were sampled at 20cm depth for pH (potentiometric pH, 1:1 soil-water ratio), organic carbon (Walkley-Black), P (Bray II), Al+3 (1 M KCl and quantification by volumetry), exchangeable K+, Ca2+, and Mg2+ (1 N ammonium acetate pH 7.0, quantification by atomic absorption spectrophotometry-AAS), and texture (Bouyoucos) analysis (IGAC, 1990).
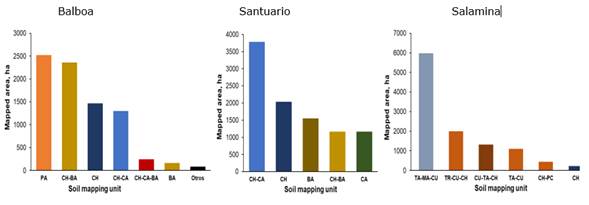
Figure 1. Area of the soil mapping units in the study municipalities-CH: Chinchiná, CH-CA: Chinchiná - Catarina, BA: Balboa, CA: Catarina, PA: Parnaso, CU: Chuscal, TA: Tablazo, PC: Pácora, TR: Tareas.
Table 2. Soil mapping units of the study municipalities (FNC, 1985).
| MAPPING UNIT | TYPOLOGY | PARENT MATERIAL |
| Chinchiná | 80% Typic Dystrandepts and 20% others (Andic Dystropepts, Typic Dystropepts, and Entic Dystropepts) | Volcanic ashes |
| Balboa | 40% Typic Eutrudepts; 35% Paralithic Eutrudepts; 15% Typic Udorthents; 10% others | Diabase |
| Catarina | 40% Paralithic Udorthents; 35% Typic Eutrudepts; 10% Andic Eutrudepts; 15% others | Biotite talc schist |
| Parnaso | 75% Typic Eutrudepts; 15% Paralithic Eutrudepts; 10% others | Biotite hornblende basalt |
| Chuscal | 40% Paralithic Eutrudepts; 25% Typic Udorthents; 20% Typic Eutrudepts; 15% others | Amphibolite |
| Tablazo | 50% Typic Eutropepts; 35% Typic Dystrandepts; 15% others (Paralithic Eutropepts and Typic Troporthents) | Talc schist |
| Pácora | 80% Typic Dystrandepts; 20% others (Typic Dystropepts, Entic Dystrandepts, and Paralithic Dystropepts) | Volcanic ashes |
| Tareas | 50% Typic Eutropepts; 40% Paralithic Troporthents; 10% others | Schists |
In 133 of the 432 farms (Balboa: 36; Santuario: 58; Salamina: 39), the WRC at field capacity (FC), permanent wilting point (PWP; pressure plates at 0.03 and 1.5 MPa), and apparent density (AD; Coile cylinder) were determined as inputs to calculate the RAW. With the results from the physical tests, the average per soil mapping unit was calculated for each municipality; this value was assigned to each farm in which this parameter was unavailable. Descriptive statistical analysis was performed for WRC, EAB, P, and SNACVI in the software SAS, expressing the average as the vulnerability index of each municipality.
Soil leaching vulnerability index-SLeVI. This index was defined based on the loss levels of four nutrients, phosphorus (P), potassium (K), calcium (Ca), and magnesium (Mg), which were weighted according to the following equation, and the categories were assigned to each criterion as described in Table 3.
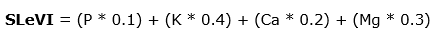
Table 3. Study criteria for vulnerability to soil nutrient loss by leaching.
| STUDY CRITERIA | VULNERABILITY LEVEL | ||||
| Very low (5) | Low (4) | Moderate (3) | High (2) | Very high (1) | |
| Phosphorus losses-L-P, % | <10 | ≥10<20 | ≥20<30 | ≥30<40 | ≥40 |
| Potassium losses-L-K, % | <10 | ≥10<20 | ≥20<30 | ≥30<40 | ≥40 |
| Calcium losses-L-Ca, % | <10 | ≥10<20 | ≥20<30 | ≥30<40 | ≥40 |
| Magnesium losses-L-Mg, % | <10 | ≥10<20 | ≥20<30 | ≥30<40 | ≥40 |
The SLeVI was assessed in the five most representative soil mapping units of the municipalities in the study area: Chinchiná - Catarina units in Santuario, Parnaso and Chinchiná units in Balboa, and Tablazo unit in Salamina. From each unit, a farm used for growing coffee for at least 10 years was selected for collection of 5kg soil subsamples, from the first 0.3 m of the soil profile, until reaching 150kg. The soil corresponding to each location was taken to the Cenicafé laboratory. There, it was homogenized and sieved through 1 to 4mm mesh to select the soil portion of intermediate size between the aforementioned mesh sizes.
Each sample from each location was packed in PVC pipes measuring 10cm in diameter and 0.3m in length and was wetted by capillary action with deionized water to a moisture value close to that at which the soil retains water at a tension of 0.033MPa (field capacity). After 5 days, at the top of the pipes, four treatments were applied, each with four replicates, dose of potassium, magnesium, and phosphorus fertilizer and dolomite lime, from the sources and in the quantities outlined in Table 4. A control without fertilization was also included.
After applying the treatments, the soils were irrigated weekly, totaling 12 times (three months), each time with a Type II water volume of 360mL per container; this amount was divided into six applications of 60mL every 30 minutes. After collecting the leachate, Ca2+, Mg2+, and K+ were quantified by AAS, and P was quantified by UV-Vis spectrophotometry. For each replicate, the total amount of the leached element was estimated as the sum of weekly losses minus the value of the blank treatment, and the amount of each element per treatment was calculated as the average of the losses of four replicates, expressed as percentage. The percentage of leached element was assigned to each of the 432 farms, according to the corresponding soil unit, and then used to estimate the SLeVI.
Table 4. Dose of fertilizers and dolomite used in the leaching assessment.
| TREATMENT | AMOUNT APPLIED (g/PIPE) | ||||
|---|---|---|---|---|---|
| ELEMENT ASSESSED | Dolomite lime | KCl (0-0-60) | Kieserite (0-0-0 25-20) | DAP (18-46-0) | |
| Control | 0 | 0 | 0 | 0 | |
| Calcium-Ca | 12 | 0 | 0 | 0 | |
| Magnesium-Mg | 0 | 0 | 3.3 | 0 | |
| Potassium-K | 0 | 6 | 0 | 0 | |
| Phosphorus-P | 0 | 0 | 0 | 2.6 | |
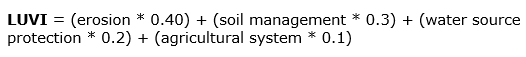
Soil loss vulnerability index - SLoVI. To assess soil loss vulnerability, two indices related to the vulnerability assessment based on current land use (land-use vulnerability index-LUVI) and on erodibility (erodibility vulnerability index-EVI) were used.
The LUVI was defined by i) soil management: assessing the implementation of integrated weed management (IWM), groundcover (GC), minimum tillage (MT), and slope protection (SP); ii) water source protection (WSP): considering the maintenance of water storage tanks, pipes, and gutters (MTP), rainwater, domestic and coffee processing water management (WM), natural drainage protection (NDP), and buffer strips (BS); iii) agricultural system (AS): assessing land-use planning (LUP), the presence of a forestry system (FS), and extensive livestock farming (ELF); iv) erosion: considering landslide prevention and the presence of landslides and sheet erosion. The EVI was assessed using the erodibility index (K factor), which was directly determined under laboratory conditions. The properties were weighted according to the following equations, and the criteria were assigned to the categories outlined in Table 5.
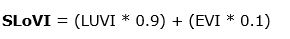


Where:
SLoVI: Soil loss vulnerability index
LUVI: Land-use vulnerability index
EVI: Erodibility vulnerability index
To assess the LUVI, a 15-item questionnaire related to the evaluation criteria in Table 5 was administered to the 432 farms mentioned in the previous stages, and the responses were verified by expert surveyors.
To assess the EVI, 42 disturbed soil samples were collected in farms randomly selected from the 432 farms mentioned in the first two stages. The sampled soil weighed approximately 10 kg and consisted of a mixture of three subsamples from the same plot collected at a depth ranging from 0 to 10cm. These samples were packed in plastic bags, shade-dried at room temperature, and sieved with a 11.2mm mesh.
The samples were spread on galvanized trays (20cm wide, 50cm long and 5cm high), packed for drainage, and saturated by capillary action for 24 hours. Subsequently, the soils were drained for one hour and placed under the rainfall simulator with VeeJet 80100 oscillating nozzles at a 45° angle, with an average simulated rainfall intensity of 80mm.h-1. After the simulated rainfall, soil particles detached by drag and by rain splash were collected, dried at 105°C for 24 hours, and weighed on an analytical balance. With the data on soil loss and the rainfall intensity values, the erodibility (K) factor of each site was determined using the average per soil unit to calculate the K value per unit. After determining the EVI of the soil units, the value corresponding to the respective soil unit was assigned to each farm.
Coffee-growing soil vulnerability to climate variability-SVCV. The SVCV was calculated with the mathematical and weighted addition of the sensitivity indices SNACVI, SLeVI, and SLoVI of each farm, according to the following equation:

RESULTS AND DISCUSSION
Soil nutrient availability and conservation vulnerability index-SNACVI. The mean SNACVI of the three municipalities was moderate according to Table 1, the coefficient of variation was low, and the data distribution showed a tendency towards a low level of vulnerability (Figure 2, Table 6).
Table 6. Means and coefficients of variation in the soil nutrient availability and conservation vulnerability indices due to climate variability in the study municipalities.
| INDEX | Risaralda | Caldas | |||||
|---|---|---|---|---|---|---|---|
| Balboa (n=148) | Santuario (n=140) | Salamina (n=144) | |||||
| mean | CV (%) | mean | CV (%) | mean | CV (%) | ||
| Soil nutrient availability and conservation vulnerability index | SNACVI | 2.87 | 13 | 2.88 | 10 | 2.90 | 9 |
| EAB | 3.91 | 18 | 3.43 | 20 | 3.87 | 14 | |
| WRC | 2.08 | 21 | 2.41 | 21 | 2.09 | 11 | |
| P | 3.24 | 43 | 3.71 | 40 | 3.99 | 31 | |
SNACVI: Soil nutrient availability and conservation vulnerability index, EAB: exchangeable acidity and bases, WRC: water retention capacity, P: phosphorus.
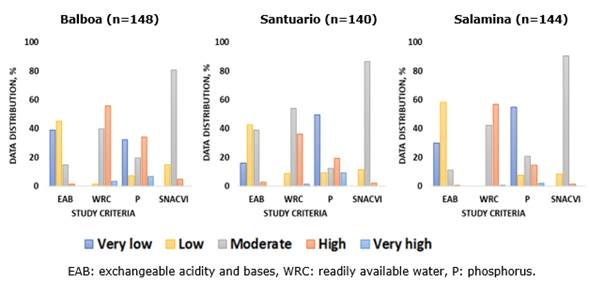
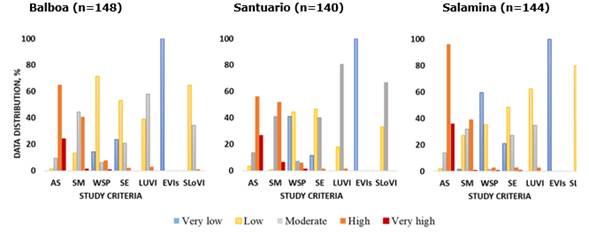
Figure 2. Data distribution of the study criteria for the soil nutrient availability and conservation vulnerability index (SNACVI), in the three municipalities of interest
In relation to the subindices, the EAB was low in the three municipalities. In Balboa and Salamina, the data ranged from very low to low levels and in Santuario from low to moderate levels. The latter resulted from the higher soil acidity (lower pH and higher Al content) observed in Santuario, which is related to the lower Ca and Mg content (Table 7) and effective cation exchange capacity (ECEC) (Ca + Mg + K + Al), although the levels of exchangeable bases (Ca, Mg, and K) were relatively high according to the coffee crop requirements in Colombia (Sadeghian, 2008). The previous result corroborates the usefulness of pH as an indicator of soil sensitivity, as indicated by Sarmiento et al. (2018).
Table 7. Data distribution, expressed as percentages, in the categories established for the SNACVI study criteria, in the three municipalities of interest.
| STUDY CRITERIA | CATEGORIES | ||||
|---|---|---|---|---|---|
| 5 | 4 | 3 | 2 | 1 | |
| Data distribution (%) | |||||
| Balboa (n = 148) | |||||
| pH | 9 | 41 | 40 | 8 | 2 |
| Al3+, cmolc.kg-1 | 38 | 34 | 11 | 6 | 11 |
| Ca2+, cmolc.kg-1 | 34 | 40 | 22 | 3 | 1 |
| Mg2+, cmolc.kg-1 | 66 | 17 | 13 | 2 | 1 |
| K+, cmolc.kg-1 | 44 | 21 | 30 | 4 | 1 |
| RAW, mm | 0 | 1 | 1 | 17 | 82 |
| OM, % | 0 | 2 | 21 | 58 | 19 |
| Texture (T) | 14 | 78 | 0 | 0 | 8 |
| Santuario (n = 140) | |||||
| pH | 2 | 20 | 58 | 18 | 2 |
| Al3+, cmolc.kg-1 | 16 | 32 | 24 | 12 | 17 |
| Ca2+, cmolc.kg-1 | 18 | 17 | 40 | 19 | 6 |
| Mg2+, cmolc.kg-1 | 37 | 19 | 19 | 16 | 9 |
| K+, cmolc.kg-1 | 42 | 26 | 27 | 5 | 0 |
| RAW, mm | 0 | 0 | 4 | 29 | 67 |
| OM, % | 9 | 20 | 24 | 41 | 6 |
| Texture (T) | 12 | 86 | 0 | 0 | 2 |
| Salamina (n = 144) | |||||
| pH | 21 | 39 | 31 | 9 | 0 |
| Al3+, cmolc.kg-1 | 40 | 17 | 16 | 6 | 22 |
| Ca2+, cmolc.kg-1 | 56 | 20 | 23 | 1 | 1 |
| Mg2+, cmolc.kg-1 | 74 | 11 | 10 | 4 | 1 |
| K+, cmolc.kg-1 | 42 | 15 | 32 | 11 | 1 |
| RAW, mm | 0 | 0 | 0 | 2 | 98 |
| OM, % | 0 | 2 | 8 | 76 | 13 |
| Texture (T) | 38 | 60 | 0 | 0 | 2 |
The subindex WRC was high in Balboa and Salamina and moderate in Santuario. In the three municipalities, the data ranged from moderate to high levels. The moderate vulnerability level of Santuario is attributed to its soil OM content (9.1%), which was higher than that of other municipalities (OM Baboa 6.0%; OM Salamina 5.9%), although the textural classes were similar in all three municipalities. This difference occurred because OM is strongly related to physical properties, is important for soil resistance and resilience processes (Gregory et al., 2009), and affects the water storage capacity of agricultural soils, which can be improved by increasing the OM content (Obour et al., 2018).
P value was high in the three municipalities in (Balboa=58.2mg.kg-1, Santuario=68.8mg.kg-1, Salamina=121.5mg.kg-1). In the latter two municipalities, the data remained at very low levels, with higher P values in Salamina than in Santuario. In Balboa, the data were distributed from very low to high levels, and the coefficient of variation was the highest, although it was high in all three municipalities. The high variability of P is attributed to anthropogenic conditions because, in the different soil mapping units, the concentrations ranged from 3 to > 200 mg.kg-1, which is a common condition for this element, in that land use plays a more relevant role than environmental factors in its distribution (Roger et al., 2014). Despite its high variability, P must be included as an index of vulnerability to climate variability because the set of properties reflects soil sensitivity and function (Bünemann et al., 2018). In addition, Phosphorus (P) has been identified as one of the most variability nutrients in soils in the coffee-growing region of Colombia (Lince and Sadeghian, 2016; Patiño et al., 2007; Sadeghian et al., 2019). An important part of this variability is related to the localized application of organic and inorganic fertilizers, which increases the contents of the element, especially in the first 0.05m of depth (Arias and Sadeghian, 2011; Nze Memiaghe et al., 2021). The variability of P has also been related to parental material (Gao et al., 2019), use (Gao et al., 2019; Page et al., 2005; Roger et al., 2014; Wilson et al., 2016), and texture of the soil (O’halloran et al., 1985); in contrast, environmental variables such as altitude, slope, humidity index and geomorphology have revealed little effect (Roger et al., 2014).
Among the general trends observed, the acidity and low interchangeable cations, and storage capacity stand out as potential problems in Santuario soils, suggesting a higher vulnerability to excess water than in the other two municipalities. In contrast, in Balboa and Salamina, the problem is the low organic matter content, which affects nutrient especially nitrogen availability, soil porosity, and water retention capacity, making these areas more vulnerable to water deficit.
Soil leaching vulnerability index-SLeVI. On average, this index was very low in Balboa and Salamina and low in Santuario, with lower coefficients of variation in the first two municipalities than in Santuario. In Balboa and Santuario, the data were distributed between the very low and low classes, with a tendency towards very low vulnerability in Balboa and towards low vulnerability in Santuario, whereas all data were in the very low level in Salamina (Table 8, Figure 3).
Table 8. Means and coefficients of variation in the soil leaching vulnerability indices due to climate variability in the study municipalities.
| INDEX | Risaralda | Caldas | ||||
|---|---|---|---|---|---|---|
| Balboa (n=148) | Santuario (n=140) | Salamina (n=144) | ||||
| mean | CV (%) | mean | CV (%) | mean | CV (%) | |
| SLeVI Phosphorus losses-L-P, % Potassium losses-L-K, % Calcium losses-L-Ca Magnesium losses-L-Mg | 4.33 | 3 | 3.57 | 19 | 4.74 | 7 |
| 5.0 | 0 | 5.0 | 0 | 5.0 | 0 | |
| 3.83 | 10 | 2.7 | 44 | 4.58 | 11 | |
| 5.0 | 0 | 5.0 | 0 | 5.0 | 0 | |
| 4.32 | 11 | 3.3 | 30 | 4.68 | 10 | |
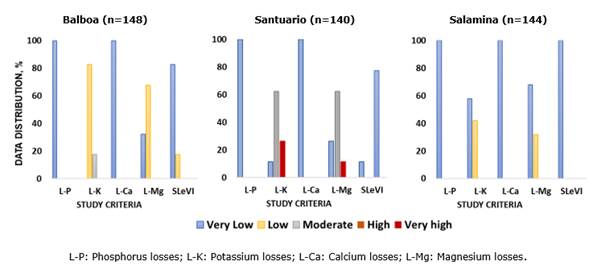
Figure 3. Data distribution of the study criteria of the soil leaching vulnerability index (SLeVI), in the three locations of interest.
Among the nutrient losses from leaching, phosphorus and calcium losses were very low in all soils tested. Therefore, in the three municipalities, the level of vulnerability to the loss of these nutrients was very low because phosphorus has low soil mobility, primarily due to fixation, and calcium has a smaller hydration radius than the other cations and hence is more strongly retained by soil colloids and is less complexed, leached, and/or precipitated than the other cations analyzed (Sparks, 2003).
The mean K losses from leaching in Balboa indicated that this municipality has a low vulnerability level, and the data were distributed between the low and moderate levels, tending towards the low level. In Santuario, the level of vulnerability was moderate, with data distributed between very low, moderate, and very high levels and with 89% of the soils from the study farms ranging from moderate to very high levels. In Salamina, the vulnerability to potassium leaching was very low, with the data ranging from very low to low levels and tending towards very low levels. K losses are attributed to element solubility because this is a monovalent cation, which is easily displaced by other divalent cations (Mengel, 2007).
The level of vulnerability to Mg losses in Balboa and Salamina was very low, with the data ranging from very low to low levels and tending towards low levels in Balboa and very low levels in Salamina. In Santuario, the level of vulnerability was low, with the data distributed between very low, moderate, and very high levels and with 73% of the study farms concentrated between moderate and very high levels.
According to the SLeVI study criteria, in the three municipalities, K and Mg showed vulnerability to high precipitation phenomena, in contrast to P and Ca, which were the least leached elements, and their level of vulnerability to this phenomenon was therefore very low.
Soil loss vulnerability index-SLoVI. The mean SLoVI of the municipalities Balboa and Salamina was low, with data distribution tending towards the moderate level, and the mean SLoVI of Santuario was at the moderate level and tending towards the low level (Table 9, Figure 4). In the three municipalities, the SLoVI had a low coefficient of variation (< 12%).
AS: Agricultural system, SM: Soil management, WSP: Water source protection and water management, SE: SE: Soil erosion, LUVI: Land-use vulnerability index, EVIs: Erodibility vulnerability index.
Figure 4. Data distribution of the study criteria for the soil loss vulnerability index (SLoVI) in the three locations of interest.
Table 9. Means and coefficients of variation in the soil loss vulnerability indices due to climate variability in the study municipalities
| INDEX | Risaralda | Caldas | ||||
|---|---|---|---|---|---|---|
| Balboa (n=148) | Santuario (n=140) | Salamina (n=144) | ||||
| mean | CV (%) | mean | CV (%) | mean | CV (%) | |
| SLoVI | 3.32 | 10.03 | 3.13 | 9.34 | 3.49 | 11.43 |
| LUVI | 3.13 | 11.81 | 2.92 | 11.11 | 3.32 | 11.34 |
| AS | 1.72 | 34.89 | 1.85 | 39.09 | 2.28 | 28.68 |
| FS | 2.89 | 56.05 | 3.27 | 51.68 | 3.71 | 42.17 |
| ELF | 3.97 | 28.58 | 5.00 | 0.00 | 3.31 | 82.96 |
| LUP | 1.28 | 49.80 | 1.33 | 62.92 | 1.67 | 51.66 |
| SM | 2.43 | 28.17 | 2.02 | 27.58 | 2.61 | 32.29 |
| GC | 2.16 | 44.83 | 1.29 | 38.82 | 2.41 | 52.03 |
| IWM | 2.20 | 51.06 | 2.08 | 46.34 | 2.33 | 55.42 |
| MT | 4.61 | 15.73 | 3.92 | 29.94 | 4.83 | 12.23 |
| SP | 1.41 | 75.08 | 1.45 | 75.01 | 1.56 | 81.42 |
| WSP | 3.69 | 19.59 | 3.94 | 22.79 | 4.26 | 15.56 |
| NDP | 1.45 | 71.83 | 2.32 | 61.06 | 2.55 | 55.84 |
| BSPND | 2.38 | 54.70 | 3.57 | 46.39 | 3.50 | 40.69 |
| WM | 4.46 | 21.94 | 4.12 | 29.85 | 4.66 | 18.15 |
| MTP | 4.45 | 27.89 | 4.47 | 25.43 | 4.84 | 15.96 |
| SE | 3.73 | 16.94 | 3.35 | 18.24 | 3.65 | 19.47 |
| EE | 1.57 | 57.43 | 1.71 | 55.47 | 1.69 | 62.08 |
| LE | 3.53 | 51.50 | 2.39 | 67.34 | 3.26 | 58.07 |
| LP | 4.90 | 11.60 | 4.65 | 13.11 | 4.82 | 15.65 |
| EVI | 5.0 | 0.0 | 5.0 | 0.0 | 5.0 | 0.0 |
AS: Agricultural system, FS: Forestry system, ELF: Extensive livestock farming, LUP: Land-use planning, SM: Soil management, GC: groundcover (presence of groundcover plants or litterfall), IWM: Integrated weed management, MT: Minimum tillage, SP: Slope protection, WSP: Water source protection and water management, NDP: Natural drainage protection, BSPND: Buffer strip protection in natural drainages, WM: Rainwater, domestic, and coffee processing water management (harvesting, plumbing, and piping), MTP: Maintenance of water storage tanks, pipes, and gutters, SE: Soil erosion, EE: Erosion evidence, LE: Landslide evidence, LP: Landslide prevention, EVI: erodibility vulnerability index; LUVI: land-use vulnerability index.
The mean LUVIs of Balboa and Santuario were moderate and that of Salamina was low. This subindex, indicative of the agricultural system, had the highest vulnerability, specifically for land-use planning, which was high in the three municipalities, with high coefficients of variation. This finding can be explained because, although most farms lack land-use planning, it is partially performed in some farms (Table 10).
The population distribution of LUVIs (Table 10) highlights that minimum tillage, WM, MTP, and landslide prevention (LP) are performed by the coffee growers in the three municipalities. However, land-use planning, slope protection, and natural drainage protection require an awareness and training program in the communities, with follow-up, to decrease soil vulnerability to sheet erosion, which is a determinant of high soil vulnerability, in the three municipalities, according to the present study.
Table 10. Frequency distribution, by percentage, of soil loss vulnerability indices in the study municipalities.
| INDEX | Risaralda | Caldas | ||||||||||||||
|---|---|---|---|---|---|---|---|---|---|---|---|---|---|---|---|---|
| Balboa (n=148) | Santuario (n=140) | Salamina (n=144) | ||||||||||||||
| MB | B | M | A | MA | MB | B | M | A | MA | MB | B | M | A | MA | ||
| AS | FS | 25 | 19 | 8 | 16 | 32 | 38 | 16 | 9 | 9 | 28 | 49 | 17 | 7 | 10 | 17 |
| ELF | 99 | 0 | 1 | 1 | 0 | 100 | 0 | 0 | 0 | 0 | 78 | 3 | 4 | 3 | 13 | |
| LUP | 1 | 1 | 4 | 16 | 79 | 2 | 2 | 4 | 9 | 82 | 0 | 1 | 24 | 17 | 58 | |
| SM | GC | 0 | 7 | 34 | 26 | 32 | 0 | 0 | 2 | 24 | 73 | 6 | 12 | 34 | 13 | 35 |
| IWM | 1 | 13 | 32 | 14 | 40 | 1 | 1 | 44 | 15 | 40 | 3 | 20 | 23 | 13 | 41 | |
| MT | 71 | 21 | 6 | 1 | 1 | 41 | 27 | 21 | 4 | 6 | 90 | 7 | 2 | 0 | 1 | |
| SP | 5 | 2 | 5 | 3 | 84 | 6 | 1 | 3 | 9 | 81 | 10 | 3 | 1 | 6 | 80 | |
| WSP | NDP | 5 | 3 | 5 | 8 | 79 | 9 | 14 | 21 | 9 | 46 | 15 | 9 | 28 | 13 | 35 |
| BSPND | 11 | 5 | 29 | 20 | 34 | 51 | 9 | 5 | 17 | 19 | 31 | 28 | 17 | 7 | 17 | |
| WM | 72 | 12 | 9 | 6 | 1 | 55 | 23 | 9 | 6 | 7 | 83 | 7 | 6 | 3 | 1 | |
| MTP | 81 | 4 | 1 | 6 | 7 | 77 | 9 | 4 | 3 | 6 | 96 | 0 | 0 | 1 | 3 | |
| SE | EE | 0 | 6 | 9 | 20 | 65 | 0 | 5 | 19 | 17 | 58 | 1 | 7 | 15 | 13 | 64 |
| LE | 57 | 2 | 5 | 7 | 29 | 20 | 9 | 6 | 17 | 47 | 51 | 3 | 5 | 3 | 38 | |
| LP | 97 | 0 | 1 | 1 | 1 | 72 | 22 | 5 | 1 | 0 | 94 | 1 | 2 | 1 | 3 | |
SA: Agricultural system, FS: Forestry system, ELF: Extensive livestock farming, LUP: Land-use planning, SM: Soil management, GC: groundcover (presence of groundcover plants or litterfall), IWM: Integrated weed management, MT: Minimum tillage, SP: Slope protection, WSP: Water source protection and water management, NDP: Natural drainage protection, BSPND: buffer strip protection in natural drainages, WM: rainwater, domestic, and coffee processing water management (harvesting, plumbing, and piping), MTP: Maintenance of water storage tanks, pipes, and gutters, SE: Soil erosion, EE: Erosion evidence, LE: Landslide evidence, LP: Landslide prevention.
The EVIs of the three municipalities were very low because the erodibility index (K factor) of the main soil mapping units of the municipalities indicated that the soils are resistant to surface erosion (Table 11) when facing torrential rain phenomena with high erosive power. This resistance is explained by the soil organic matter, which joins particles and prevents the erosion (Ouyang et al., 2018). Another key factor is the higher proportion of sand-sized particles than of silt and clay (Balboa: sand=49.6% - clay=24.3%; Santuario: Sand=54.5% - clay=18.7%; Salamina: Sand=47.7% - clay=22.9%), which, according to Choo et al. (2018), opposes movement more than others, thereby decreasing detachment. Although the aforementioned soils are naturally resistant to rain, some factors decrease this resistance, including intensive tillage, lack of groundcover, steep slopes, long slopes, and a decreased concentration of aggregating agents (Mahmoodabadi and Sajjadi, 2016). In addition, considering the high annual erosivity that occurs in the municipalities of Balboa (10,882.74 MJ.mm.ha-1), Santuario (11,762.88 MJ.mm.ha-1) (Lince et al., 2016), and Salamina (7,500-10,000 MJ.mm.ha-1) (Ramírez and Hincapié, 2009), coffee growers must implement preventive and corrective measures to mitigate climate effects and to improve soil conditions throughout the year and at all stages of crop growth because, according to Dai et al. (2018), straw mulch decreases soil losses by 81% and bare land (minimum tillage) by 49%.
Table 11. Mean values of the K factor, organic matter (OM), clay (Cl), silt (Si), and sand (Sa) of the soil mapping units representative of the three study municipalities.
| Municipality | Soil Mapping Unit | ERODIBILITY (t.ha/MJ.mm.ha) | n | OM (%) | Cl (%) | Si (%) | Sa (%) |
|---|---|---|---|---|---|---|---|
| Chinchiná | 0.0034 | 22 | 6.54 | 21.59 | 25.91 | 51.82 | |
| Chinchiná-Balboa | 0.0028 | 61 | 6.15 | 24.49 | 25.31 | 50.20 | |
| Balboa | Chinchiná-Catarina | 0.0054 | 33 | 6.64 | 20.97 | 26.00 | 53.03 |
| Parnaso | 0.0035 | 26 | 4.83 | 29.23 | 27.77 | 43.00 | |
| Catarina | 0.0006 | 23 | 6.18 | 25.04 | 26.26 | 48.70 | |
| Santuario | Chinchiná | 0.0027 | 21 | 12.25 | 12.86 | 27.90 | 59.24 |
| Chinchiná-Balboa | 0.0016 | 13 | 6.05 | 26.77 | 24.46 | 48.77 | |
| Chinchiná-Catarina | 0.0036 | 65 | 8.92 | 18.62 | 26.37 | 55.02 | |
| Chuscal-Tablazo-Chinchiná | 0.0099 | 20 | 6.18 | 22.60 | 28.10 | 49.30 | |
| Salamina | Tablazo-Chuscal-Chinchiná-Pácora | 0.0113 | 44 | 5.75 | 23.64 | 29.68 | 46.68 |
| Tablazo-Maiba-Chuscal | 0.0098 | 58 | 6.13 | 21.79 | 29.21 | 49.00 | |
| Tareas-Chuscal-Chinchiná | 0.0114 | 5 | 6.28 | 18.00 | 31.60 | 50.40 |
OM: organic matter; Cl: clay, Si: silt, Sa: sand.
Coffee-growing soil vulnerability to climate variability-SVCV
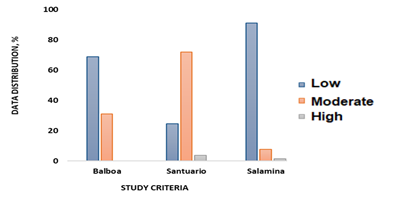
On average, the coffee-growing soil vulnerability to climate variability was low in the municipalities of Balboa and Salamina (3.33 and 3.45, respectively) and moderate in Santuario (3.09). In Balboa, the data distribution was clustered in the low index, tending towards the moderate index, in Salamina in the low index, and in Santuario in the moderate index, tending towards the low index and with decreased data representativeness in the high index. Therefore, in the three municipalities, coffee growers must implement practices towards improving soil resilience and decreasing soil vulnerability to climate change (Figure 5).
CONCLUSIONS
Analyzing soil vulnerability to climate variability by considering the most relevant properties in land specifically used for coffee growing made it possible to identify where mitigation actions should be focused.
In this study, the data distribution of parameters and indices made it possible to define the difference of the coffee-growing in the three regions towards vulnerability levels and to identify whether it is generalized.
Based on the results from this study, the coffee-growing area in the municipality of Salamina has the lowest SVCV, whereas Santuario has the highest vulnerability and should therefore implement measures towards mitigating such vulnerability. Such measures should specifically aim to increase the soil water storage capacity and maintain the content of bases, particularly focusing on K and Mg because these elements show the highest losses from leaching.
Although the municipalities of Salamina and Balboa showed a low SVCV, the parameters of soil water storage capacity and soil management should be strengthened together.

