


 English (pdf)
 Article in xml format
 Article references
 Send this article by e-mail
 Cited by SciELO
  Cited by Google
  Similars in
SciELO
Similars in
SciELO  Similars in Google
 Permalink
INTRODUCTION
Planosols occupy 130 million hectares in the world and are present in regions of subtropical and tropical climate where there is alternation between dry and rainy seasons (IUSS Working Group WRB, 2015; Blake et al., 2016). In Brazil, they cover an area of 226,559.96km2 (Santos et al., 2011), mainly in the southern region, in the Pantanal, and in the northeast region (12). In northeastern Brazil, they are located in the Caatinga biome, comprising 78,500km2 (10.5% of the semi-arid region), and are used with pasture and rainfed annual crops (Marques et al., 2014; Jarbas et al., 2012).
Planosols are imperfectly or poorly drained mineral soils, whose color shows signs of periodic water stagnation and have a sandier surface horizon. These features make them contrast with the immediately underlying B horizon, which, besides being denser, has a higher clay content and has limited water permeability (IUSS Working Group WRB, 2015; Blake et al., 2016; Santos et al., 2018).
The natural vegetation that grows in Planosols is composed of grasses with surface roots and tolerant to waterlogging. For the same climatic condition, they are less used than other soil classes. Extensive pasture and flooded rice are the most prominent uses (IUSS Working Group WRB, 2015). Limitations to plant roots in Planosols are attributed to lack of oxygen, densification, and low fertility (Himmelbauer et al., 2010; IUSS Working Group WRB, 2015; Yu et al., 2013; Meng et al., 2016; Bortoluzzi et al., 2017).
The presence of the planic B horizon causes physical limitations in Planosols, but there are variations in the depth of occurrence of this horizon. The planic B is deeper in places with higher rainfall (Ferreira et al., 2016) or even in places whose microrelief favors a greater depth. Depending on the depth of occurrence of the planic B, the clay increment can act as a water reservoir during the dry period; as a result, the roots are free of excess water, which would favor plant development in the semi-arid region. Increases of approximately 2% in moisture were observed in Planosols when comparing the surface with the subsurface layers (Yu et al., 2013).
Among the most planted crops by farmers in the Brazilian semi-arid region are maize (Zea mays L.) and cowpea (Vigna unguiculata L. walp). Maize roots in the semi-arid region reach 30cm deep, while cowpea roots reach up to 40cm (Himmelbauer et al., 2010; Sousa et al., 2013; Dube et al., 2014). If these species are grown in Planosols, where the top of the B horizon occurs at a greater depth, the risks of damage to the roots due to lack of oxygen will be lower.
From a chemical point of view, there are Planosols in Brazil with low aluminum contents (Júnior et al., 2010; Ferreira et al., 2016), so the greatest chemical limitations are attributed to the low levels of organic matter, phosphorus, and exchangeable bases. However, in a semi-arid region there may be problems with salinity (Ferreira et al., 2016).
In this study, it is assumed that Planosols with greater depth of occurrence of the B horizon have physical and chemical attributes that favor plant development more than those with lower depth. The objectives of the study were: (a) to characterize two adjacent Planosols in the semi-arid region of Ceará, evaluating the depth of occurrence of the planic B horizon and (b) to comparatively analyze physical attributes of the A and planic B horizons of the Planosols studied, seeking to identify potentialities and limitations to plant development.
MATERIAL AND METHODS
Location of soil profiles. The study was carried out in Pentecoste (Ceará, Brazil) where the climate is BSw ́h ́ type, hot and dry, with an average temperature of 26.6°C and average annual precipitation of 817.7mm (Rodrigues et al., 2008).
We evaluated two adjacent soil profiles named P1 (3o49’7.679” South latitude and 39o21’20.209” West longitude) and P2 (3o49’7.484” South latitude and 39o21’18.523” West longitude). Both soil profiles were located at an altitude of 86 meters above sea level. The regional relief is slightly undulated. In a local scale, the slope is 1 to 2%, characterizing a flat relief. The geological formation is Precambrian and the lithology is characterized by the presence of gneiss. Stoniness and rockiness are absent in the studied area where sheet erosion and poor soil drainage were observed.
Characterization of soil profiles. The soils were drilled with an auger and differences were observed in their effective depths: one area with occurrence of a deeper B horizon and another with an occurrence of a shallower B horizon. A soil pit was opened in each area to evaluate the profiles P1 and P2. Horizons were defined in each profile based on morphological evaluation with descriptions of color (determined in moist samples using Munsell chart), structure (according to type, size and the development degree), consistency (determined in dry, moist and wet samples), and transition between horizons (Santos et al., 2013). Additionally, the root systems were visually evaluated according to roots thickness and amount in the soil profiles (Santos et al., 2013).
In disturbed soil samples collected in the horizons of each profile, chemical characterization was performed according to the methods described in Teixeira et al. (2017): Calcium carbonate equivalent (CaCO3Eq), values of pH (H2O and KCl), electrical conductivity (EC), and the contents of Ca2+, Mg2+, Na+, K+, Al3+, H++Al3+, N, P, and organic carbon (OC) were determined. Additionally, the values of organic matter (OM), sum of bases (SB), C/N ratio, cation exchange capacity (effective and potential CEC), base saturation (V%), aluminum saturation (m%), and exchangeable sodium percentage (ESP) were calculated.
For physical characterization, analyses were performed according to the methods described in Teixeira et al. (2017). Disturbed soil samples were analyzed for particle size (total sand - TS, coarse sand - CS, fine sand - FS, silt and clay), water-dispersible clay (WDC), and degree of flocculation (DF). Soil profiles were classified according to the Brazilian Soil Classification System (Santos et al., 2018).
Comparative analysis of physical attributes. In the Ap and planic B horizons (Btf) of each profile, undisturbed samples were collected in volumetric rings with four replicates and analyzed for bulk density and porosity (total porosity, macroporosity and microporosity), according to the methods described in Teixeira et al. (2017). Disturbed samples were analyzed for gravimetric moisture (Teixeira et al., 2017).
Soil penetration resistance (PR) was determined in undisturbed soil samples. These samples were subjected to 100cmH2O tension and, after stabilization at the tension, resistance measurements were performed in the geometric center of the rings using a static electronic penetrometer (Marconi MA-933). The values obtained in kgf were converted to MPa (Tormena et al., 1998).
Statistical analysis of the physical attributes considered a completely randomized split-plot design. The two profiles P1 and P2 were evaluated in the plots, while the Ap and Btf horizons were evaluated in the subplots, with four replicates. The data were subjected to analysis of variance (ANOVA) and Tukey test at 5% probability level in SISVAR software (Ferreira, 2014).
RESULTS AND DISCUSSION
Characterization of soil profiles. The sequence of horizons in P1 was Ap, E1, E2 and Btf with clear and irregular transition between E2 and Btf (Table 1). In P2 the sequence of horizons was Ap, 2Btf1, 2Btf2, 2Btf3 with clear and irregular transition between Ap and Btf1 (Table 1). Profile P2 had stony layer with the presence of gravels and cobbles distributed along the 2Btf2 horizon (Figure 1A and Figure 1B). The surface horizons (A) in P1 and P2 showed brown-olive colors of 2.5Y hue, with value 4 and chroma 6 (Table 1).
Table 1. Morphological characteristics of profiles P1 and P2 studied in Pentecoste (Ceará, Brazil).
| Horiz.1 | Z2 | Color | Structure | Consistency | Transition | |||
| (cm) | Moist | Mottles | Dry | Moist | Wet | |||
| -----------------------------------------------------Profile P1--------------------------------------------------- | ||||||||
| Ap | 0-20 | 2.5Y 4/3 | 1 VF F M SB | SH | VFr | NPl NSt | Cf | |
| E1 | 20-39 | 2.5Y 4/4 | 1 2 VF F M SB | SH | VFr | NPl NSt | Gf | |
| E2 | 39-62 | 2.5Y 5/6 | 7.5YR 5/8 | 2 F M SB | H | VFr | NPl NSt | Ci |
| Btf | 62-110+ | 2.5Y 5/4 | 2.5YR 4/8 | VH | Fi | Pl St | ||
| -----------------------------------------------------Profile P2--------------------------------------------------- | ||||||||
| Ap | 0-18 | 2.5Y 4/3 | 2 F M SB | H | Fr | SlPl SlSt | Af | |
| 2Btf1 | 18-50 | 2.5Y 5/4 | 2.5YR 4/8 | VH | Fi | VPl VSt | Cw | |
| 2Btf2 | 50-60 | 2.5Y 5/4 | 2.5YR 4/8 | VH | Fi | VPl VSt | Cw | |
| 2Btf3 | 60-110+ | 2.5Y 6/6 | 2.5YR 4/8 | VH | Fi | VPl VSt | ||
1Horizons of the soil profiles. 2Depth of the horizons. Structure: 1: weak; 2: moderate; VF: very fine; F: fine; M: medium; SB: subangular blocky. Consistency: SH: slightly hard; H: hard; VH: very hard; VFr: very friable; Fr: friable; Fi: firm; Sl: slightly; Pl: plastic; St: Sticky; N: non; V: very. Transition: Af: Abrupt and flat; Cf: Clear and flat; Gf: Gradual and flat; Ci: Clear and irregular; Cw: Clear and wavy. Obs.: The structure of the B horizons was not determined because they were wet.
Profile P1 had a thicker A horizon (20cm) and greater effective depth (62cm) due to the presence of E1 and E2 horizons (Table 1, Figure 1A). On the other hand, P2 had a less thick A horizon (18cm), besides the absence of E horizon (Table 1, Figure 1B), characterizing lower effective depth, because the planic B, which can constitute a ‘pan’ horizon (Santos et al., 2018), is immediately below A.
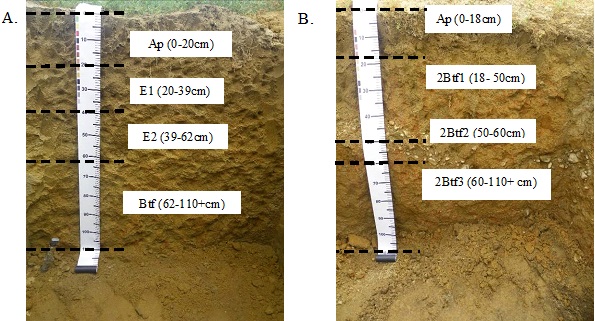
Figure 1. Depth of occurrence of horizons in profiles P1 (A) and P2 (B) studied in Pentecoste (Ceará, Brazil).
The E1 and E2 horizons described in P1 are characterized by being subsurface mineral horizons in which there was removal or segregation of mineral and organic colloidal material (Santos et al., 2018). This type of horizon usually precedes the planic B horizon (Btf) found in Planosols (Santos et al., 2018). The argilluviation or lessivage, gleization, and ferrolysis certainly contributed to the formation of E horizon in P1 (Blake et al., 2016; Quénard et al., 2011; Kämpf and Curi, 2012).
The B horizon in both profiles showed signs of low water permeability due to the presence of mottles (Table 1, Figures 1A and 1B). Mottles indicate low aeration and impediment of drainage, requiring additional drainage to enable the production of most crops (Sharma et al., 2013). The mottles were more pronounced in P2 (Table 1, Figure 1B), suggesting greater restriction to drainage.
The greater effective depth in P1 suggests better potential of this profile for agricultural use due to greater water permeability, lower restriction to root development, and lower susceptibility to erosion. Considering the depth of the root system of maize (Z. mays) and cowpea (V. unguiculata) crops, ranging from 30 to 40 cm under semi-arid conditions (Himmelbauer et al., 2010; Souza et al., 2013; Dube et al., 2014), the effective depth of P1 (62cm) indicates better conditions for plant development.
Profile P2 showed morphology indicative of lithological discontinuity, with probable contribution of material transported from the higher positions, especially due to the presence of gravels in the 2Btf2 horizon (Figure 1B). This is an aspect of the formation of Planosols in a semi-arid region, in which the natural vegetation with little biomass (Sampaio et al., 2010) favors the transport of materials.
Profile P1 had lower hardness and greater friability (Table 1) in most horizons as a result of its higher amount of sand with regards to P2 (Table 2). In P2, the superior clay amount was responsible for the greater manifestation of cohesion and adhesion forces compared to P1 (Table 2). Thus, P2 had greater cohesion, plasticity and stickiness from the first horizons, which represents greater limitation for soil turning operations.
Table 2. Physical attributes for characterization of soil profiles P1 and P2 located in Pentecoste (Ceará, Brazil).
| Horizons | Particle Size3 | ||||||||
| Symb1 | Z2 | TS | CS | FS | Silt | Clay | WDC | DF | Silt/Clay |
| --cm-- | -------------------- g kg-1--------------------- | -%- | |||||||
| ----------------------------------------Profile P1------------------------------------- | |||||||||
| Ap | 0-20 | 85.6 | 41.2 | 44.5 | 7.9 | 6.5 | 2.3 | 64.2 | - |
| E1 | 20-39 | 84.4 | 52.5 | 31.9 | 7.8 | 7.8 | 3.9 | 49.6 | - |
| E2 | 39-62 | 81.9 | 43.9 | 38.1 | 8.1 | 9.9 | 5.1 | 48.6 | - |
| Btf | 62-110+ | 71.1 | 37.4 | 33.8 | 7.3 | 21.6 | 11.1 | 48.5 | 0.3 |
| -----------------------------------------Profile P2------------------------------------ | |||||||||
| Ap | 0-18 | 78.9 | 28.1 | 50.9 | 8.7 | 12.3 | 5.6 | 54.1 | - |
| 2Btf1 | 18-50 | 45.9 | 20.1 | 25.9 | 11.2 | 42.8 | 20.4 | 52.3 | 0.3 |
| 2Btf2 | 50-60 | 42.8 | 29.1 | 13.8 | 13.0 | 44.1 | 19.7 | 55.3 | 0.3 |
| 2Btf3 | 60-110+ | 31.3 | 18.5 | 12.9 | 24.9 | 43.8 | 6.2 | 85.8 | 0.6 |
1 Symb: symbol of the horizons; 2 Z.: depth of occurrence of the horizons; 3 Hydrometer method; TS: total sand; CS: coarse sand; FS: fine sand; WDC: water-dispersible clay; DF: degree of flocculation.
According to the Brazilian Soil Classification System (Santos et al., 2018), the two profiles studied showed abrupt textural change between E2 and Btf in P1 and between Ap and 2Btf1 in P2 (Table 2). The clay increment in P2 was more pronounced (30.5g kg-1), while P1 had lower percentages of clay in its horizons and less accentuated clay increment in subsurface (11.7g kg-1) (Table 2).
The particle-size composition of P2 analyzed by the textural triangle gives this soil a more clayey texture, with clay concentrated mainly in the 2Btf1, 2Btf2 and 2Btf3 horizons, which contained 42.8, 44.1 and 43.8% of clay, respectively (Table 2). The increment of clay in subsurface gives these profiles greater water retention and storage, which can be beneficial for agricultural crops in the dry season, but also represents greater risks of excess water in the rainy season.
Water-dispersible clay (WDC) increased with depth in P1 (Table 2), probably due to the increment of clay. In P2, the highest WDC values occurred in 2Btf1 and 2Btf2, followed by a decrease in subsurface (Table 2). The higher values of WDC occurring in planic horizons are related to smectic mineralogy and higher levels of Na+ in the sorption complex (Oliveira et al., 2003). Therefore, the more active the clay fraction, the greater the dispersion (Van Lier, 2010).
Regarding the chemical attributes, both profiles showed acidity, tending to the acid reaction in subsurface in P1. In P2, the moderate reaction was directly related to the depth, and the greatest increase was observed at the top of 2Btf3 (Table 3).
In P1, the levels of exchangeable Ca2+ and Mg2+ ranged from 0.7 to 1.7 and from 0.2 to 0.5cmolc kg-1 of soil, respectively, with an increase in Btf compared to the overlying horizon (Table 3). In P2, the levels of exchangeable Ca2+ and Mg2+ were higher (1.9 to 2.3 and 0.4 to 4.9cmolc kg-1, respectively) than those found in P1, maintaining the increase in subsurface (Table 3). The Ca2+ + Mg2+/K1+ ratio was equal to 11 in the A horizon of P1 and 7.7 in P2, being interpreted as medium and low in P1 and P2, respectively (Sousa and Lobato, 2004).
Table 3. Chemical attributes for characterization of soil profiles P1 and P2 located in Pentecoste (Ceará, Brazil).
| Horiz1 | Z2 | pH (1:2.5) | EC3 | Ca4 | Mg4 | Na5 | K5 | SB8 | Al4 | H+Al6 | T7 | t7 | |||||
| --cm-- | H2O | KCl | dSm-1 | -----------------------------cmolc kg-1----------------------------- | |||||||||||||
| ------------------------------------------Profile P1-------------------------------------- | |||||||||||||||||
| Ap | 0-20 | 5.9 | 4.8 | 0.38 | 1.7 | 0.5 | 0.2 | 0.2 | 2.6 | 0.3 | 0.8 | 3.4 | 2.9 | ||||
| E1 | 20-39 | 4.4 | 3.8 | 0.10 | 0.7 | 0.2 | 0.2 | 0.2 | 1.3 | 0.8 | 1.1 | 2.4 | 2.1 | ||||
| E2 | 39-62 | 4.4 | 3.7 | 0.10 | 0.7 | 0.2 | 0.2 | 0.2 | 1.3 | 1.2 | 0.9 | 2.2 | 2.5 | ||||
| Btf | 62-110+ | 4.7 | 3.8 | 0.11 | 1.6 | 0.3 | 0.2 | 0.2 | 2.3 | 0.8 | 1.0 | 3.3 | 3.1 | ||||
| ------------------------------------------Profile P2-------------------------------------- | |||||||||||||||||
| Ap | 0-18 | 4.8 | 4.2 | 0.43 | 1.9 | 0.4 | 0.2 | 0.3 | 2.8 | 0.4 | 1.8 | 4.6 | 3.2 | ||||
| 2Btf1 | 18-50 | 5.1 | 4.3 | 0.11 | 2.7 | 2.3 | 0.3 | 0.2 | 5.5 | 0.5 | 1.7 | 7.2 | 6.0 | ||||
| 2Btf2 | 50-60 | 5.5 | 4.6 | 0.12 | 2.5 | 2.9 | 0.4 | 0.3 | 6.1 | 0.4 | 1.2 | 7.3 | 6.5 | ||||
| 2Btf3 | 60-110+ | 5.8 | 5.1 | 0.13 | 2.3 | 4.9 | 0.4 | 0.2 | 7.8 | 0.3 | 0.9 | 8.7 | 8.1 | ||||
| Horiz1 | Z2 | V9 | m10 | ESP11 | CaCO3Eq12 | C13 | N14 | OM15 | C/N | P5 | |||||||
| --cm-- | ----------%--------- | -------------------g kg-1------------------ | mg kg-1 | ||||||||||||||
| ------------------------------------------Profile P1-------------------------------------- | |||||||||||||||||
| Ap | 0-20 | 76.5 | 10.3 | 5.9 | 27.0 | 3.0 | 0.3 | 5.2 | 10.0 | 2.6 | |||||||
| E1 | 20-39 | 54.2 | 38.1 | 8.3 | -- | 1.6 | 0.3 | 2.8 | 5.3 | 0.9 | |||||||
| E2 | 39-62 | 59.0 | 48.0 | 9.1 | -- | 1.5 | 0.1 | 2.6 | 15.0 | 1.2 | |||||||
| Btf | 62-110+ | 69.7 | 25.8 | 6.1 | 25.0 | 3.1 | 0.0 | 5.3 | - | 1.3 | |||||||
| -----------------------------------------Profile P2-------------------------------------- | |||||||||||||||||
| Ap | 0-18 | 60.9 | 12.5 | 4.3 | 25.5 | 8.5 | 0.2 | 14.7 | 42.5 | 3.3 | |||||||
| 2Btf1 | 18-50 | 76.4 | 6.9 | 4.2 | 24.8 | 4.7 | 0.1 | 8.2 | 47.0 | 0.8 | |||||||
| 2Btf2 | 50-60 | 83.6 | 6.2 | 5.5 | 25.2 | 5.0 | 0.1 | 8.7 | 50.0 | 3.9 | |||||||
| 2Btf3 | 60-110+ | 89.6 | 3.7 | 4.6 | 25.5 | 4.1 | 0.1 | 7.0 | 41.0 | 1.6 | |||||||
1Horizons of the soil profile. 2Depths of the horizons. 3Electrical conductivity of the saturation extract.4 Calcium (Ca2+), magnesium (Mg2+) and aluminum (Al3+) extracted with 1 mol L-1 KCl and quantified by atomic absorption spectrometry (Ca2+ and Mg2+) and by titration with 0.025 mol L-1 NaOH (Al3+); 5Potassium (K+), sodium (Na+) and phosphorus (P) extracted by Mehlich 1 and quantified by flame photometry (K+ and Na+) and by spectrophotometry (P); 6Potential acidity (H++Al3+) extracted with calcium acetate at pH 7.0 and quantified by titration with 0.025 mol L-1 NaOH; 7Potential (T) and effective (t) cation exchange capacity; 8Sum of bases; 9Base saturation. 10Aluminum saturation. 11Sodium percentage in CEC. 12Calcium carbonate equivalent. 13Organic carbon oxidized by 0.167 mol L-1 potassium dichromate solution in concentrated sulfuric acid; 14Total nitrogen by the Kjeldahl method; 15Organic matter obtained by multiplying organic carbon by the Van Bemmelen factor (1.724).
In P2, there was a predominance of the Mg2+ ion compared to Ca2+ from 2Btf2, with an increase in subsurface (Table 3), which has already been observed in other Planosols of the semi-arid region (Jacomine et al., 1973; Oliveira et al., 2003; Ferreira et al., 2016). This can be explained by the mineralogy of the parent material (gneiss), rich in ferromagnesian minerals such as biotite (Rebertus et al., 1986). However, as the highest levels of Mg2+ are found in the subsurface, it is still necessary to pay attention to the availability of this nutrient in surface, where there will be a greater amount of roots of cultivated plants.
Profile P1 showed higher SB (2.6cmolc kg-1) in the A horizon, with a reduction in the values in E1 and E2 (1.3cmolc kg-1), increasing in Btf (2.3cmolc kg-1). In P2, the SB values increased in subsurface, from 2.8 cmolc kg-1 in A horizon, reaching 7.8cmolc kg-1 in Btf3 (Table 3). In both profiles: Ca2+ and Mg2+, the cations were the ones that contributed the most to the sum of bases (Table 3).
Base saturation (V%) was higher than 50% in P1 and P2, characterizing the soils as eutrophic (Table 3). This is an advantage for plant development, provided that there are no other limiting factors. There are reports of the occurrence of dystrophic Planosols in Brazil (Silva Neto et al., 2015; Júnior et al., 2019), but eutrophic Planosols like those found in this study have been described in the semi-arid region (Ferreira et al., 2016).
Potential CEC and effective CEC (T and t) were higher in P2 (Table 3), but only P1 had a higher value in the A horizon (3.4cmolc kg-1), followed by lower values in E1 and E2, increasing again in Btf. The increase of CEC in the subsurface horizons of the two profiles is related to the increasing clay contents in subsurface (Table 2). Increase in CEC with depth in Planosol was observed by Nyssen et al. (2019), who associated it with the increase in clay content.
Organic carbon contents in both profiles were lower than 10 g kg-1 (Table 3). Low contents of organic carbon are consistent with the semi-arid conditions, which result in low supply of organic residues to the soil and favor the rapid decomposition of organic matter (Oliveira et al., 2003; Sampaio et al., 2010; Nyssen et al., 2019). P2 had higher carbon content than P1, and both profiles showed a reduction in carbon in subsurface, except for the horizons Btf1 of P1 and 2Btf2 of P2 (Table 3). The higher carbon contents in P2 are related to its higher percentage of clay (Table 2) because soil organic matter interacts with the surface of minerals, ensuring greater stability due to colloidal protection (Rumpel and Kögel-Knabner, 2011).
Aluminum activity increased in P1 due to the lower pH in subsurface and decreased in P2 (Table 3). The increase in aluminum activity in P1 deserves attention, as the chemical conditions in subsurface can become inadequate for plant roots. ESP was higher than 6% in P1 from 20cm depth in the E1 and E2 horizons (Table 3), which explains the increase in WDC in subsurface (Table 2). Attention should be paid so that this value does not increase further, as ESP greater than or equal to 15% indicates problems with sodicity (Richards, 1954).
Phosphorus (P) contents were low, reaching 2.6 and 3.3mg kg-1 in the Ap horizon of P1 and P2, respectively, representing a chemical limitation for plant development in both profiles. Emphasis is given to Planosols in relation to phosphorus deficiency in the semi-arid region, even when they develop under different environmental conditions (Silveira et al., 2006; Ferreira et al., 2016).
According to the Brazilian Soil Classification System (Santos et al., 2018), P1 was classified as PLANOSSOLO HÁPLICO Eutrófico solódico and P2 as PLANOSSOLO HÁPLICO Eutrófico típico.
Comparative analysis of physical attributes. There was interaction (P<0.01) between profiles and between horizons for microporosity and moisture (Figure 2A and 2B). Microporosity did not differ between profiles in the Ap and Btf horizons or between horizons in P1 (Figure 2A). However, in P2, Btf had higher microporosity (35.1%) than Ap (18.8%) (Figure 2A).
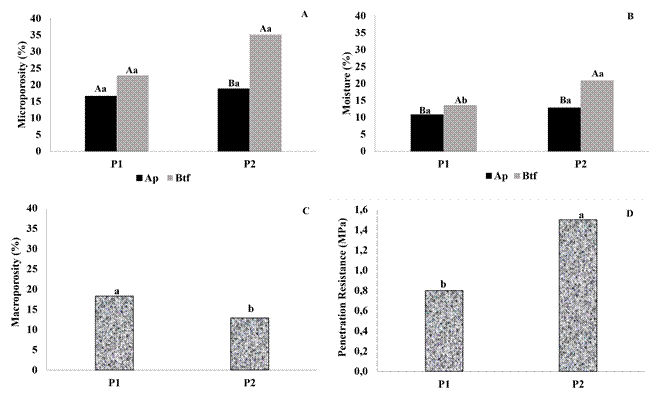
Figure 2. Microporosity (A), moisture (B), macroporosity (C) and penetration resistance (D) as a function of soil profiles (P1, P2) and horizons (Ap, Btf). Lowercase letters compare means of profiles (P1, P2) in each horizon. Uppercase letters compare means of horizons (Ap, Btf) in each profile.
Microporosity is important in soil water retention and storage (Van Lier, 2010). Soil moisture did not differ between profiles in the Ap horizon, but there was a difference in Btf (Figure 2B). Btf in P2 retained 7.3% more water than Ap; in P1, this difference was only 2.7% (Figure 2B), which is consistent with the increase of 2% observed by Yu et al. (2013).
It is possible to relate the higher moisture to the higher microporosity, and this, in turn, to the more clayey texture, with P2 being more effective in water storage than P1. However, due to the occurrence of rainfall, the physical attributes of P2 hinder the infiltration and percolation of water, causing the more pronounced mottles in this profile (Table 1, Figure 1B).
In rainfed farming in the semi-arid region, the capacity of the soil to store water is important to ensure harvests (Martínez and Lampurlanés, 2006). However, this effect can be harmful if the predominance of subsurface micropores in Planosols leads to waterlogging during the rainy season or if the development of plant roots is hampered.
Macroporosity and penetration resistance (PR) responded to the single factors soil profiles and horizons (P<0.01). Soil bulk density and total porosity (Pt) responded only to the soil horizons factor (P<0.01). In the response of macroporosity as a function of soil profiles, P1 had higher value (18.3%) than P2 (12.9%), while PR was lower in P1 (0.8MPa) and higher in P2 (1.5MPa) (Figure 2C and 2D).
As the mechanical resistance to penetration is related to moisture, bulk density and pore distribution in the soil (Van Lier, 2010), porosity served as an indication that P2 would have greater resistance to penetration. However, despite reaching high values of penetration resistance, the evaluated soils did not exceed the critical limit of 2 MPa. Values of soil resistance to penetration exceeding 2 and 3 MPa were considered critical by Colombi et al. (2018), reducing root growth and water absorption by maize plants.
As for the responses as a function of soil horizons, bulk density and penetration resistance were higher in Btf, reaching 1.7g cm-3 and 1.6MPa, respectively (Figure 3A and 3B). Thus, in both profiles, Btf has bulk density values close to that considered limiting to root growth (1.6g cm-3) (Liu et al., 2015). As Btf occurs from 62cm in P1, this soil has considerable thickness and better physical conditions for plant development. The opposite occurs with P2, whose Btf starts already in the 18cm layer.
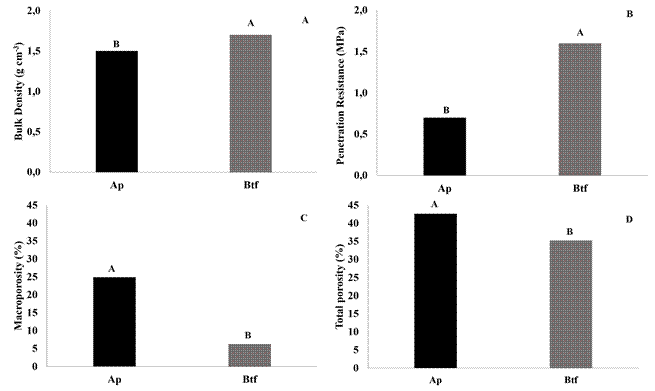
Figure 3. Bulk density (A), penetration resistance (B), macroporosity (C) and total porosity (D) as a function of soil horizons (Ap and Btf). Uppercase letters compare means between soil horizons.
Macroporosity and total porosity were higher in Ap, with values of 18.3 and 42.6%, while in Btf the values of macroporosity and total porosity were 12.7% and 35.2%, respectively (Figure 3C and Figure 3D). Depending on the use and management employed in this soil, changes in porosity may affect negatively or positively other physical attributes. A Planosol used as pasture in the Brazilian semi-arid region showed reduction in total porosity from 38 to 36%, leading to an increase in bulk density from 1.6 to 1.7g cm-3 and an increase in penetration resistance from 1.5 to 2.25 MPa, which is limiting for the root development of plants (Batista et al., 2019). On the other hand, a Planosol submitted to mechanical amelioration methods in China presented 10 to 14% of reduction in soil bulk density (Meng et al., 2016).
CONCLUSIONS
The common limitations between P1 and P2 were increased bulk density in the planic B and low contents of organic carbon and phosphorus. The common potentialities were the eutrophic character and penetration resistance less than 2MPa.
The specific limitations of P1 were higher acidity, higher aluminum content, and higher sodium percentage in CEC, while the potentialities were greater effective depth and lower limitation to soil turning.
The specific limitations of P2 were lower effective depth, more limited drainage, and greater limitation to soil turning, while the potentialities were lower content of aluminum and lower sodium percentage in CEC.

