


 Inglés (pdf)
 Articulo en XML
 Referencias del artículo
 Enviar articulo por email
 Citado por SciELO
  Citado por Google
  Similares en
SciELO
Similares en
SciELO  Similares en Google
 Permalink
INTRODUCTION
One of the challenges facing the agricultural sector is trying to understand the diagnosis of current agroecosystems. The evaluation of sustainability arises as an alternative that allows a holistic view of the state of the production systems. For this reason, some specialists such as Astier et al. (2008); Sarandón (2002); Ilasaca et al. (2018) have designed evaluation methodologies that allow you to see the evolution of agrosystems so that the farmer, as well as the researcher and extension worker, can determine the state and thus carry out adequate planning, monitoring, and any necessary follow-up requirements.
To evaluate the sustainability of agrarian systems with a systemic approach, it is necessary to develop methodologies that reflect the social, economic, and environmental sense of belonging of the various alternatives regarding the management of production systems. Authors like Rendón (2004) and Lovell et al. (2002) indicate that the evaluation is centered at the farm level because it is in this area where the limitations to agricultural production are clearly expressed. Therefore, these methodologies allow for addressing and interpreting the most relevant technical, ecological, and social networks of agroecosystems (Guzmán & Alonso, 2007).
One way to diagnose the state of the agricultural system is the creation of indicators from qualitative and quantitative assessments and methodologies based on the determination of a sustainability index in which the information of the indicators is synthesized into a single numerical value (Veza, 2012, Macario et al., 2013). These indicators and indices provide a clear idea of each system, with the goal of maintaining or improving productivity, reducing risks and uncertainty, and increasing ecological and social services without reducing the economic viability of the system (Sarandón, 2002; Veza, 2012; Cerfontaine et al., 2014).
Coffee cultivation in Colombia covers 584,122 ha in 600 municipalities in 22 departments (FNC - Federación Nacional de Cafeteros, 2019) of which 63% are in direct sunlight and the rest are a shade or semi-shaded coffee systems (FNC - Federación Nacional de Cafeteros, 2019). The traditional coffee system increased due to inadequate management practices such as intensive monocultures in hillside areas and agrochemicals overuse, leading to socioeconomic and environmental problems (Loaiza et al., 2014; Machado & Ríos, 2016).
In this research, the coffee production systems were typified and the variables that positively or negatively affected each agroecosystem were determined. Subsequently, a minimum set of variables (CMV) was selected, which were standardized, weighted, and integrated into a General Environmetal Sustainability Index (IGSA). This Index allowed people to establish criteria to compare and evaluate the sustainability of the coffee systems and fill information gaps that reflect the social, economic, and environmental relevance, allowing them to make adequate decisions that recognize and strengthen good agroecological practices that lead to the sustainability of the systems that give way to productive coffee growers.
MATERIALS AND METHODS
The study was carried out in the municipality of La Unión, located at an altitude between 900 and 2,200m above sea level, with a temperature of 19ºC, precipitation of 2,116.6mm, solar irradiance of 4.9h/day, and relative humidity of 82.5%. The study site is located at 1º36’ and 06’’ North latitude and at 77º00’ and 15’ West longitude (Alcaldía Municipio de La Unión, 2012).
To evaluate the sustainability of coffee production systems, attributes were integrated into the social, economic, and environmental dimensions and the pillars on which the concept of sustainable development is based were also considered. The population is made up of 104 farmers, whose production systems meet the following characteristics: - located between 1,400 and 1,800 meters above sea level, preferably the same established coffee variety, older than two years, and planting density of more than 2,500 coffee plants per ha.
Previous information on the farm classification was considered to identify the coffee production systems, according to Ordóñez-Jurado (2014) and Ordóñez-Jurado et al. (2019). Therefore, the coffee production systems were gathered into 4 groups: the coffee system with woody shade trees (S1), semi-shade coffee (S2), the coffee system associated with Musaceae, especially plant coffee (S3), and full-sun coffee plants (monocrop) (S4).
A number of field visits were made to compare the information that forms each cluster and four farms were randomly selected for each production system, which made for a total of 16 coffee farms.
The determination of the environmental, economic and social indicators are the product of the review of research done in the agricultural sector, especially in the coffee-growing sector and the consultation of experts in the cultivation of coffee at a regional and national level, such as Farfán (2010), Velásquez (2007) and Sepúlveda (2002).
Additionally, the environmental variables were measured within the coffee plots through specific methodologies and samplings for each indicator while the economic indicators were calculated based on direct costs. On the other hand, the indicators of the social dimensions were taken directly in each farm through the application of a semi-structured survey and a review of bibliographic sources of the coffee sector.
From the set of pre-selected variables, a minimum set of variables (MSV) was chosen, which allowed the construction of an indicator for each production system. This process was performed by using multivariate statistical procedures and taking into account the nature (continuous and categorical) of the variable. Likewise, a principal component analysis (PCA) and multiple correspondence analysis (MCA) were applied.
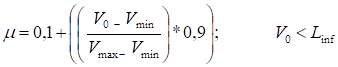
Since the variables pre-selected as CMV presented values in different units, it was necessary to standardize them, assigning a value “between 0 and 1”, according to formulas or property functions, equation (1), equation (2), and equation (3), as indicated by Velásquez (2007), Doran (2002), Sepúlveda (2002) and Farfán (2010).
 (1)
(1)
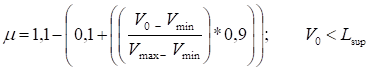 (2)
(2)
 (3)
(3)Μ = Degree of belonging; the value that the variable takes between 0 and 1.
Vo = The calculated value of the variable
Vmin = Minimum value assigned to the variable.
Vmax = Maximum value assigned to the variable.
(1). Function to apply when the variable has a positive relationship.
(2). Function to apply when the variable has a negative relationship.
(3). Function to be applied when the variable is within the optimal or adequate ranges.
This sense of belonging of functions is applied if the variable has a positive or negative relationship with the stability of the system. If an increase or decrease in the value of the variable results in a benefit for the system, a positive relationship (+) is considered. On the contrary, if an increase or decrease in the value of the variable is not beneficial for the system, there is a negative relationship (-). For the application of the equations it was necessary to assign minimum values (Vmin), maximum (Vmax), and optimal ranges (OR) as applied by Farfán (2010), López-Ridaura et al. (2002) and Moreno et al. (2006).
The estimated data (μ) for the four farms that constitute each production system was averaged for each variable and the integration of these values formed the environmental, economic, and social sub-index.
The comparison of the sustainability of the production systems was conducted by using the AMOEBA diagram, a graph constructed from the values established for each indicator (Brink et al., 1991).
The GSI (General Sustainability Index), was constructed by the contribution of each variable, thus a multivariate statistical analysis of PCA was performed on the CMV in order to estimate the contribution of each variable within the set of indicators. The first components were selected based on the contribution of total inertia; therefore, the commonalities were taken as indicated in equation (4).
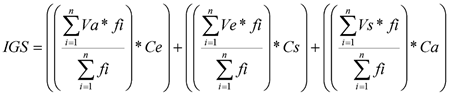 (4)
(4)GSI = General Sustainability Index.
Ve = Economic variables.
Vs = Social variables.
Va = Environmental variables (variable weight).
fi = Variable weighting factor.
n = Number of economic, social and environmental variables.
The Coefficient for the group of variables is Ca (Environmental Coefficient), Ce (Economic Coefficient), and Cs (Social Coefficient).
To perform sustainability qualifications for each coffee production system, the index was determined with the information obtained, and the "Biogram of Environmental Sustainability" was constructed (NESTLE NESPRESSO, 2007), which goes on a scale from 0 to 1, distributed in five rating intervals (Table 1).
RESULTS AND DISCUSSION
To select CMV (Table 2), used in assessing the sustainability of coffee production systems, a multivariate principal component analysis (PCA) was applied to the environmental and economic variables and multiple correspondence analyses (MCA) were performed on the pre-selected variables, for those related to the social dimension. In the environmental variables, everything up to component three was considered. In the economic variables, everything up to component two, and in the social variables, everything up to component 4 was included.
The variables that were selected were the ones that by their own value or weight presented the highest values; according to the components determined by the variability explained in each dimension (economic, social, and environmental). The information resulting from this statistical analysis was socialized and complemented by experts in coffee cultivation, specially the importance of these variables that by their nature are directly related to the stability of these agroecosystems. According to the above, the minimum set of variables to evaluate the sustainability of coffee production systems was made up of 21 variables as indicated in Table 2.
Table 2 The minimum set of variables (CMV) to evaluate the sustainability of coffee carbon production systems.
| Selected Variables (CMV) | ||
|---|---|---|
| Environmental | Economic | Social |
| Woody species richness | Coffee production @ c.p.s ha-1 year-1 | Community project impact |
| Weed species richness | Coffee rating @ c.p.s ha-1 | Administration and farm decisions |
| Woody floristic diversity | Production cost ha-1 | External input dependency |
| Macrofauna diversity | Cost-benefit ratio | Family integration participation |
| Leaf litter thickness | Gross margin ha-1 | Food produced system |
| Organic material | Fertilizer costs | Community organization participation |
| Carbon | Coffee cherry / c.p.s ratio | Coffee grower self-esteem |
Table 3 shows the transformed variables of the CMV. The comparison of the productive systems is presented in Figure 1 (AMOEBA method). It was found that in the shaded coffee system the maximum and minimum data correspond to the variables MF (0.95) and MB (0.20), the semi-shaded coffee system presented a minimum value of 0.30 (IC) and the maximum corresponds to the MF variable with 0.89. In the coffee system associated with plants, the variable with the lowest value is CI (0.10), and the highest corresponds to MF with 0.89. In the coffee system without shade, the values of the set of variables fluctuate between 0.16 and 0.73; CI and RA being the lowest. Therefore, the highest and lowest values of the evaluation will have the greatest incidence in the final IGSA (Acevedo & Angarita, 2013).
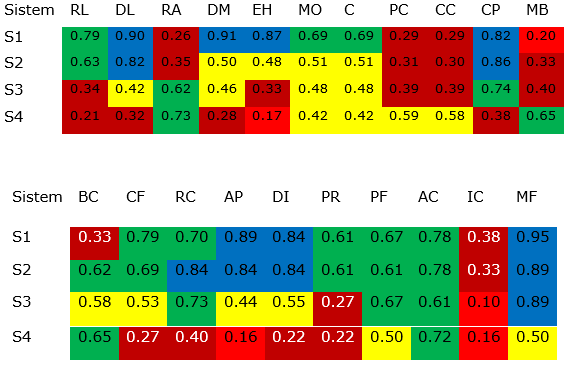
Shade coffee (S1), semi-shade coffee (S2), plantain coffee (S3), and shadeless coffee (S4).RL: Woody species richness, DL: Woody floristic diversity, RA: Weed species richness, DM: Macrofauna diversity, EH: Leaf litter thickness, MO: Organic matter, C: Carbon, PC: Coffee production, CC: Coffee qualification, CP: Crop budgets, MB: Gross margin, BC: Benefit/Cost Ratio, CF: Fertilizer costs, CR: Coffee cherry/cps ratio, AP: System produced food, DI: Input dependency, PR: Organizations participation, PF: Family integration participation, IC: Impact of the community project, AC: Coffee farmer self-esteem and FM: Administration and decision-making on the farm.
Table 3 Minimum set of transformed variables, coffee production systems La Unión, municipality of Nariño.
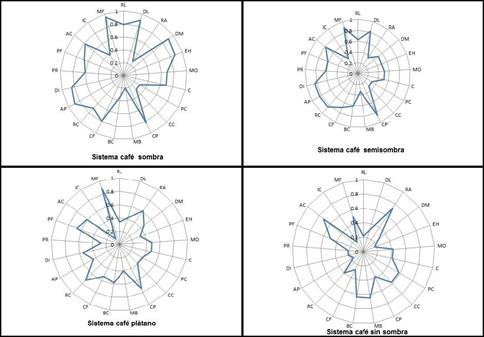
Figure 1 Diagram constructed with variables: environmental, economic, and social factors of the Coffee production systems.
In the diagram of Figure 1, the results of the comparison of the sustainability of the four coffee production systems evaluated are presented. The greatest weakness (very critical) of the coffee with shade systems was MB variables. It presents optimal sustainability in seven of the twenty-one variables: DL, DM, EH, CP, AP, DI, and MF. The semi-shadow coffee system does not present variables with very critical weakness, being the variables: DL, CP, RC, AP, DI, and MF rated as optimal. The coffee plant association had the greatest weakness in IC and MF, considered optimal. Finally, the coffee system with direct sunlight had weakness in the variables EH, AP, and IC, which were considered very critical in terms of sustainability.
The coffee systems that use associated species either as shade or scattered in space and time tend to be sustainable in the management, conservation of natural resources, and in the environment. All of these because they provide additional food products, stability of the soils, as well as biodiversity. Furthermore, as indicated by the Rainforest Alliance (2004), they are important in the provision of ecosystem services. In like manner, socially, there is a greater integration of the family with the farm and community.
The results found in this research agree with studies completed by Cárdenas (2007), Arias-Giraldo & Camargo (2007), and Duarte (2013), who indicated that ecologically oriented agricultural systems present high levels of environmental and social indexes and lower levels of economic indicators; therefore, the ecological farms analyzed tend to lean towards sustainability.
On one hand, The PCA showed that the first four components contribute 83.70% of the total inertia and as a result the commonalities were taken up to these four components.
On the other hand, Table 4 and Table 5 show the results of the PCA for the weighting, the communalities, the associated vectors, and the coefficients for each group of variables.
Table 4 Results of the Principal Component Analysis (PCA) for the weighting of the groups of variables.
| Component | Own Value | Difference | Percentage | Accumulated percentage |
|---|---|---|---|---|
| 1 2 3 4 5 | 10.3377 3.8386 2.1715 1.2285 0.9165 | 6.4991 1.6671 0.9450 0.3120 0.1827 | 49.23 18.28 10.34 5.85 4.36 | 49.23 67.51 77.85 83.70 88.06 |
Table 5 Communalities for the groups of variables were environmental, economic, and social and the coefficient for each group.
| Variable | Communality | Variable weight | Coefficient Variables group | |
|---|---|---|---|---|
| Environmental | DL | 0.90374 | 0.05142 | 0.33654 |
| RL | 0.97380 | 0.05540 | ||
| RA | 0.65216 | 0.03710 | ||
| DM | 0.63245 | 0.03598 | ||
| EH | 0.94469 | 0.05375 | ||
| MO | 0.90399 | 0.05143 | ||
| C | 0.90434 | 0.05145 | ||
| Economic | PC | 0.96994 | 0.05518 | 0.34770 |
| CC | 0.97062 | 0.05522 | ||
| MB | 0.95278 | 0.05421 | ||
| BC | 0.81713 | 0.04649 | ||
| CP | 0.93815 | 0.05338 | ||
| CF | 0.74757 | 0.04253 | ||
| RC | 0.71510 | 0.04069 | ||
| Social | AP | 0.88922 | 0.05059 | 0.31576 |
| DI | 0.91974 | 0.05233 | ||
| PR | 0.83505 | 0.04751 | ||
| PF | 0.68680 | 0.03908 | ||
| AC | 0.78641 | 0.04474 | ||
| IC | 0.67984 | 0.03868 | ||
| MF | 0.75282 | 0.04283 | ||
Estimated community 17.57634
With the previous values, the subscripts were calculated for the following dimensions: environmental, economic, and social, and the integration of these forms the GSI.
The coefficients of the variables ranged between 0.35 and 0.31, with no notable differences. On the other hand, Duarte (2013) found values with broader ranges in the evaluation of the sustainability of the groups of coffee producers in the department of Huila, through sustainability indicators. The sub-indices output was: economic (0.37), social (0.41), and environmental (0.22). Similarly, Farfán (2010) reported that physical variables were (0.28), chemical variables were (0.58) and biological variables were (0.14) in the evaluation of the environmental sustainability of coffee production systems in three localities in the Colombian coffee zone, using soil quality indicators.
The degree of development of each production system is on a scale from 0 to 1, distributed in five rating intervals. With the information obtained here, the sustainability Biogram was constructed as indicated in Table 6 and Figure 2, a tool that allowed assessing the sustainability of the coffee systems of the municipality of La Unión.
Table 6 Assessment of the sustainability of coffee production systems.
| Coffee production system | Dimension | Average | ||
|---|---|---|---|---|
| Environmental | Economic | Social | ||
| S1 | 0.25 | 0.16 | 0.23 | 0.65 |
| S2 | 0.19 | 0.19 | 0.23 | 0.60 |
| S3 | 0.15 | 0.18 | 0.16 | 0.49 |
| S4 | 0.12 | 0.18 | 0.11 | 0.41 |
Shade Coffee (S1), Semi-shade coffee (S2), Plantain coffee (S3), Shadeless coffee (S4)
When comparing the four coffee production systems, using the GSI, it was found that the indices for the group of environmental variables fluctuated between 0.12 and 0.25, the lowest value was obtained by the groups identified as coffee without shade and the highest by the group of systems with shade coffee.
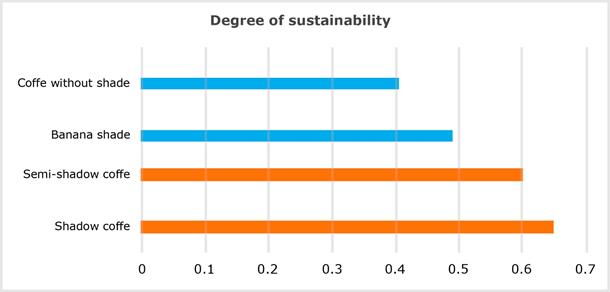
Figure 2 The scale for qualifying the degree of sustainability for coffee production systems, municipality of La Unión Nariño.
The index for the group of economic variables fluctuated between 0.16 and 0.19. The lowest value of the indicator was obtained by the farms that handle shade coffee and the highest value for the semi-shade coffee production system, a similar case is reported by Duarte (2013), who found that the partial index of the group of economic variables fluctuated between 0.11 and 0.22. Their lowest value was obtained by the groups of producers dedicated to the production of conventional coffee and the highest value for the indicator was obtained by the group composed of coffee growers of sustainable production.
The group’s index of social variables ranged between 0.11 and 0.23. The lowest value for the indicator was obtained by the group of the coffee system without shade and the highest by the groups of shade coffee and semi-shade coffee.
The results of the qualification of the sustainability index constructed with the sets of environmental, economic, and social variables indicate that the coffee under shade system with a qualification of 0.649 and semi-shade coffee with 0.601, is located in the category of good sustainability. According to the assessment scale, the systems for coffee without shade and coffee plant, with values of 0.405 and 0.490 respectively, are located as systems in a low average state of sustainability. Farfán (2010) indicated that the qualifications are very close to those of the immediately superior category and that the necessary agronomic practices should be implemented to increase the degree of sustainability to high sustainability.
The behavior of these indices, present some similarity with the results of Duarte (2013) when evaluating and comparing through a general index, the degree of sustainability of 66 associations of coffee producers, located in the department of Huila. The highest value reached within the groups under study was the one in which the majority of its members are certified under the Fair Trade and Rainforest Alliance initiatives, with (0.53), and the lowest to the group of conventional coffee producers who contribute little to the construction of sustainability with 0.25.
The production systems for direct sunlight coffee and coffee plants, with regular sustainability, are a reflection of classical practices such as the use of pesticides and herbicides that contribute to the contamination of soil and water, reduce biodiversity and the quality of the coffee, and result in loss of production due to infestation of pests or diseases increasing production costs and external dependence as stated by Wilson & Tisdell (2001).
By analyzing the records, especially the environmental dimension, we can establish exactly what contributed to the regular assessment of the shade-free coffee and banana coffee systems. Altieri & Nicholls (2007) and Perie & Munson (2000) indicated that in these agroecosystems, most of the activities are controlled by the farmer through the use of chemical supplies, which has a negative impact on beneficial species of insects and on soil variables and causes a decrease in ecological interactions.
Small producers, as is characteristic in the study area for those who manage shaded and semi-shaded coffee systems on their farms, pay more attention to the variables of the environmental dimension, which they can control, and are also interested in other products for self-consumption and sometimes the ones for sale. Also, they are more concerned about the well-being of the soil and water, as stated by Duarte (2005) and Valkila (2009). They are less dependent on chemical supplies and this changes into economic advantages for small coffee growers and may reflect greater sustainability.
CONCLUSIONS
With the integration of the most representative and feasible indicators to evaluate the environmental, economic, and social dimensions and the determination of the General Sustainability Index (GSI), it is possible to make comparisons to identify the variables that contribute to the decrease in sustainability, which should be subject to improvement based on action plans. Likewise, a substantial positive change in the key factors that make up the sustainability of small and medium-scale coffee production systems should be sought.
The results of the qualification of the sustainability index built with the sets of environmental, economic, and social variables indicate that the coffee system under shade and semi-shade is located in the category of good sustainability. The full-sun coffee and plantain coffee systems, according to the assessment scale, are considered systems with low sustainability.

