


 English (pdf)
 Article in xml format
 Article references
 Send this article by e-mail
 Cited by SciELO
  Cited by Google
  Similars in
SciELO
Similars in
SciELO  Similars in Google
 Permalink
INTRODUCTION
The study of biotic and abiotic factors and their incidence in the movement of grazing animals has been on board in the scientific literature from empirical and statistical approaches (Bailey & Provenza, 2008). The interaction of an animal with biotic and abiotic factors within a habitat determines complex behaviors, making it necessary to study them under different environmental variability conditions. Thus, the variability of the elements conditions animal-behavior factors in extensive systems, operating at different spatial level scales, plant, patch, plant community, landscape, and region.These elements are closely related to the daily activities of the animal individually and in groups (Bailey & Provenza, 2008).
In particular, grazing actions are influenced by environmental conditions and the body response of animals. Hence, these are strongly influenced by the heterogeneity and diversity of ecological conditions, especially the vegetation available in time and space (Laca, 2010; Bailey & Provenza, 2008). When a cattle producer does not consider this heterogeneity and, therefore, does not adapt the load or foresee the differentiated grazing of the pasture, overgrazing of preferred sites occurs, affecting the growth and productivity of pastures.
There is little information on modeling herbivore behavior of cattle in tropical climate zones in South America. The few studies conducted in this area are limited to the works carried out by Mora-Delgado et al. (2016); Mora-Delgado et al. (2018); Polanía et al. (2013).
These studies describe animal behavior patterns and cycles associated with the heterogeneity and distribution of biotic and abiotic factors in the habitat. Thus, the study of animal behavior concerning its biological and ecological-environmental bases is a fundamental element in generating useful knowledge for decision-making on managing a livestock system (Polanía et al., 2013; Mora-Delgado et al., 2016). Top site quality indexes (SQI) have been established with the efforts of studies in recent decades, allowing a greater understanding of the factors involved in the spatial and temporal distribution patterns of livestock in their habitat (Brizuela et al., 2015). Moreover, achievements aimed at the implementation of improvements in livestock production have materialized. Animal behavior knowledge is essential to increase production, life quality, conservation possibilities, and any activity that requires management. It also requires increasing information about the ethology of the species involved (Sampedro et al., 2016).
On the other hand, biotic factors such as racial characteristics and the quantity and quality of forages, and abiotic factors associated with slope gradients, climate, and shade shape the habitat and determine or govern animal behavior associated with grazing (Brizuela et al., 2015). These factors determine the grouping and causality between the variables associated with spatial and temporal distribution patterns in the grazing of domestic herbivores. This is fundamental in the ecology of natural resources, their administration, and management to optimize current livestock production.
In this line of work, evaluating the factors available in an agroecosystem constitutes the basis for resource optimization planning in projecting sustainable precision livestock. This basic knowledge is of utmost relevance in silvopastoral systems in which multiple ecological, social, cultural, and economic variables are combined (Ramírez, 2012; Brizuela et al., 2015).
Data compilation on domestic and wild animal movement has been facilitated by technological innovations since these allow researchers to discover patterns of animal behavior at different spatial and temporal scales (Katzner & Arlettaz, 2020; Acácio et al., 2022). High-precision methodologies may have been used in these animal movement evaluations through global positioning georeferencing devices (GPS). Today, the behavior of outdoor livestock (in pastures) can be studied using GPS and geographic information system (GIS) or through tracking and monitoring systems such as XYZ positioning in 3D and 2D spaces with devices to evaluate livestock behavior and other traits at different ages (Mora-Delgado et al., 2016).
These technological systems allow consolidating data on the movement of livestock in grazing activities and carry out comparative analyzes to associate variables and interaction factors in the habitat with the grazing and comfort-seeking activities registered (Davis et al., 2011; Ku-Vera et al., 2014; Mora-Delgado et al., 2016; Mora-Delgado et al., 2018).
Several biotic and abiotic factors seem to be attractants of grazing distributions, such as individual and herd behaviors. Forage availability and shade patches considerably influence herd dispersion patterns and grouping dynamics more than any social dominance effect. Ruminant community distribution is likely related to variability in fodder biomass and ambient temperature fluctuations. This can drive compensatory night-time eating and thermoregulatory activities (Cheleuitte-Nieves, 2011). However, other attractants, such as drinking and salt troughs, also promote grazing distribution (Castilla, 2020).
In the tropical dry forest ecological zone, the Brahman cattle breed shows a greater displacement than the Romosinuano breed. This is possibly due to a better adaptation of the former, allowing a greater capacity for movement in search of food (Mora-Delgado et al., 2018). These results agree with those of Russell et al. (2012), in which Brahman cows traveled longer distances per day during the summer seasons (P = 0.01) than Angus or Brangus cows.
Several studies suggest that the animals have a higher mean displacement in dry seasons related to low forage availability conditions, forcing animals to move further in search of food. Thus, it can be inferred that the Brahman breed is more adapted to tropical conditions than the Romosinuana breed, possibly allowing them to travel larger distances in search of food, especially in dry periods. In subtropical areas from the south of the USA, significant findings have been reported by Brizuela et al. (2015) related to GPS tracking to identify the biotic and abiotic factors that influence forest use patterns by lactating cows with calves between the late winter and early spring period. Studies in other subtropical areas show clear patterns in pasture use. For example, the movement of Namibian cattle was determined by the advance of the dry season and water availability (Polojärvi et al., 2011).
The influence of animal load and meteorological factors on environmental use patterns and found that silvopastoral woodland with abundant understory can play a relevant role in providing shelter for nursing and dry cows (Black-Rubio et al., 2008). Have bean shown the preferences of animals for wooded areas during winter, particularly in years when forage availability is scarce. This indicates that cattle aggregate under trees in the cold season, particularly at night. Typically, there is a lesser spread during the dry season associated with the aggregation of individuals in water and supplemental feeding areas. This behavior may help establish the most critical times for providing supplemental resources and guide allocating resources to areas not frequently used by cattle. In this way, animals are stimulated to visit unused sites during the non-growing season (Cheleuitte-Nieves et al., 2020).
Significative findings emphasize sensors as a valid measurement tool for rumination, eating, and inactivity periods in Holstein calves. These show that a simple regression analysis of sensors against observed activity was significant in rumination, R2 = 0.91; eating, R2 = 0.75, and inactive, R2 = 0.97 (Hill et al., 2017).
Accordingly, in the present work, a study of grazing cattle movement will be carried out as a function of some biotic, pasture productivity and cover, trees, and floristic composition, and abiotic variables, as climatological season and drinking and salt trough, under a silvopastoral system.
MATERIALS AND METHODS
The study was carried out at the farm La Reforma of Centro Universitario Regional del Norte (CURDN), Universidad del Tolima, Colombia, located in the municipality of Armero-Guayabal with geographic coordinates 5°02'41.79"N and 74°53'21.93"W. The farm has a total area of 46ha, in which dual-purpose livestock is developed.
The average annual temperature is 28.2°C, and the relative humidity in the air is 71%. The study area is located at an altitude of 262 meters above sea level and is classified as a tropical dry forest life zone (Holdridge, 1996).
A paddock of 6ha was used as the experimental field (Figure 1). It has flat relief, facilitating mechanization (Aldana, 2008). It has an area of 4 ha with Angleton and Colosuana grass and the presence of herbaceous, shrubby weeds and trees. The area has a great variety of soils, such as expansive clays, loamy-clayey, loamy-sandy, and silt. Most are acid with low fertility and are highly compacted (Aldana, 2008). The soils correspond to Mollisols and Alfisols according to the North American "Soil Taxonomy" system (IGAC, 1995).
To establish the botanical composition of the pasture, an imaginary division of the pasture of 20x20m was created. In each, a 10 m diagonal transect was made with five points of sample, for evaluation. Each of these plots was georeferenced. A 50x50cm side PVC frame was used to establish capacity and botanical composition. Herbaceous component cover, weed proportion, grass height, and bare soil were evaluated in each evaluation. Weeds were collected in presses and transported to the Herbarium of Universidad del Tolima for classification. Dry matter determination of forages was done in an oven at 60°C for 48h.
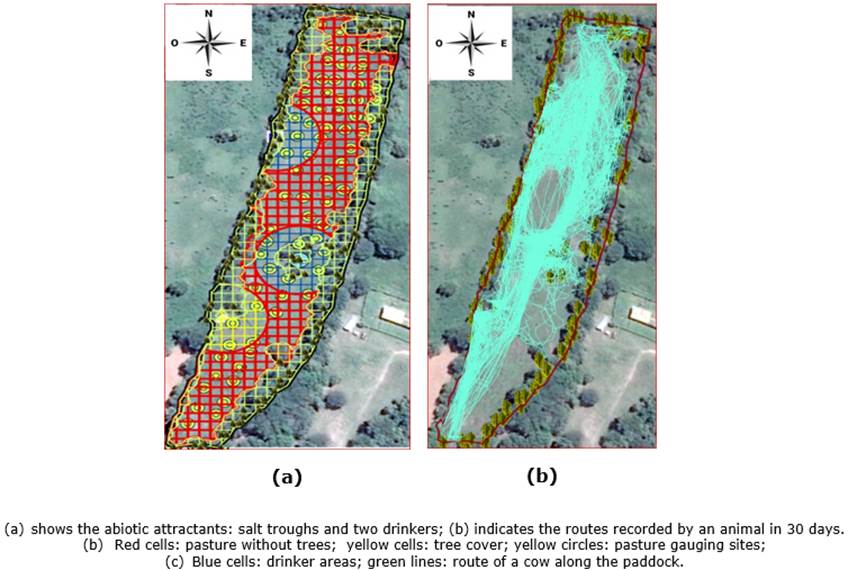
Before the entry of animals into the paddock, a georeferenced and detailed location of every relevant site on the landscape map of the paddock was made (Chambers et al., 1981), including the tree canopy, water supply points, and the salt throughs. Thus, a detailed map of the study area and the location of the activities of animals was elaborated through observation and remote monitoring (Pezo & Skarpe, 2009; Mora-Delgado et al., 2013).
A 10x10m cell grid was overlaid on the satellite image of the paddock using the ArcGIS 10.5 software and plug-ins to determine the movement of animals associated with the biotic and abiotic factors analyzed.
Biotic and abiotic factors
Factors of partial selectivity of grasslands (patches, feeding stations, or pits), access to water and salt, search for comfort areas, distribution of forage, and quality were evaluated, examining correlations between the variables and establishing behavior patterns. The tree canopy in the silvopastoral system was estimated, locating it in the satellite images following the procedure used by Serrano et al. (2014) in a GIS environment. For this, a satellite image from Google Earth (2011) was used.
Cow selectivity for grazing at the patch level concerning the biotic and abiotic traits of the pasture was determined. The quality of the pasture was considered an abiotic trait. For this, previous chemical analysis of the main grass species was performed showing the following bromatological traits: neutral detergent fiber (NDF) = 74.9% ±0.12, acid detergent fiber (ADF) = 39.1% ± 0.97, lignin = 20.80% ± 23.07, ethereal extract (EE) = 1.98% ± 0.24, ash = 9.38% ± 0.65, organic matter (OM) = 90.615% ± 0.66, crude protein (CP) = 5.55% ± 2.2, and in vitro digestibility of dry matter (IVDDM) = 50.2% ± 0.8. Thus, the study assumed that bromatologically, the paddock is homogeneous, for which the concept of spatial variability in pasture quality is given by biomass productivity, cover, and floristic composition. For this, the spatial variability of pasture quality was estimated based on these traits and measured using the PVC frame method of 0.5x0.5m, spaced every 20m along the length and width of the paddock. Data on the proportion (%) of grass cover, bare soil, and weeds were registered in each frame. Also, the amount of green forage (g) and forage height were measured with a graduated ruler (cm). Green forage was cut using manual pruners. The floristic composition analysis was performed in the laboratory. The data were recorded on field forms, and field management equipment such as machetes and binoculars were also employed. With the grass strata field data, a Site Quality Index (SQI) was created based on the following equation (Equation 1.)

Where GF is green forage in g, Cov is herbaceous cover in percentage, Wd is the percentage of weeds, and H is grass height in cm.
Six cows (not pregnant) were randomly selected from a total of 18 animals to monitor animal movement. The cows (three Brahman and three Romosinuano) had an average live weight of 460 kg and were between 34 to 48 months of age. Each animal was collared with a leather device equipped with a GPS (Garmin eTrex Vista) programmed with a recording frequency of 1 minute. Data on the movement, grazing route, and resting activities of each individual in their habitat during daytime hours and throughout the rainy and dry seasons were registered according to Trotter et al. (2010). Moreover, GPS tracking was conducted for 10 hours a day. Thus, two data were recorded over a 30-day period. The data were analyzed in a SIG ambient, operated with the ArcGIS 9.3 software.
Statistical analysis
The effect of biotic and abiotic factors (as disturbing factors) on the movement of two cattle breeds (treatments) was determined using descriptive statistics as central tendency and dispersion measurements. Furthermore, student T-tests, Association tests, and Correspondence Analysis (CA) between traits were performed. Contingency tables analyzed categoric traits, and a Chi-square test operated with the Infostat software was carried out to determine statistical association (Di Rienzo et al., 2015).
RESULTS AND DISCUSSION
The grazing area is characterized as a monophytic community, given the dominance of the grass Dichantium aristatum present in 99% of the sites evaluated, with accompanying vegetation of 13 species, of which two were grasses and 11 were weeds. The species with higher frequency, according to their presence in the gauging sites, were Digitaria bicornis (35%), Mimosa pudica (25%), and Cassia tora (15%). The other species, including Gunnera brephogea, Sida rhombifolia, Guazuma ulmifolia, Eleusine indica, Paspalum notatum, Jussiaca repens L., Petiveria alliacea L., Jussiaca repens L. var. peploid (H.B.K.) Griseb, and Urera baccifera (L.), were present in less than 15% of the sites. The Simpson index ratifies the dominance of a species, in this case, the grass D. aristatum. The closer the value to the unity, the more dominance a species exerts. Hence, the structure denotes a low species diversity in the herbaceous stratum (Table 1).
The forestry component of the system, comprised of 130 individuals, is distributed as a living fence around the paddock and a patch in its center. The abundance indices suggest a low diversity since 75% of the individuals correspond to three species, Pithecellobium dulce (35%), Guazuma ulmifolia (24%), and Maclura tinctoria (29%). The rest of the species, Caesalpinia echinata, Choroleucon bogotense, Tectona Grandes, Gliricidia sepium, Cupania americana, and Zanthoxylum rigidum, are present in less than 10% of the areas.
Table 1 Herbaceous and forestry strata indicators in the studied pasture.
| Herbaceous cover | Average ± SD |
|---|---|
| Cover (%) | 55.6 ± 11.8 |
| Weeds (%) | 6.5 ± 7.7 |
| Total, grass species | 3 |
| Total, forb species | 10 |
| Green forage, dry season (g/m2) | 851.18 ± 498.85 |
| Green forage rainy season (g/m2) | 998.44 ± 737.38 |
| Simpson index | 0.8 |
| Shannon-Weber index | 0.89 |
| Tree cover | |
| Total, trees | 130 |
| DBH (cm) | 70.33 ± 62.9 |
| Height (m) | 13.33 ± 3.66 |
| Estimated crown area (m) | 23.06 ± 31.33 |
| Simpson index | 0.79 |
| Shannon-Weber index | 0.77 |
SD: Standard deviation; DBH: diameter at breast height
Figure 2a illustrates the number of visits in each paddock cell, highlighting that the most visited sites (peaks) correspond to spaces close to attractant factors. Twenty-five cells stand out with more than 1,000 visits, suggesting the incidence of these factors and inferring that the main attractants are the shade, drinking troughs, and salt troughs.
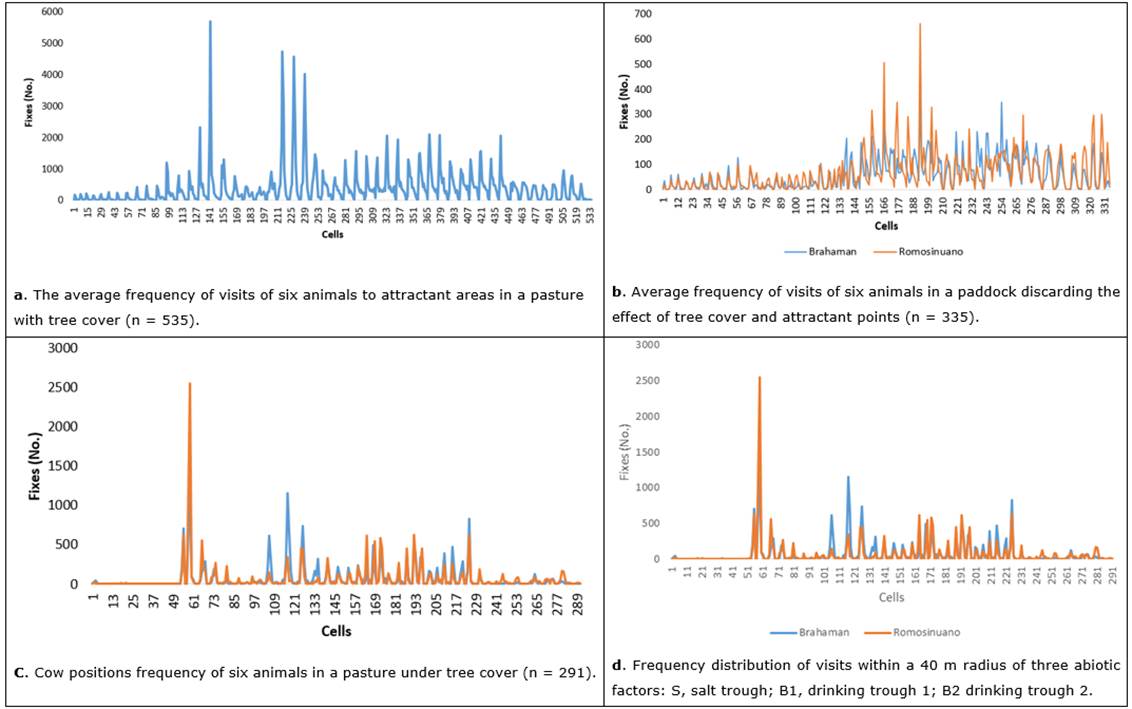
Figure 2 The average frequency of visits of animals to attractant areas in a pasture with tree cover.
A high concentration of visits by animals to cells 141 to 142 was evident, constituting spaces influenced possibly by the proximity of the salting area. In the same sense of proximity to attractive sites, cells 215, 226, and 228 denote a high frequency of visits influenced by drinking source B1, and points 324, 335, 368, and 378 are concentration sites adjacent to drinking source B2. Points 402, 304, and 293 (adjacent to the right border) and 420 and 440 (flanking the left border) are due to preferences for sites near the shade of trees.
Figure 2b represents the highest frequency fixes of the two cattle breeds, ruling out the effect of shadow. The graph denotes six points with the most significant influx of animals. The difference in visits between the cattle breeds is relevant (cells 138 to 269), suggesting selectivity differences at the patch scale. This selectivity possibly relates to the spatial quality of the forage. However, it must be clarified that this site quality is determined by biomass productivity, cover and the floristic composition of the pasture. These variables were considered in the SQI (Figures 9 and 10) as spatial variability determinants, given the relative homogeneity of the pasture in bromatological terms.
The distribution of the most visited cells indicates preference points. Thus, the most visited points are close to attractant points (drinking and salt troughs). It is evident that other factors determine the influx of animals, possibly related to the spatial quality of the pasture.
The position frequency of cows in the shady system (n = 291) allowed identifying the most frequented areas around the seven relevant peaks (Figure 2c). The graph shows four high animal influx attractive zones due to the proximity of two water sources and the salting area. Besides, four other fixes' concentration areas are evident. One of these is located on the eastern boundary of the paddock due to other attractive effects, possibly derived from the shadow quality projected by the canopy of the tree component.
Representations of the influence of abiotic factors on the movement of animals can be seen in Table 2. Significant differences were identified in the area surrounding attractants between the average number of visits for the B1 and B2 drinkers and the salting area. However, when the concentration of visits was analyzed, it was evident that the Kurtosis statistics suggest a higher frequency for those visits located around the distribution mean in the surroundings of the salt trough. Therefore, the Kurtosis statistics indicate what is pointed out (higher concentration) in the distribution bell (Leptokurtic, g 2> 3), compared to B2 (Platykurtic, g2 <3), in which the bell was more flattened (lower concentration). Further, B also has a high concentration but is lower than S.
Table 2 Descriptive statistics of animal visits influenced by attractant abiotic factors.
| Sites | Number of data | Mean | SD | Min | Max | Asymmetry | Kurtosis |
|---|---|---|---|---|---|---|---|
| B1 | 66 | 2 | 2 | 0 | 11 | 3 | 6 |
| B2 | 40 | 3 | 2 | 0 | 8 | 1 | 0 |
| S | 48 | 2 | 3 | 0 | 19 | 4 | 19 |
SD: standard deviation; B1 and B2: drinking troughs; S: salting pond.
The graph suggests a positive skew for B1 and S, with a larger tail in the data from the latter site, indicating that the mean is bigger than the mode. In practical terms, this means that few cells concentrate most of the data, affecting the average. Only B2 has a negative asymmetry, suggesting that the mean will be lower than the median.
The graphs in Figures 2d y Figures 3 suggest that S has the highest concentration of cow visits since 50% are concentrated in 14% of cells. However, it shows the same proportion of data in 17% and 15% of the cells for B1 and B2, respectively.
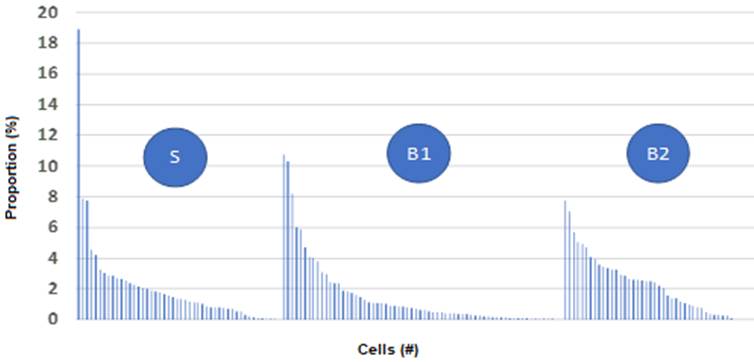
Figure 3 Kurtosis graphs of grazing animal visits to a salting pond (S) and two drinking troughs (B1 and B2).
Forage availability
Table 3 shows forage availability during 30 days of grazing for animals in the dry and wet seasons. The data suggest a high value given the high standard deviation value. However, the coefficient of variation indicates that the average is representative in each capacity. The higher consumption of forage in the dry season is striking since the difference between the initial and residual capacity after a month of grazing was 21.9 and 19.2 g/m2, respectively, in the dry and wet seasons.
Table 3 Green and residual forage production (g/m2) after 30 days of grazing in two seasons (dry and wet).
| Capacity | Residual | Capacity | Residual | |
| Dry season | Dry season | Wet season | Wet season | |
| Average (g/m2) | 851.2 | 191.8 | 998.4 | 421.1 |
| SD (g/m2) | 498.9 | 49.9 | 737.4 | 151.1 |
| CV (%) | 58.6 | 26.0 | 73.9 | 35.9 |
| Q1 | 500 | 160 | 528 | 330 |
| Q2 | 720 | 180 | 730 | 400 |
| Q3 | 1,055 | 240 | 875 | 500 |
| Q4 | 3,000 | 340 | 3,000 | 700 |
SD: standard deviation; CV: coefficient of variation; Q1-Q4: Quartiles
Of the 68 gauged sites analyzed based on the distribution frequency of forage production (g/m2), it was inferred that the largest proportion of the pasture presented low productivity. This distribution of frequencies served to define four classes according to the ranges of productivity in the dry season, i.e., sites of low (B <900 g/m2), medium (M <1,600 g/m2), high (A <2,300 g/m2) and very high (MA >2,300 g/m2) productivity. A higher proportion of sites (65%) with low productivity was found, followed by medium productivity sites (28%) and those with high pasture productivity (6%). Those with very high productivity only represent 1.5% of the area. The graphs in Figure 4 show that the low productivity class predominates in the pasture in the dry and wet seasons.
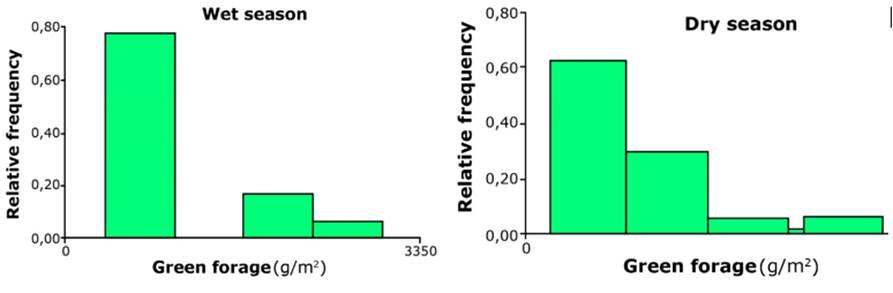
The four classes established according to pasture productivity presented statistically significant differences (p <0.05) between the green forage production averages, as shown in Figure 5A. Part 5B shows a projection at the
paddock level to analyze animal grazing distribution. The predominance of low and medium pasture productivity in the dry season was evident.
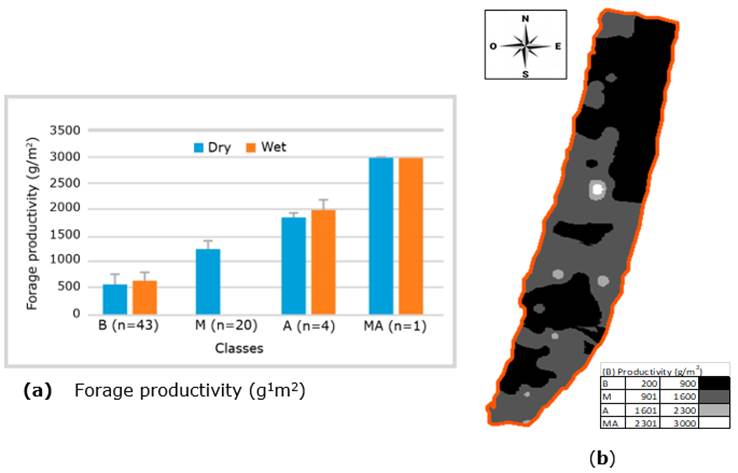
Figure 5 Fodder productivity (g/m2) class in the dry and wet seasons. B: low; M: medium; A: high; MA: very high.
Pasture productivity and animal movement
When relating the productivity classes of green forage with the number of animal visits, the highest number of positions recorded with the GPS devices corresponds to the medium productivity sites (M), with statistical differences in the dry season between medium (M) and high (A) productivity sites. This suggests that the productivity factor of sites is not by itself a determining factor in the movement decisions of the animals (Table 4). Forage availability in each category (A, M, B, and MA) is related to grazing frequency, as well as to floristic and botanical compositions and forage cover in all categories. This relation can be expressed in an SQI.
Table 4 Relationships between pasture productivity (g/m2) and animal movement.
| Average | EE | Fixes (No.) | % | |
| Wet season | ||||
| B | 670.75a | 2.83 | 48,501 | 52.6 |
| M | 1081.4b | 3.01 | 42,848 | 46.5 |
| A | 1,819.69c | 23.58 | 699 | 0.8 |
| MA | 2,617.07d | 51.07 | 149 | 0.2 |
| Dry season | ||||
| B | 717.98a | 0.69 | 40,749 | 46.3 |
| M | 1,069.92b | 0.65 | 46,410 | 52.7 |
| A | 1,802.64c | 5.38 | 678 | 0.8 |
| MA | 2,596.01d | 10.74 | 170 | 0.2 |
Different letters in the same column indicate significant differences (Fisher, p <0.05). Pasture productivity (g/m2): B: low; M: medium; A: high; MA: very high. EE: Error
Site quality index
Table 5 suggests that the SQI areas with medium productivity (M) were the most visited in all seasons (wet and dry). Notably, more than half of the animal visits were made to the M areas, possibly because these have the largest surface area in the whole spatial unit of analysis. The least visited places have very high (MA) and high (A) productivity, given their limited extension. However, it must also be considered that in the tropical region, there are other priority decision drivers for animal movement, such as quenching thirst. This could be why there was a high permanence of the animals surrounding the drinking troughs and satiating hunger, and, therefore, the surroundings of the salting areas were also highly visited.
Table 5 Relations between the Site Quality Index (SQI) of the pasture and animal movement according to the season.
| SQI | Average | EE | Fixes No. | % |
| Wet season | ||||
| B | 7.3a | 0.02 | 22,704 | 24.6 |
| M | 19.08b | 0.01 | 53,830 | 58.4 |
| A | 27.07c | 0.02 | 11,729 | 12.7 |
| MA | 34.99d | 0.04 | 3,934 | 4.3 |
| SQI Dry season | ||||
| B | 8.38a | 0.02 | 21,953 | 24.9 |
| M | 18.25b | 0.01 | 55,366 | 62.9 |
| A | 27.47c | 0.03 | 7,085 | 8.1 |
| MA | 34.34d | 0.05 | 3,603 | 4.1 |
Means with a common letter are not significantly different (p >0.05). SQI (Site Quality Index): B, low; M, medium; A, high; MA, very high. EE: error
In Figure 6, four of the six highest peaks of animal visits coincided with SQI spaces classified as high and the other two with a medium SQI. In the latter, the visit attractor for animals may be an abiotic factor, such as the proximity to one of the drinkers.
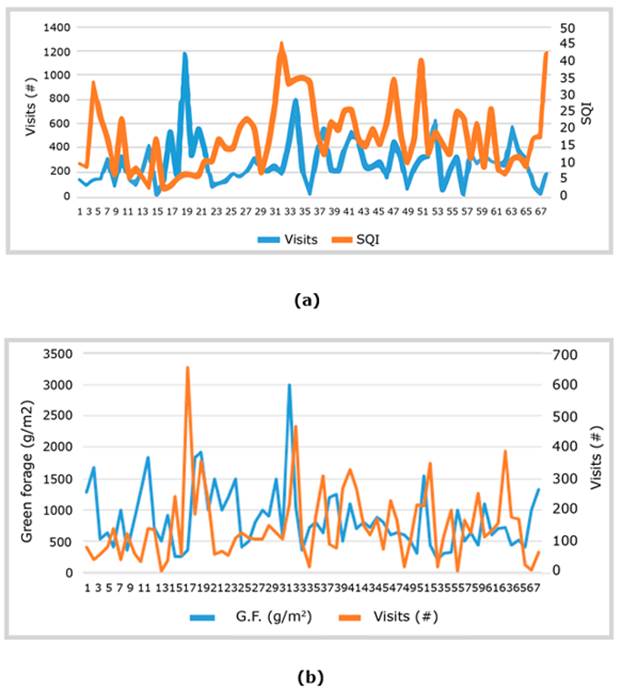
Figure 6 Relations between the movement of animals (a) Site Quality Index (SQI) and (b) Green Forage (G.F.) production around the gauging sites.
Correspondence analysis (CA)
When analyzing in a double-entry contingency table, the positions of the animals in different pasture productivity areas with respect to different areas classified with the SQI in the hue of frequencies relative to the total, the highest proportion (88%) of animal positions are located in the low (25%) and medium (63%) areas according to the SQI. In correspondence, 99% of the animal positions are located in areas classified with low (46%) and medium productivity (Rows). Pearson (0.29) and Kramer's (0.15) coefficients suggest an association between productivity and SQI, given a p-value <0.000.
This association could be verified with the correspondence analysis (CA). In the biplot graph of Figure 7, the first two dimensions of the simple CA of the contingency table corresponding to the crossing of variables "SQI" and "Productivity" are displayed. The graph suggests, in its first axis (69.37% of inertia), that the areas of low SQI (B <13.4) are related to the areas of low productivity (B_prod <900 g/m2) and that the medium SQI areas (M = 13.5-24) correspond to medium productivity areas (M_prod = 901-1,600 g/m2).
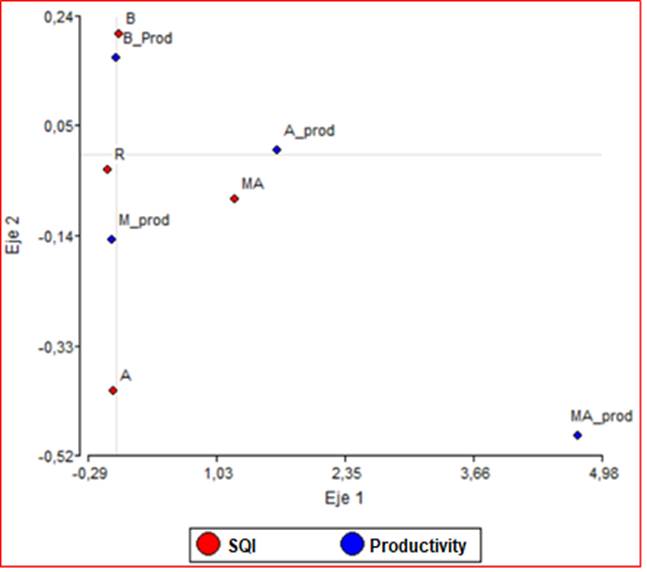
Figure 7 Biplot illustrating the relationships between animal positions according to the productivity categories and site quality index (SQI) of the pasture. B_prod: low productivity, M_prod: medium productivity, A: high productivity, MA: very high productivity, B: low, M: medium, and A: high, MA: very high
The data suggests coincidences between animal movement and the categories that characterize pasture within the framework of landscape heterogeneity. In this regard, the literature reports that grazing fields are characterized by the existence of contrasting sites depending on the type of vegetation and edaphic or topographic characteristics within the same management unit (i.e., a pasture), which promotes the use of heterogeneous grassland by combining grazing sites with different degrees of attraction for livestock (Golluscio et al., 1999; Cibils & Coughenour, 2001; Ormaechea & Peri, 2015). The movement of animals and the selectivity by grazing sites could be determined by the bromatological quality of the forage and its relationship with the satiety hypothesis of Bailey & Provenza (2008). However, the effect of this factor was not analyzed in this work due to the homogeneity of the bromatological indicators found in the sampling system used along the paddock.
This knowledge constitutes the basis for smart grazing systems since attractants have significant potential in extensive systems. The strategically located attractive feature could induce the animals to graze in areas surrounding these sites. In some cases, it has been possible to beneficially modify the distribution of the animals (Bailey et al., 2001; Bailey & Welling, 2007; Bailey & Jensen, 2008; George et al., 2008), while in other cases, the achievement was partial (Ganskopp, 2001; Goulart et al., 2008). In other studies, the effectiveness depended on the type of attractive item provided (Bailey & VanWagoner, 2004).
The high presence of animals was notorious in places close to the water or salt consumption access points. For some authors who have studied the biotic and abiotic factors that influence grazing distribution, the most critical attractive element would be water since the animals prefer to be near the watering holes in the hottest hours, possibly because under high temperatures, the priority of the animal is to save energy to invest in transfer activities to the hydration site (Polanía et al., 2013). It is evident that the decision hierarchy of the animals prioritizes eating, looking for shade, or drinking water (Polanía et al., 2013). This hierarchy was explained 30 years ago. Thus, the choice of activity is controlled by the state of four physiological criteria: heat stress, thirst, hunger, and darkness fall (Stafford-Smith, 1988).
The prioritization of activity selection or site target has one or more trigger levels. In this sense, if a thirst or heat load trigger is dominant, the animal will move towards water or the nearest shade, respectively. The animal will move to the nearest night-time site if the darkness triggers are dominant. When hunger is dominant, the animal will graze. If a site target is reached, the cattle remain there until some other trigger becomes dominant (Stafford-Smith, 1988).
Abiotic factors such as distance to water troughs and slope constitute the main drivers of grazing distribution patterns reported at larger scales. Areas located far away from water sources and on steep slopes are less used than closer sites; thus, animal movement may be motivated by seeking access to a water source or avoiding adverse weather conditions. Nevertheless, abiotic restrictions must be combined with responses resulting from biotic factors, such as forage quality, to predict grazing (Bailey & Provenza, 2008).
The effects of the location of watering troughs are well known, but they have not been quantified. Although access to this resource may be more critical than the forage quality, studies show that animals tend to be close to a water source (Herrera, 2018). Some studies mention that the distance is no more than 4 km, although access to minerals can also influence grazing distribution (Polanía et al., 2013; Mora-Delgado et al., 2018).
The distance to the water source determines the selection of grazing sites. Animals prefer to be near these because long-distance displacement increases energy expenditure due to a larger amount of time allocated to the transfer (Charnov, 1976). The scientific literature reports the performance of different breeds, mainly during the summer, in sectors close to a water source, implying, in the first place, the greater dependence on a water source during this season (Brew et al., 2011).
Some studies report that the areas with a high frequency of visits near drinking and salt troughs simultaneously coincide with low-quality and low-productivity sites, as reported by Herrera (2018). This author found that the grazing area called "Peladal" is the closest to the water and has the lowest pasture productivity due to higher foraging pressure. In contrast, the site with the highest grass availability, both in summer and winter, received little use by animals, explained by its distance from the water source (Herrera, 2018)
The same study reports that the spatial distribution of animals shows slight differences in the selection of communities between breeds. Thus, this is consistent with the more significant time a cow spends moving in search of forage, in contrast to another that dedicates less displacement time and more time to grazing. This could be because an individual responds to the lower availability of forage by increasing grazing time (Herrera, 2018).
In terms of location according to cover, cattle behavior is possibly related to the food available. This was confirmed with a higher frequency of visits by animals to areas with low and intermediate tree cover (<20% and ≥20<40%, respectively), where the availability of dry matter/ha was significantly higher. A tendency to reduce animal visits is evident as available dry matter decreases and is the inverse of tree cover (Polanía et al., 2013).
The daily activities of small ruminants also showed no significant differences between treatments. These usually dedicate a higher proportion of their time to grazing when the availability of forage quantity or quality is low (Polanía et al., 2013; Mora-Delgado et al., 2018).
Although statistically, no differences were found in animal visits to grazing sites, some authors suggest that larger temporal scales, such as interannual climate variation, also influence the spatial distribution of small ruminant grazing patterns. Fundamentally, this is due to changes in pasture availability and quality (Owen, 2008). Particularly in this area, the study sites are represented by dry floodplain (Vega Seca) and humid plant communities, with broad forage availability and quality during spring and summer (Collantes et al., 1999; Utrilla et al., 2006); furthermore, these are extensively used by sheep (Anchorena et al., 2001).
A study conducted in Nicaragua to evaluate cattle behavior concerning the distance to trees in pastures shows that the bovines had grazing preferences towards places with low tree cover (Nilsen et al., 2009) and used different functional groups of trees. Cattle used trees with less cover to graze and those with denser crowns to protect themselves (Ramírez, 2012). When cattle have access to shade, they remain there during the hottest hours of the day, abandoning it when looking for water or at the end of the day (Geraldo et al., 2012).
On the other hand, in other non-tropical latitudes, Kaufmann et al. (2013) and Tomkins & Filmer (2007) reported a marked preference for grasslands with little tree cover. The study confirmed such trends, insofar as the animals, except the areas surrounding the attractive sites, prefer the areas with a low influence of shade, possibly due to the higher forage supply, an aspect already documented by Polanía et al. (2013).
The results suggest that bovines belonging to the Brahman breed show a greater degree of adaptation to dry tropical conditions by dedicating more activity time to grazing and movement in search of food, reflecting advantages compared to individuals of crosses with European breeds when exploring the different areas of the paddock. In fact, the literature reports that both breeds and seasons affect cattle behavior for foraging in semi-natural grasslands, with the season being the most relevant, although the genetic composition has also shown differences (Hessle et al., 2008). Bos taurus decreases grazing activity during hot hours, being more notable in animals with a black coat (Valle & Velásquez, 1980). On the contrary, zebu cattle have better traits to achieve thermoregulation in response to heat stress; they have more skin folds, larger sweat glands, and specialized hair to lose heat by conduction-convection and reduce the absorption of solar radiation (Hansen, 2004).
CONCLUSIONS
The areas surrounding the attractive points (drinking and salt troughs) show most animal visits, many of which coincide with the low quality of the site, suggesting a degradation process possibly due to trampling overload. In general, the highest grazing positions of animals were related to areas with medium site quality.
An animal movement pattern was shown towards low- to medium-productivity sites. This is possibly the result of the location of these areas adjacent to attractive sites, making these surfaces subject to high grazing pressure, degrading the pasture, and reducing its productivity. The areas with the highest number of positions are related to site productivity; however, this is not the only factor determining their movement.
Based on the findings of this study, it can be inferred that the main attractants that stimulate animal movement are the presence of drinking and salt troughs; nevertheless, shade and pasture quality and productivity could also exert an influence. This may be considered a hypothesis to prove in future studies.

