


 English (pdf)
 Article in xml format
 Article references
 Send this article by e-mail
 Cited by SciELO
  Cited by Google
  Similars in
SciELO
Similars in
SciELO  Similars in Google
 Permalink
INTRODUCTION
Cocoa (Theobroma cacao L) is one of Colombia's main commodities due to its social and commercial impact. This crop is relevant for the pacification of regions in conflict as it supports approximately 52,000 low-income families (Pabón et al., 2016; FEDECACAO, 2019). It also generates 62,000 and 93,000 direct and indirect jobs, respectively (MADR, 2018).
In the municipality of Los Andes, Nariño (Colombian southwest) cocoa has been cultivated since 2007, with a mean yield of 800 kg/ha on 185 ha (Agronet, 2020). There is evidence of a growing trend in cocoa cultivation, which could become a valid alternative to boost regional development. However, in Colombia, there are some problems in the value chain, such as low yield, cocoa quality technological development, lack of knowledge of quality parameters, associativity, trader confidence, and farmer integration (Contreras, 2017).
The characterization of agricultural production systems provides information on the features of agroecosystems as well as on social and economic aspects that may be the basis for developing projects and programs aimed to improve the rural sector (Suárez et al., 2021). Likely, this approach allows knowing the structure and function of the components in the systems (Melo, 2016).
Espinosa & Ríos (2016) designed alternative agroecological models in Afro-descendant communities of the Colombian Pacific coast. They demonstrated a significant advantage, both in ecological and socio-cultural aspects and in the cocoa quality management. In turn, Abbott et al. (2019) state that cocoa farming in Santander shows stagnation in productivity, despite the fact that it produces 640kg/ha, which is much higher than the national average of 450kh/ha (FEDECACAO, 2018), but lower than the breakeven of 1500kg/ha (Quintana et al., 2015). Therefore, it is important to provide information on the technological offers articulated with training and technical assistance in sensitive aspects of the production chain (Suárez et al., 2021).
Agroforestry systems, as a combination of trees, crops, and animals, have positive effects on farmers’ income and the environment, including how land is used, which leads to ecological, economic, and social benefits (FAO & UNEP, 2020). In the case of food security, smallholder farming with commercial agroforestry systems tends to focus on income production, whereas traditional systems concentrate on the benefits of diversity (Achmad et al., 2022). As a result, agroforestry benefits the environment and promotes agriculture stability (Spreafico, 2022).
The literature analysis by Achmad et al. (2022) reveals that small land tenure, low literacy rates, and lack of forest maintenance are the main causes of the low competitiveness of the subsistence of small agroforestry farmers. However, subsistence-oriented agroforestry practices have been fundamental for smallholder resilience.
Within this picture, the objective of this study was to characterize and socioeconomically analyze the traditional cocoa systems in the municipality of Los Andes, which is part of the project "Study for the Improvement of Productivity and Sensory Quality (aroma and flavor) of Regional Cocoa (Theobroma cacao L) of the department of Nariño" granted by El Sistema General de Regalías in Colombia (SGR).
MATERIALS AND METHODS
Study area. This research was conducted in the municipality of Los Andes, Nariño, Colombia, at 1°29'38"N and 77°31'17"W, with a temperature of 24ºC, 500 to 1,000mm of precipitation, with warm, medium and cold zones in a dry tropical forest (Municipio de Los Andes, 2020).
Sampling. Los Andes has varied relief landscapes where cocoa agroforests are established in association with different companion species, both timber and fruits. The cartographic and geographic information defined three altitudinal zones as follows: high zone (>1,100 masl) stratum one: medium zone (800 -1,100 masl), stratum two, and low zone (< 800 masl) stratum three.
A stratified sampling was designed following the formula proposed by Castillo (2002) (formula 1), considering a population of 250 farmers. To determine the variance in each stratum, pre-sampling was carried out with 5% of the population.
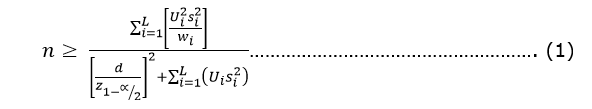
Where: n = Common sample size, L = Number of strata into which the population is divided, s2= Variance of the simple random sample taken in the i-th stratum, Si = Standard deviation of the simple random sample taken in the i-th stratum, Wi= importance of the i-th stratum, Z=1-α/2 quantile of standard normal distribution with probability less than or equal to 1-α/2, d = Maximum error of or deviation from the true value
The proportional allocation formula proposed by Castillo (2002) was used for the distribution of the subsamples within the main sample (formula 2).
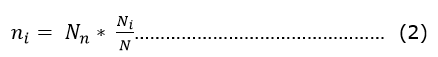
Where: ni= number of individuals in stratum i, n = Overall sample size, Ni= Size of the population in stratum i, N = Total population size
The overall sample size was 60 farmers who were proportional and randomly distributed in the three strata encompassing the villages: La Carrera, Arenal, Campo Bello, El Placer, Guayabal, Tablado, Curiaco, Villa Nueva, Guadual, Los Guabos, and San Francisco.
Application of the characterization instrument. The farmers selected in the strata and in each of the villages were made aware of the project, and using the D & D (Raintree, 1987) and RIMISP (Escobar & Berdegué, 1990) methodologies, the characterization process was carried out. Through workshops, brainstorming, and literature review, a semi-structured survey was designed with 18 qualitative (Table 1) and 20 quantitative variables (Table 2) based on Ballesteros-Possú et al. (2021) approach.
Table 1 Qualitative variables used in the characterization of the traditional cocoa production system in Los Andes, Nariño.
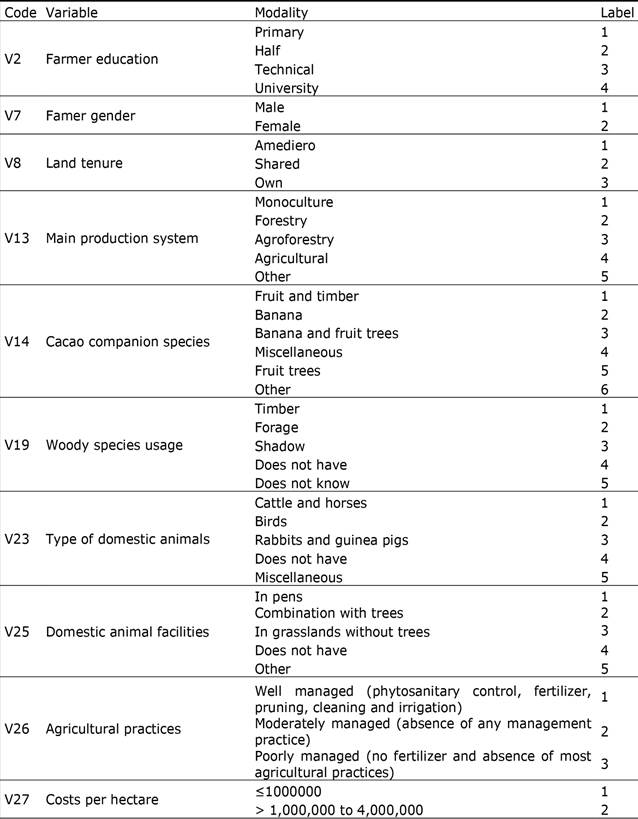
Source: Ballesteros-Possú et al., (2021).
Table 2 Quantitative variables used in the characterization of the traditional cocoa production system in Los Andes, Nariño.
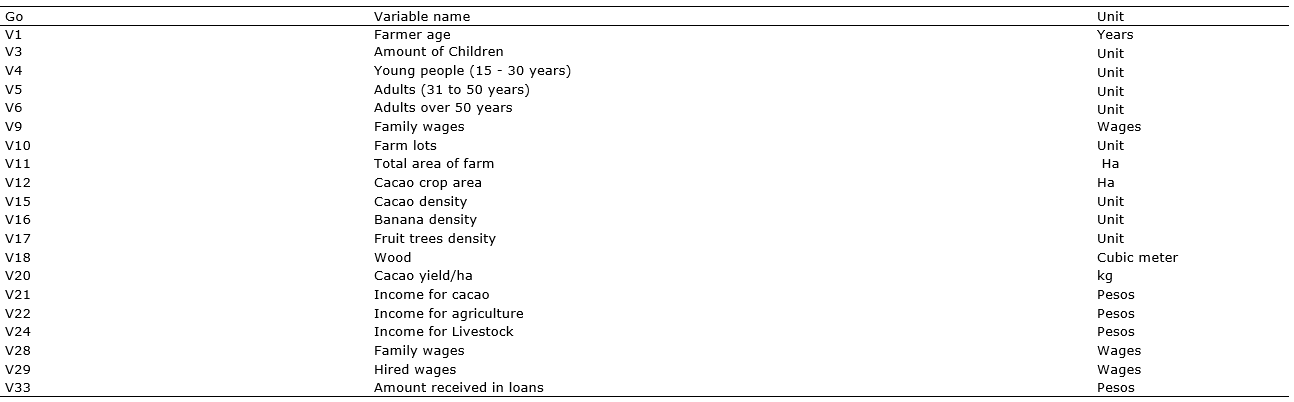
Source: Ballesteros-Possú et al. (2021).
Statistical analysis. The variables with variation coefficient (VC) higher than 30% were analyzed. Principal component analysis (PCA) and multiple correspondence analysis (MCA) were used to determine the groupings of qualitative and quantitative variables. Hierarchical classification, using Ward's distance method, allowed to group the farms by homogeneous and heterogeneous characteristics. All statistical processes used SPAD software, version 5.6.
RESULTS AND DISCUSSION
Principal component analysis (PCA). Seven components explained 70.50% of the total variability, with components 1 and 2 accounting for 32,78% of the total variability (Table 3).
Table 3 Eigenvalues explaining the total variability (%) of the quantitative variables.
| No. Components | Own value | Percentage (%) | Accumulated |
| 1 | 4.12 | 20.64 | 20.64 |
| 2 | 2.43 | 12.14 | 32.78 |
| 3 | 1.95 | 9.76 | 42.54 |
| 4 | 1.72 | 8.62 | 51.16 |
| 5 | 1.52 | 7.62 | 58.78 |
| 6 | 1,28 | 6.41 | 65.19 |
| 7 | 1.06 | 5.31 | 70.50 |
| 8 | 0.95 | 4.77 | 75.27 |
There are several methods to select the optimal number of components (Peres-Neto et al. 2005), such as taking an arbitrary cumulative percentage cut-off (Palacio et al. 2020), retaining those components that explain more than 70% of the total variability (Jolliffe & Cadima, 2016), when the eigenvalues are greater than one (Cliff, 1988) and the scree plot (Palacio et al. 2020).
In this case, the number of components that explain the total variation in the population of cocoa farmers was nineteen; therefore, it is inferred that little variability in the sample size is concentrated in the first five components, which may result in a loss of information. However, since the objective of the PCA is to reduce dimensionality, it is usually of interest to use the minimum number of components that are sufficient to explain the data. However, there is no single answer or method to identify what is the optimal number of principal components to use (Joaquin-Amad, 2017). What is evident in this study is that the largest proportion of cumulative explained variance is represented in the first seven components, and after these, the increase ceased to be meaningful.
The first component explained 20.64% of the total variability, and the most negatively correlated variables were total farm area (V11), income from agricultural production other than cocoa (V22) with a variable-factor correlation of -0.83, and income from livestock production (V24) with a variable-factor correlation of -0.72 (Table 4).
Table 4 Variable-factor correlation of each of the variables on the first five components.
| Variable - modality | Components weight | ||||
| 1 | 2 | 3 | 4 | 5 | |
| C2-V1 | -0.49 | 0.36 | 0.12 | 0.15 | 0.30 |
| C3-V3 | 0.31 | -0.32 | 0.35 | -0.22 | -0.56 |
| C4-V4 | 0.11 | -0.32 | -0.20 | 0.47 | -0.32 |
| C5-V5 | 0.27 | -0.16 | 0.68 | 0.07 | -0.28 |
| C6-V6 | -0.23 | 0.34 | -0.43 | -0.03 | 0.36 |
| C7-V9 | -0.26 | 0.28 | 0.67 | 0.14 | 0.12 |
| C8-V10 | -0.54 | 0.35 | 0.30 | -0.08 | -0.19 |
| C9-V11 | -0.83 | 0.12 | 0.07 | -0.23 | -0.07 |
| C10-V12 | -0.42 | -0.45 | -0.11 | 0.27 | 0.00 |
| C11-V15 | -0.16 | -0.46 | -0.36 | 0.19 | -0.10 |
| C12-V16 | -0.39 | 0.07 | -0.32 | -0.24 | -0.52 |
| C13-V17 | -0.38 | 0.54 | 0.20 | 0.24 | -0.28 |
| C14-V18 | -0.03 | -0.11 | -0.11 | 0.34 | -0.27 |
| C15-V20 | -0.52 | -0.68 | 0.24 | 0.21 | 0.24 |
| C16-V21 | -0.52 | -0.68 | 0.24 | 0.21 | 0.24 |
| C17-V22 | -0.83 | -0.02 | -0.06 | -0.21 | -0.27 |
| C18-V24 | -0.72 | -0.13 | 0.00 | -0.39 | -0.04 |
| C19-V28 | 0.13 | 0.25 | 0.11 | 0.67 | -0.12 |
| C20-V29 | -0.54 | 0.30 | -0.09 | 0.49 | 0.01 |
| C21-V33 | -0.20 | 0.11 | -0.40 | 0.23 | -0.34 |
The second component explained 12.14% of the total variability. This was highlighted by the income from cocoa production per year (V21) and cocoa production per year (V20), which presented a negative variable-factor correlation of -0.68 for both; however, the variables quantity of fruit trees per ha (V17) and quantity of cocoa per ha (V15) showed a correlation of 0.54 and -0.46, respectively. For the third component, which accounted for 9.76% of the total variability, the variables number of adults per farm (V5) and labor force (V9) stood out with a variable-factor correlation of 0.68 and 0.67, respectively.
The fourth component explained 8.62% of the total variability and encompassed the variables family and hired labor (V28 and V29), with a variable-factor correlation of 0.67 and 0.49, respectively. Finally, factor five explained 7.62% of the variability; the variables that contributed the most were children per farm (V3) and quantity of plantain trees per hectare (V16), with variable-factor correlations of -0.56 and -0.52, respectively (Table 4).
The variables agricultural production other than cocoa (V22) and income from livestock production (V24) in the first component indicate that activities other than cocoa play an important role in the household economy. Franzen & Borgerhoff (2007) suggest that outreach focusing on farm diversification may be the most effective way of optimizing ecological, economic, and social outcomes.
Farm diversification may provide an effective means of achieving improved farmer security and dissuade farmers from abandoning or planting cocoa according to price fluctuations, thus reducing the use of new forest areas in cocoa production. The product diversification that agroforestry brings with it improves farmer’s livelihood by differentiating their source of income and contributing to the family food security (Porrini, 2019).
The third and fourth factors are discriminated from the rest by considering labor, children, and plantain. In the area, labor is limited due to the demand for illicit crops and oil palm. These variables are an important stressor for the cocoa production system since production costs have increased without an increase in the sale price of cocoa beans. Fortunately, children are not involved in forced labor in cocoa; most of them go to school and help with the fermentation and drying of cocoa.
General cocoa budges showed that the most important item is labor, followed by inputs and plant material. The disaggregation of costs into monetary and non-monetary (implicit cost) showed that producers with low technification and low frequency of input use present 35% of non-monetary costs per tree, while producers with some level of crop management and relatively high execution of activities have a slightly higher non-monetary cost, 45% of the average total cost per tree (Zabala et al., 2019).
Classification analysis. The classification analysis grouped the producers into five major clusters characterized by their affinity within each group and by their intergroup differences (Figure 1).
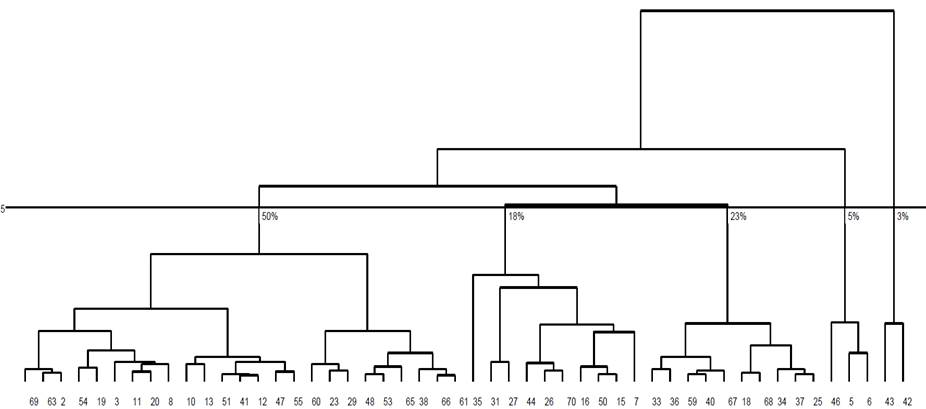
The first group consisted of 46.67% of farmers (Table 5), who were characterized by having low cocoa density (862 individuals/ha), compared to the overall average (957 plants/ha). In addition, they are young farmers (<50 years old) (V1) with cocoa areas of 1.13ha (V12) and with little investment in cocoa labor (V29). If the goal is to produce cocoa, these farms are not profitable because at least 1,500kg/ha is needed to reach a breakeven point (Quintana et al., 2015) and to have at least 4ha of cocoa to generate at least a monthly minimum wage. The cocoa area in the farm is similar to those by FEDECACAO (2021) of 0.34ha. Pabón et al. (2016) found that the average size of cocoa farms in the department of Santander (Colombia) is 6.6 ha. However, Molandez International (2021) affirms that 90% of the world’s cocoa beans are harvested on small, family-run farms with less than two hectares of land and an average yield of just 600-800 kg per year. Summarizing the global cocoa productivity reports, it can be inferred that cocoa farming is not profitable for small farmers, which should be reviewed by governments so that there is a real transition for cocoa farmers to a dignified life in the countryside.
The second group comprised 21,67% of farmers (Table 5). This group presents the highest values of the general average. They produce 1200kg/ha (V20), compared to the general average of 611kg/ha. They are characterized by having areas of 2.29ha (V12) compared to the average of 1.54ha. Likewise, the cocoa production system presents diversity of timber species (>30 trees/ha) (V18) in addition to having a higher income (V21) than the other groups.
The farmers who own these farms are privileged because, given the area's environmental and cultural conditions, it is very difficult to produce more than 1000 kg/ha. Jagoret et al. (2017a); Jagoret et al. (2017b) confirm this statement when reporting an average cocoa yield of 737kg/ha in Cameroon. Rafflegeau et al. (2015) point out that productivity per hectare of cocoa worldwide is very variable, ranging from 80 to 4000kg/ha. They recommend that farmers can intervene on the structural characteristics of their cocoa agroforests to improve cocoa yields, in particular by eliminating unproductive cocoa trees. Another point in favor of this group is the diversity of timber species, which contribute to the self-sufficiency and the economic equilibrium of the households, as affirmed by Cerda et al. (2014).
Table 5 Number of farms in each of the five groups and the variables weight in each group based on quantitative variables in the Andes, Sotomayor.
| Group | No. of farms | Weight | Weight variables by group |
| 1 | 28 | 50,33 | V5, 3, 15, 1, 12, 29 and 6 |
| 2 | 13 | 18,00 | V 20, 21, 12 and 18 |
| 3 | 14 | 23,33 | V 6, 1 and 5 |
| 4 | 3 | 5,00 | V 17, 10, 29 and 9 |
| 5 | 2 | 3,33 | V 22, 24, 12, 20 and 21 |
The third group comprised 23.33% of the cocoa farmers (Table 5). The variable that stood out the most was the age of the producer (V1), where the majority of producers are adults over 50 years old (V6). This is consistent with what was found by De la Cruz-Landero et al. (2015), who evidenced that more than 50% of the producers were over 50 years old. This aspect directly affects cocoa production due to the fact that this crop demands labor; therefore, an advanced age hinders the development of the efficiency of the activities. However, FEDECACAO (2021) found that 73.68% of cocoa farmers are between 27 and 59 years old. Likewise, Pabón et al. (2016) mention that the age of farmers and their level of education can be an obstacle to technology transfer and adoption.
The fourth group involved 5% of the respondents (Table 5). The small number of farms present stood out from the rest because they had higher values in terms of the number of fruit trees per hectare (V17). There were 468 fruit trees/ha compared to the average (40 trees/ha). In addition, the producers have the farm divided into several lots (V10), which forces them to require hired labor (V29). The characteristic that stood out the most in this group was the diversification of the farms with companion species, especially fruit trees. Jagoret et al. (2017a) describe that traditional cocoa agroforests contain mostly annual and fruiting species, generating income diversity. Sonwa (2007) encountered a total of 206 tree species, with an average of 21 tree species per agroforest in Cameroon. In this group, diversification of production other than cocoa may be a viable alternative due to the environmental conditions of the area and the relative proximity to marketing centers. On the other hand, the atomization of the lots per producer makes it difficult to establish rigorous management plans, since most of their time is spent traveling to and from their farms.
Another concern is the dispersion of production units. Kongor et al. (2018) indicate that farm size, however, had a negative impact, which implies that an increase in farm size results in decreased smallholder cocoa productivity. The same authors affirm that farmers should be encouraged to sustainably intensify farm management through controlling pests and diseases, regular pruning and efficient application of fertilizer rather than focusing on excessive land expansion, which eventually hampers productivity and biodiversity.
The fifth group represented 3.33% of the cocoa farmers’ population (Table 5). The high cocoa yield (V20) is outstanding on these farms being above 1,500kg/ha compared to the overall average of 611kg/ha/year. Similarly, the total area of the farm (V12) has higher values than the overall average (1.54ha), which is directly proportional to the area used for the cocoa plantation, with an average of 3.5ha.
Likewise, farmers have different sources of income, both for agricultural species (V22) and livestock species (V24). Pabón et al. (2016) found cocoa plantations with yields of up to 1,818kg of cocoa per hectare but with small farm sizes. In addition, Peña (2019) mentions that currently, cocoa associated with other components such as agroforestry systems, can solve the environmental impact of monocultures, optimizing the land use efficiency and cocoa yield.
On the other hand, most of the respondents reported low investment in cocoa crops, an outstanding characteristic in the cocoa culture, as well as steepest topography, arid climate, and bad roads that restrict the technification. Similarly, González (2017) states that the lack of basic conditions directly influences the sustainability of the cocoa production system.
It is important to mention the low participation of young people in cocoa farms; therefore, it is essential to reinforce the appropriation and adoption of this type of production system among young people and children in order to guarantee their sustainability. Mata et al. (2018) express that the aging and illiteracy of cocoa farmers negatively affect cocoa farms.
Multiple correspondence analysis (MCA). This analysis established that 11 components explained 58.43% of the variability. The eigenvalues of the first five components accounted for 32.74% of the variability. The first component accounted for 97% of the variability, while the fifth one accounted for 5.53% (Table 6).
The results of the MCA analysis indicate that the population has little differentiation in quantitative characteristics; therefore, few variables are responsible for the inertia between eigenvalues.
According to Ayele et al. (2014), in many studies, the reduction of variables is not achieved adequately. This can be put down to either (i) all the factors being too scattered to be summarized in a smaller dimension and/or (ii) the number of observations obtained in the cross tabulation being too small for all possible pairs of levels in the study.
Table 6 Eigenvalues and number of factors with qualitative variables and their cumulative percentage of variability.
| No. Components | Eigenvalues | % by factor | Accumulated |
| 1 | 0.21 | 7.97 | 7.97 |
| 2 | 0.17 | 6.64 | 14.60 |
| 3 | 0.17 | 6.44 | 21.04 |
| 4 | 0.16 | 6.17 | 27.21 |
| 5 | 0.14 | 5.53 | 32.74 |
The variables that contributed the most to the conformation of the first component were woody species (V19), cocoa companion species (V14), and technical assistance (V35), with a variable-factor correlation of 1.58, 1.30, and 0.5, respectively. In the second component, the most correlated variables were animal facilitations (V25) and technical assistance (V35), with a variable-factor correlation of 0.5 and 0.53. For the third component, the main production system (V13), technical assistance (V35), and paid loans (V34) were the variables with the highest correlation with 0.53, 0.43, and 0.39, respectively. In the fourth component, the variables with the highest correlation were the main production system (V13) and agricultural practices (V26), with a variable-factor correlation of 0.77 and 0.52. Finally, in the fifth component, cocoa companion species (V14) and loan acquisition and repayment (V32 and V34) were the most highly correlated variables, with 0.68 and 0.56, respectively (Table 7).
Table 7 Contribution of the qualitative variables evaluated in the development of the surveys in cocoa farms to the conformation of the factors and their weight in the categories.
| Variables | Categories weight | heavier | Weight contribution per factor 1 2 3 4 5 |
| 13 | 2 : 20 | 0.83 0.13 0.53 0.77 0.36 | |
| 4 : 34 | -0.48 0.16 0.16 -0.19 -0.28 | ||
| 14 | 5 : 25 | .0.66 0.33 0.23 0.07 0.18 | |
| 1 : 12 | 1.30 - 0.33 0.24 -0.16 0.68 | ||
| 19 | 4 : 39 | -0.4 0.08 -0.02 -0.15 -0.30 | |
| 1 : 7 | 1.58 -0.11 0.15 -0.49 0.11 | ||
| 25 | 4 : 22 | 0.0 0.53 0.24 -0.83 0.16 | |
| 2 : 20 | -0.16 -0.87 -0.26 0.39 0.10 | ||
| 26 | 1 : 32 | -0.45 -0.18 -0.4 .0.21 0.23 | |
| 2 : 21 | -0.40 0.11 0.08 0.52 0.23 | ||
| 27 | 4 : 25 | 0.71 -0.82 0.18 -0.3 0.32 | |
| 1 : 14 | -0.22 0.27 -0.06 0.10 -0.11 | ||
| 32 | 1 : 46 | 0.31 0.07 0.26 0 -0.17 | |
| 2 : 14 | -1.02 -0.22 -0.86 0.01 0.56 | ||
| 34 | 3 : 33 | 0.33 0.21 0.39 -0.2 -0.05 | |
| 4 : 14 | -1.02 -0.22 -0.86 0.01 0.56 | ||
| 35 | 1 : 34 | -0.26 -0.68 0.43 0.32 -0.20 | |
| 4 : 23 | 1.5 0.5 0.12 0.05 0.16 |
The variables that contributed the most were agricultural loans (V32), with 76%, where the majority of producers have paid them (V34). Regarding the use of timber species (V19), 65% stated that they do not have them and that these species do not have a specific use, and most of them come from natural regeneration.
The conversion of forest or cocoa agroforests to full-sun cocoa plantations might result in agro-ecological drawbacks such as forest degradation, biodiversity loss, soil quality disruption associated with low yield and food insecurity, and greenhouse gas emission (Gockowski & Sonwa, 2011; Tscharntke et al., 2011).
Regarding the companion species in the cocoa production system,they play an economic, social and environmental role that makes it very resilient to the adversities faced by producers (Jagoret et al. 2017b); the conversion of these systems to monocultures would have a significant economic impact but negative in environmental aspects (Tondoh et al. 2015).
Concerning technical assistance, which is a very important factor for the improvement of cocoa productivity, Torres (2019) found that the perception of the usefulness of adopting technology transfer is mainly due to factors such as adaptability, proximity and usability (applicability).
On the other hand, the most prominent production system is monoculture (V13) (56%), followed by forestry (30%), the companion tree species for cocoa (V14) are mostly fruit trees (42%), while in others there is a mixture of timber and fruit trees (20%). Cocoa cultivation is well managed (V26), with 53% of the farms applying pest and disease control, fertilization, pruning, cleaning, and irrigation; just 35% apply little technology. In addition, 56% of the farmers have received technical assistance (V35) occasionally or sporadically, and others receive training on a regular basis. In this group, cocoa budgets (V27) range between $ 8 and $ 11 million COP.
Another aspect to highlight is the presence of domestic animals (V25). On some farms, the number of domestic animals is low, and poultry is occasionally found. Finally, the farmers mentioned that the most commonly used means of transportation (V37) are horses, motorcycles, and pickup trucks due to the slopes of more than 30%, a characteristic that is representative of the area's relief.
As could be observed, these variables are related to the conditions and characteristics of the production system, taking into account the distribution and types of systems established on the farms. The analysis yielded socioeconomic information on the same factor, clearly showing the multiple relationships that exist among them. For example, between cocoa plantation management and production costs. In addition, the identification of the companion species is a priority because it allows the identification of structure and function. Also, the characterization of the multiple benefits that this association provides to factor 1, which has a high variability value.
A study by Walton et al. (2020) pointed out that the rudimentary design made for farmers responds to their needs and describes how no-cocoa growers thrive in zones where it is most likely to have rudimentary housing, unimproved toilet facilities, and unsafe water. These results support the complexity of cocoa farms and the need for the appropriate develop sustainable strategies to guarantee the success of small cocoa growers.
Classification analysis. The classification analysis for the qualitative variables in the surveyed farms allowed the formation of five groups (Figure 2). The first group consisted of 6.7% of the farmers surveyed. In this group, producers are characterized by having difficulties with the efficient production of cocoa (V30) due to adverse conditions in the area, such as high temperatures, poor access roads, a lack of agricultural technification, lack of associativity, and poor functioning of the cocoa production chain at the regional level, especially in medium and small producers.
Contreras (2017) mentions that in Colombia, these problems are recurrent in all cocoa-growing areas, affecting the cocoa value chain. In addition, these farmers depend on agricultural crops (V13), which they mix with shade trees (V14), consolidating as silvo-agricultural systems with companion species for cocoa, such as timber and fruit trees (Table 8). FEDECACAO (2021) reports that 94.44% of cocoa is associated with banana and a smaller percentage with sugarcane and coffee; however, no tree species are registered.
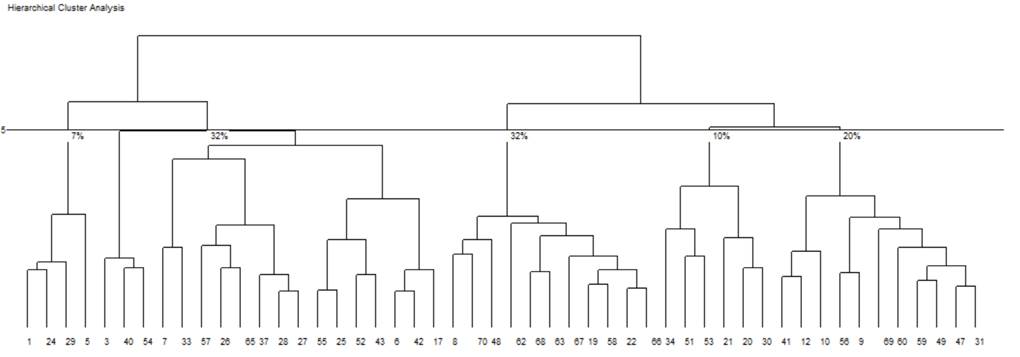
Figure 2 Conformation of groups according to the qualitative characteristics evaluated in the surveys conducted on cocoa farmers in the municipality of Los Andes, Sotomayor.
Table 8 Description of the groups conformed in the MCA of the surveys carried out in the cocoa farms of the municipality of Los Andes, Sotomayor.
| Group | No. of farms | Weight variables by group |
|---|---|---|
| 1 | 4 | V19, 14, 13, 30 and 34 |
| 2 | 19 | V 26, 13, 25 and 37 |
| 3 | 19 | V 27, 13, 35 and 23 |
| 4 | 6 | V34. 32, 35 and 30 |
| 5 | 20 | V 13, 19, 34 and 25 |
The second group was made up of 31,7% of producers who state that they manage the cocoa production system well and moderately (V26) (Table 8); however, they emphasize that the production system should be strengthened to increase marketing, alluding to the poor management of the local government to provide solutions to the problems mentioned. This is consistent with Acebo et al. (2016), who argue that the commercialization of local cocoa involves few local intermediaries, often located in captive relationships or working on a commission for large traders or subsidiaries of multinational corporations, which always maintain low prices for cocoa.
The third group consisted of 31,7% of the total, where most of the farmers have some animal species on their farms (V23), which generate additional income for their families (Table 8). This is consistent with what was reported by Sánchez et al. (2015), who state that raising small animals such as pigs and poultry complements agricultural activity on cocoa farms, improving income and diversifying the system.
The fourth group was made up of 10%, which stood out mainly because of the high percentages of variables 32 and 34 (Table 8), which refer to loans. These results agree with those from FEDECACAO (2021), which states that 89.47% of producers have requested or have been granted some type of loan.
Other aspects that stand out are the difficulties presented by their production systems (V30), which are associated with a lack of technification, such as plant quality, climate (high temperatures), associated crops, and economic factors. All of this has led them to request loans (Table 8). According to MADR (2017) and FEDECACAO (2018), poor schooling, lack of roads, low technification and low yield limit the higher income of the cocoa farm; however, in several areas of the country, cocoa cultivation is an alternative for substituting illegal crops.
Finally, the fifth group represented 20% of the total. These farms stand out for not having animal species (V23) in their production systems, particularly the agricultural system (V13), where cocoa is regularly found associated with plantains (Table 8).
Agroforestry systems based on cocoa in the Andean region use plantains as initial cocoa shade and also as income to amortize the production costs at the beginning of the system. Cacao agroforestry has been considered a biodiversity-friendly farming practice by maintaining habitats for a high diversity of species in tropical landscapes (Rocha et al., 2019) and sometimes mixing wild and domestic animal species. However, in the Andes zone, because it is a tropical dry forest, plant biodiversity and animal minor species are scarce.
Since the socioeconomic contribution of agroforestry products has been partially evaluated, information on their trade-offs with biophysical characteristics (species richness, stand densities, and yields) is also scarce (Cerda et al., 2014). This information is critical for choosing the best strategy for cocoa cultivation, whose design and management will have impacts at the family, farm and landscape levels (Clough et al., 2011). From this study, we propose different types of cocoa farming intensification for land-sparing and wildlife-friendly farming and advocate for further research on these issues.
Achmad et al. (2022) recommend that it is indispensable to develop collaborative actions between researchers, farmers, and the government to increase access to information, technology, and markets. Although it is still difficult to realize, forest services, such as upstream-downstream compensation and carbon capture, have the potential to increase farmers’ income from their cocoa based agroforest systems.
For this reason, Colombia must lead technical assistance and technology transfer to increase cocoa yields through the introduction of new technologies based on modern agroforest systems, where yields of over 1000kg/ha have been obtained (Pinzón-Useche et al., 2012) and even with the application of high technology, yields of up to 2,000 to 3,000 kg/ha (Briceño-Puentes, 2018). Regarding profitability, annual production should be between 1,500 and 2,000 kg/ha with a minimum production unit of 3 ha (ERS et al., 2009).
CONCLUSIONS
The variables that stood out in the principal components analysis (PCA) were total farm area, income from agricultural production other than cocoa, income from cocoa production, and family labor.
The variables with the highest correlation in the multiple correspondence analysis (MCA) were the farmer's level of schooling, type of transportation, loans, place of product marketing, technical assistance, gender, land tenure, type of production systems, access roads, presence of animals on the farm and place available for them, which have a direct influence on cocoa cultivation.
The presence of some fruit, timber, and banana species associated with cocoa in some of the farms studied highlights the importance of agroforestry systems as an alternative to ensure sustainability and generate additional income for cocoa-farmers’ families.
Sotomayor is a municipality that is making inroads into cocoa cultivation, so there is still a need to establish strategies to improve these systems so that, in addition to providing subsistence goods, they can generate income that will allow farmers to reinvest in improving the crop and generate some savings.

