


 English (pdf)
 Article in xml format
 Article references
 Send this article by e-mail
 Cited by SciELO
  Cited by Google
  Similars in
SciELO
Similars in
SciELO  Similars in Google
 Permalink
INTRODUCTION
Pigeonpea, (Cajanus cajan (L.) Millsp.), belongs to the family Fabaceae. It is a tropical and sub-tropical perennial usually grown as an annual legume consumed mainly for its seeds. It is a plant that can withstand drought, is hardy and so grows fast, so it can thrive where other crops might not survive (Ogbe & Bamidele, 2007). Pigeonpea is eaten as green vegetable, and it is an important source of protein, vitamin B, carotene, and ascorbic acid (Abebe, 2022). Its foliage has a high fibre content (16-37%) and lignin (7-21%) (Adeboyegun et al., 2020). Other benefits include aiding nitrogen fixation; an efficient windbreaker that provides shade to young coffee or vanilla plants in Venezuela when it is grown jointly (Valenzuela, 2011).
The potential yield of pigeonpea is about 2500 kg/ha, while its yield in the farmer’s field in Africa is about 736.2 kg/ha (Dutta et al., 2011). This lower yield in Africa is majorly due to biotic and abiotic stress, and a lack of quality seeds (Ayenan et al., 2017). Farmers in Nigeria usually abandon the cultivation of pigeonpea for reasons such as reduction in yield, cultivation being too stressful, demanding and lack of buyers (Esan & Ojemola, 2018). Hence, pigeonpea is considered an underutilised crop in Nigeria and many parts of Africa (Zavinon et al., 2018).
Its potentials are not yet supported by accurate data like other legumes which include cowpea (Vigna unguiculata), groundnut (Arachis hypogea), and soybeans (Glycine max) in Nigeria. The paucity of information on its production output and germplasm performance, which can help breeders in germplasm selection, conservation, and characterization, is a major challenge facing pigeonpea crop improvement in Nigeria. Therefore, there is a need for more probes into this agronomic important crop to identify resilient germplasm, varieties, or accessions that can be selected for improved agronomic yield. Kinhoegbe et al. (2020) stated that morphological variations among germplasm provide phenotypic signatures of individual varieties by evaluating specimens based on physical characters. Hence, this study seeks to assess the morphological variability among selected accessions of Nigerian pigeonpea to identify potential lines for agronomic improvement.
MATERIALS AND METHODS
Collection of Samples. A total of 52 pigeonpea accessions (Table 1) were obtained from the International Crops Research Institute for the Semi-Arid Tropics (ICRISAT) for the study. They were planted at the Botany Department screenhouse (Latitude 6° 30´ 52´´ N, Longitude 3° 25´ 56´´ E), University of Lagos, Nigeria.
Table 1 List of pigeonpea accessions collected from ICRISAT.
| SN | Accessions | SN | Accessions | SN | Accessions | SN | Accessions | |
| 1. | ISC-107 | 14. | ISC-168 | 27. | ISC-201 | 40. | ISC 46 | |
| 2. | ISC-11 | 15. | ISC-169 | 28. | ISC-202 | 41. | ISC 51 | |
| 3. | ISC-111 | 16. | ISC-171 | 29. | ISC-23 | 42. | ISC-63 | |
| 4. | ISC-115 | 17. | ISC-172 | 30. | ISC-24 | 43. | ISC-66 | |
| 5. | ISC-118 | 18. | ISC-174 | 31. | ISC-25 | 44. | ISC-76 | |
| 6. | ISC-120 | 19. | ISC-176 | 32. | ISC-3 | 45. | ISC-77 | |
| 7. | ISC-123 | 20. | ISC-178 | 33. | ISC-30 | 46. | ISC-78 | |
| 8. | ISC-124 | 21. | ISC-179 | 34. | ISC-31 | 47. | ISC-82 | |
| 9. | ISC-131 | 22. | ISC-183 | 35. | ISC-34 | 48. | ISC-84 | |
| 10. | ISC-133 | 23. | ISC-184 | 36. | ISC-35 | 49. | ISC-86 | |
| 11. | ISC-136 | 24. | ISC-185 | 37. | ISC-4 | 50. | ISC-91 | |
| 12. | ISC-140 | 25. | ISC-186 | 38. | ISC-40 | 51. | ISC-95 | |
| 13. | ISC-158 | 26. | ISC-2 | 39. | ISC-42 | 52. | ISC-129 |
Planting and phenotypic evaluation. Accessions were planted using three seeds per hole (in a 2 kg pot filled with soil) with three replicates per accession laid in a complete randomized design setup. After two weeks, plants were pruned down to one per pot. Normal agronomic practices, which include watering, weeding, and fumigation (2 and 8 weeks after planting), were done all through the duration of the experiment. Descriptor data for both quantitative and qualitative traits according to International Board for Plant Genetic Resources (IBPGR) and International Crops Research Institute for the Semi-Arid tropics (ICRISAT) (IBPGR & ICRISAT, 1993) were evaluated for each accession planted. These traits include leaflet length, leaflet width, vigour at 50% flowering, days to 50% flowering, days to 50% maturity, 100-seed weight, seeds per pod, pod length, pod number, number of primary branches, number of secondary branches, number of tertiary branches, plant height, leaf colour, leaflet shape, pattern of streaks, hairiness of leaf, base flower colour, flowering pattern, pod colour, pod form, growth habit and stem colour (Table 2).
Table 2 Description of traits evaluated in the study.
| Traits | Code | Description |
|---|---|---|
| Quantitative | ||
| Leaflet length (cm) | LLNT | Average length of 10 randomly selected leaves/stand (at maturity) |
| Leaflet width (cm) | LLWT | Average width of 10 randomly selected leaves/stand (at maturity) |
| Vigour at 50% flowering | VIG | Leaf area/foliage volume of the plant at 50% flowering |
| Days to 50% flowering (days) | D50F | Days on which 50% of the total number of flowers was observed |
| Pod length (cm) | PDL | Average length of 10 randomly selected pods/stand (at maturity) |
| Pod number | PDN | Number of pods per plant (at maturity) |
| Seeds per pod | SDPD | Number of seeds per pod taken from 10 randomly selected pods/stand |
| Plant height (cm) | PHT | Length measured from the plant's base to the highest canopy point/stand |
| Days to 50% maturity (days) | D50M | Number of days from sowing to 50% physiological maturity |
| 100-seed weight (g) | SDWT | Weight of air-dried 100 seeds using a weighing balance |
| Number of primary branches | PBRCH | Number of primary branches per plant |
| Number of secondary branches | SBRCH | Number of secondary branches per plant |
| Number of tertiary branches | TBRCH | Number of branches borne on secondary branches per plant |
| Qualitative | ||
| Leaf colour | LC | Colour of leaves at maturity |
| Base flower colour | BFC | Main colour of flowers (petals) during inflorescence |
| Pattern of streaks | PS | Patterns of second colour observed on the dorsal side of petals at inflorescence |
| Flowering pattern | FP | Arrangement of flowers during inflorescence |
| Leaflet shape | LS | Shape of leaflets at maturity |
| Hairiness of leaf | LH | Presence or absence of leaf hairs at the lower leaf surface at maturity |
| Growth habit | GH | Growth form at maturity |
| Stem colour | SC | Colour of main stem at maturity |
| Pod colour | PC | Colour of pod at maturity |
| Pod form | PF | Form of pod whether flat or cylindrical |
Statistical analysis. Morphological data obtained from screen house evaluation was subjected to analysis of variance (ANOVA). Differences between accession performances were separated and considered significant at a 5% level of significance using Bonferroni’s test. The relationship between traits was depicted using Spearman’s correlation analysis. Major trait contributors to phenotypic variability observed were assessed using the principal component analysis with eigenvalue >1. Both quantitative and qualitative data were used to cluster accessions based on their performance using the Euclidean distance method. The distance matrix obtained was used to construct a dendrogram using the UPGMA (Unweighted Pair Group Method with Arithmetic average) method while cluster correlation was used to verify the reliability of the cluster. All analysis was done using software RStudio (2022).
RESULTS AND DISCUSSION
Morphological variation among Nigerian pigeonpea accessions. One of the main objectives of characterization is to test the occurrence of traits that help to identify a particular accession. The characters that are used to distinguish accessions that have the ability of precise description and recognition are considered important only when they are not subject to environmental influence (Sahu et al., 2018).
The 52 pigeonpea accessions studied showed a significant variability morphologically as evident from the evaluated parameters as shown in Tables 3 and 4. All traits used in the study showed significant (p < 0.01) variation among accessions, the highest variation being observed in the Number of Tertiary Branches (CoV = 150.33, Table 4) and lowest in Leaflet length (CoV = 14.39, Table 3).
The maximum leaflet length of 10.97 cm was recorded in ISC-25, while ISC-185 had the lowest leaflet length of 5.97 cm (Table 3). The accession with the highest leaflet width was ISC-95 (LLWT = 4.13 cm), while ISC-129 had the lowest leaflet width of 1.63 cm (Table 2). Eleven accessions had the highest vigour of 7 at 50% flowering, while four accessions had the lowest vigour of 3. Days to 50% flowering (D50F) were recorded as 133 days for ISC-201, while ISC-2 had 70 days for D50F. ISC-25 had the longest pod length (PDL) of 8.43 cm, while the shortest pod length was observed in ISC-171 (PDL = 3.83 cm). The highest pod number was recorded in ISC-23 with 293 pods, while the least was recorded in ISC-185 and ISC-24 with 27 pods. ISC-24 and ISC-25 had the highest number of seeds per pod (SDPD) with an average of 6 seeds/pod, while ISC-169 had the lowest SDPD with 3 seeds/pod. A high number of seeds per pod is an important factor in areas where pigeonpea is mainly grown for the domestic market and consumed as a green vegetable. Farmers’ preference for a high number of seeds per pod and seed weight has been reported by Shiferaw et al. (2007). The high number of seeds per pod observed in the current study correlates with the findings by Manyasa et al. (2008), who reported higher numbers of seeds per pod in the African germplasm compared to the Indian germplasm.
ISC-201 had the highest plant height of 261 cm, while ISC-124 had the shortest height of 54 cm (Table 4). The earliest maturing accession was ISC-172 with 116 days to 50% maturity (D50M), while ISC-202 had the longest D50M of 221 days. ISC-201 had the highest 100 seed weight of 13.58 g, while the lowest seed weight was observed in ISC-111 with 6.06 g per 100 seed weight. Maximum primary branches were recorded for ISC-95 with 36 branches, while 3 primary branches were observed in ISC-140. ISC-183 and ISC-35 had the highest secondary branches of 35 branches, while ISC-185 had the minimum secondary branches of 3 branches. Maximum tertiary branching was observed in ISC-63 with 47 branches, while 27 accessions did not have tertiary branches (Table 4). The observed variation among these traits, both qualitative and quantitative, was similar to the report of Zavinon et al. (2019) and Kinhoegbe et al. (2020).
Table 3 Quantitative traits assessed in collected accessions.
| Accessions | LLNT | LLWT | VIG | D50F | PDL | PDN | SDPD |
| ISC-107 | 8.23±0.21 | 2.67±0.12 | 5.00±0.00 | 129.00±3.00 | 5.17±0.25 | 131.67±15.82 | 4.67±0.56 |
| ISC-11 | 8.50±0.17 | 3.03±0.29 | 5.67±2.31 | 76.33±8.14 | 5.13±0.12 | 140.67±5.69 | 3.33±0.58 |
| ISC-111 | 7.30±0.36 | 2.73±0.12 | 5.00±0.00 | 115.67±6.81 | 4.83±0.21 | 284.00±14.00 | 4.33±0.58 |
| ISC-115 | 8.80±0.78 | 3.40±0.70 | 3.67±1.15 | 78.00±11.14 | 4.40±0.36 | 115.67±9.45 | 3.67±0.58 |
| ISC-118 | 8.90±2.00 | 3.17±0.40 | 3.67±1.15 | 79.00±10.54 | 5.10±0.10 | 104.67±8.39 | 4.00±1.00 |
| ISC-120 | 6.33±0.67 | 2.20±0.10 | 3.00±0.00 | 74.33±4.73 | 4.50±0.52 | 90.00±4.58 | 3.67±0.58 |
| ISC-123 | 8.57±0.31 | 2.80±0.20 | 5.67±1.15 | 104.67±7.37 | 5.37±0.45 | 109.00±11.00 | 4.67±0.58 |
| ISC-124 | 6.03±0.38 | 2.27±0.40 | 3.00±0.00 | 71.67±5.51 | 4.63±0.15 | 34.67±7.02 | 4.33±0.58 |
| ISC-129 | 5.979±0.12 | 1.63±0.23 | 7.00±0.00 | 167.33±6.66 | 4.73±0.31 | 32.00±6.00 | 4.33±0.58 |
| ISC-131 | 7.03±0.47 | 2.43±0.12 | 6.33±.15 | 127.00±5.29 | 4.63±0.15 | 85.67±6.66 | 3.67±0.58 |
| ISC-133 | 8.00±0.44 | 2.20±0.20 | 7.00±0.00 | 123.33±3.51 | 4.60±0.36 | 277.33±16.17 | 3.33±0.58 |
| ISC-136 | 7.17±0.15 | 2.77±0.12 | 5.00±0.00 | 124.67±8.50 | 4.57±0.21 | 287.33±15.50 | 3.67±0.58 |
| ISC-140 | 8.97±1.16 | 3.57±0.31 | 3.00±0.00 | 72.67±2.52 | 4.70±0.44 | 40.33±1.53 | 4.00±1.00 |
| ISC-158 | 7.40±0.50 | 2.90±0.10 | 3.67±.15 | 122.33±7.02 | 4.80±0.36 | 135.33±11.37 | 4.00±1.00 |
| ISC-168 | 6.90±0.70 | 2.80±0.44 | 3.00±0.00 | 74.67±3.06 | 4.63±0.29 | 37.00±7.21 | 4.00±1.00 |
| ISC-169 | 7.90±0.66 | 2.87±0.29 | 5.67±1.15 | 117.33±3.79 | 4.27±0.59 | 195.67±18.58 | 3.00±1.00 |
| ISC-171 | 8.43±0.38 | 3.00±0.26 | 5.00±0.00 | 79.33±6.66 | 3.83±0.25 | 229.67±28.99 | 3.67±0.58 |
| ISC-172 | 8.47±0.47 | 3.20±0.17 | 5.00±0.00 | 72.67±5.51 | 5.17±0.35 | 137.00±4.00 | 4.00±1.00 |
| ISC-174 | 8.70±0.53 | 3.13±0.21 | 3.67±1.15 | 75.00±6.56 | 4.47±0.25 | 140.67±7.57 | 4.00±0.00 |
| ISC-176 | 8.30±0.36 | 2.47±0.25 | 4.33±1.15 | 81.67±5.51 | 4.30±0.50 | 128.33±11.06 | 3.33±0.58 |
| ISC-178 | 8.60±0.82 | 3.33±0.15 | 3.00±0.00 | 85.67±4.04 | 4.33±0.58 | 145.67±29.94 | 4.00±1.00 |
| ISC-179 | 8.80±0.44 | 3.23±0.32 | 5.00±0.00 | 101.00±7.94 | 4.83±0.49 | 133.67±14.57 | 3.67±0.58 |
| ISC-183 | 8.13±0.57 | 3.63±0.15 | 5.67±1.15 | 116.67±4.51 | 5.27±0.45 | 185.67±16.26 | 4.00±0.00 |
| ISC-184 | 6.37±0.29 | 2.27±0.15 | 4.33±1.15 | 94.33±6.43 | 5.07±0.21 | 90.00±17.78 | 4.33±0.58 |
| ISC-185 | 5.97±0.40 | 2.33±0.21 | 3.00±0.00 | 85.00±6.24 | 5.00±0.26 | 27.33±4.51 | 4.33±0.58 |
| ISC-186 | 8.43±0.31 | 3.37±0.06 | 3.00±0.00 | 81.67±3.21 | 4.63±0.76 | 87.67±17.16 | 3.67±0.58 |
| ISC-2 | 6.50±0.60 | 2.43±0.29 | 4.33±1.15 | 70.67±8.33 | 4.97±0.42 | 60.00±9.17 | 3.67±0.58 |
| ISC-201 | 10.67±0.15 | 3.37±0.47 | 7.00±0.00 | 133.67±9.71 | 7.10±0.26 | 84.67±6.11 | 5.67±0.58 |
| ISC-202 | 6.60±0.17 | 2.43±0.15 | 7.00±0.00 | 162.67±7.51 | 5.37±0.21 | 89.67±2.52 | 4.33±0.58 |
| ISC-23 | 7.67±0.35 | 2.60±0.44 | 5.00±2.00 | 119.00±5.29 | 4.90±0.40 | 293.00±4.36 | 3.67±1.15 |
| ISC-24 | 9.30±0.95 | 3.47±0.25 | 5.67±1.15 | 129.33±1.53 | 4.70±0.44 | 27.33±1.53 | 6.33±0.58 |
| ISC-25 | 10.97±0.51 | 3.83±0.47 | 5.00±0.00 | 119.67±1.53 | 8.43±0.59 | 33.33±5.51 | 6.33±0.58 |
| ISC-3 | 6.83±0.57 | 2.27±0.06 | 5.00±2.00 | 119.67±4.16 | 5.40±0.72 | 142.00±8.72 | 4.00±0.00 |
| ISC-30 | 7.77±0.58 | 2.87±0.21 | 5.00±2.00 | 83.00±7.21 | 5.40±0.66 | 159.67±2.08 | 3.67±0.58 |
| ISC-31 | 8.13±0.47 | 3.27±0.25 | 5.00±0.00 | 115.33±10.02 | 4.47±0.49 | 260.00±13.00 | 4.00±0.00 |
| ISC-34 | 8.07±0.38 | 2.87±0.35 | 3.00±0.00 | 69.00±1.00 | 4.63±0.29 | 33.33±4.16 | 3.67±0.58 |
| ISC-35 | 6.97±0.40 | 2.33±0.06 | 5.67±1.15 | 127.00±2.00 | 4.90±0.26 | 174.67±12.01 | 3.33±0.58 |
| ISC-4 | 9.63±0.15 | 3.67±0.12 | 3.00±0.00 | 78.33±2.08 | 5.40±0.62 | 174.00±27.73 | 4.67±0.58 |
| ISC-40 | 8.90±0.20 | 2.93±0.31 | 5.00±0.00 | 80.67±5.51 | 5.90±0.44 | 206.67±8.33 | 3.67±0.58 |
| ISC-42 | 7.77±0.57 | 2.90±0.26 | 5.00±0.00 | 73.00±7.94 | 5.13±0.93 | 133.67±13.58 | 4.67±0.58 |
| ISC-46 | 8.20±0.20 | 2.93±0.06 | 5.67±2.31 | 73.67±5.03 | 4.53±0.06 | 193.33±5.13 | 4.00±1.00 |
| ISC-51 | 6.33±0.64 | 2.27±6.40 | 4.33±2.31 | 73.00±6.56 | 5.80±0.52 | 157.00±59.57 | 5.00±1.00 |
| ISC-63 | 8.40±0.53 | 3.00±0.46 | 5.00±0.00 | 126.33±6.03 | 6.43±0.67 | 137.33±5.51 | 4.67±0.58 |
| ISC-66 | 8.43±0.21 | 2.67±0.06 | 3.00±0.00 | 96.67±1.53 | 5.07±0.15 | 193.00±4.00 | 4.00±0.00 |
| ISC-76 | 8.47±0.25 | 2.67±0.15 | 5.00±0.00 | 119.67±3.51 | 5.13±0.21 | 124.00±14.00 | 3.67±0.58 |
| ISC-77 | 7.70±1.15 | 2.93±0.40 | 6.33±1.15 | 125.00±3.00 | 4.97±1.15 | 240.00±4.00 | 4.67±0.58 |
| ISC-78 | 7.77±0.57 | 2.30±0.36 | 4.33±1.15 | 124.00±7.21 | 5.77±0.67 | 217.67±29.14 | 4.67±0.58 |
| ISC-82 | 7.00±1.13 | 2.67±0.25 | 4.33±1.15 | 92.00±5.57 | 4.73±0.21 | 243.00±16.70 | 4.33±0.58 |
| ISC-84 | 6.83±0.21 | 2.37±0.06 | 3.00±0.00 | 78.67±7.09 | 4.60±0.10 | 288.67±17.10 | 3.33±.0.58 |
| ISC-86 | 7.87±0.58 | 2.60±0.17 | 6.33±1.15 | 123.00±4.36 | 4.57±0.12 | 86.00±11.53 | 3.67±0.58 |
| ISC-91 | 9.17±0.57 | 3.10±0.20 | 3.00±0.00 | 86.67±4.04 | 4.67±0.15 | 66.33±11.85 | 4.33±0.58 |
| ISC-95 | 10.40±1.68 | 4.13±0.68 | 6.33±1.15 | 123.67±6.03 | 5.37±0.57 | 136.67±12.42 | 4.00±0.00 |
| Minimum | 5.97 | 1.63 | 3.00 | 69.00 | 3.83 | 27.33 | 3.00 |
| Maximum | 10.90 | 4.13 | 7.00 | 167.33 | 8.43 | 293.00 | 7.00 |
| Mean | 7.97 | 2.85 | 4.71 | 101.04 | 5.03 | 141.57 | 4.11 |
| Std. Deviation | 1.15 | 0.49 | 1.25 | 25.44 | 0.73 | 76.70 | 0.85 |
| CoV | 14.39 | 17.26 | 26.53 | 25.18 | 14.61 | 54.17 | 20.68 |
| F (51, 104) | 9.65** | 8.56** | 4.78** | 53.25** | 7.73** | 74.75** | 3.13** |
LLNT: Leaflet length (cm); LLWT: Leaflet width (cm); VIG: Vigour at 50% flowering; D50F: Days to 50% Flowering (Days); PDL: Pod Length (cm); PDN: Number of Pod; SDPD: Number of Seed Per Pod.
Table 4 Quantitative traits assessed in collected accessions (Cont.)
| Accessions | PHT | D50M | SDWT | PBRCH | SBRCH | TBRCH |
| ISC-107 | 168.00±13.53 | 174.33±7.09 | 6.92±0.18 | 13.33±3.51 | 33.33±6.81 | 24.00±8.54 |
| ISC-11 | 167.67±50.08 | 128.00±14.00 | 8.77±0.61 | 10.67±1.15 | 10.33±5.69 | 0.00±0.00 |
| ISC-111 | 182.33±13.87 | 152.33±6.11 | 6.06±1.02 | 25.67±4.51 | 20.33±2.52 | 5.67±1.53 |
| ISC-115 | 125.67±14.64 | 120.33±13.05 | 8.63±0.60 | 9.00±3.00 | 25.00±5.57 | 2.67±2.52 |
| ISC-118 | 91.00±8.54 | 122.67±11.59 | 8.95±0.40 | 15.00±3.00 | 16.33±3.51 | 0.00±0.00 |
| ISC-120 | 69.33±3.06 | 140.00±8.19 | 9.11±1.10 | 8.67±2.08 | 5.00±2.00 | 0.00±0.00 |
| ISC-123 | 175.00±6.56 | 145.67±6.43 | 10.26±1.38 | 14.00±2.00 | 6.33±1.15 | 0.00±0.00 |
| ISC-124 | 54.00±6.00 | 117.00±4.58 | 6.42±0.17 | 14.33±1.15 | 6.00±2.65 | 0.00±0.00 |
| ISC-129 | 192.00±12.12 | 207.67±8.08 | 8.23±0.70 | 19.00±4.00 | 20.00±4.00 | 8.00±2.00 |
| ISC-131 | 201.33±13.58 | 168.67±10.02 | 8.30±0.32 | 27.67±5.03 | 15.00±2.65 | 3.67±.15 |
| ISC-133 | 203.00±25.00 | 164.33±5.69 | 9.61±0.91 | 15.00±2.65 | 25.00±4.58 | 10.00±4.00 |
| ISC-136 | 160.33±15.04 | 172.33±11.06 | 8.47±0.33 | 27.33±2.52 | 27.33±5.69 | 3.33±1.53 |
| ISC-140 | 67.67±16.01 | 120.33±3.51 | 8.51±1.63 | 3.67±1.53 | 6.33±2.31 | 11.00±2.65 |
| ISC-158 | 144.33±10.02 | 174.67±13.58 | 11.57±1.54 | 12.67±3.06 | 31.67±5.69 | 34.00±11.53 |
| ISC-168 | 91.33±10.26 | 148.00±0.00 | 7.22±0.29 | 8.33±2.52 | 13.67±2.08 | 0.00±0.00 |
| ISC-169 | 180.00±11.14 | 164.00±4.00 | 8.80±0.73 | 11.00±2.00 | 26.67±3.51 | 32.67±9.07 |
| ISC-171 | 156.33±6.66 | 124.67±3.51 | 9.77±0.70 | 15.00±3.00 | 12.00±2.00 | 0.00±0.00 |
| ISC-172 | 124.33±11.68 | 116.33±12.90 | 8.49±0.16 | 10.00±2.00 | 27.67±5.03 | 30.33±5.03 |
| ISC-174 | 163.67±11.93 | 123.00±9.85 | 7.81±0.54 | 8.00±1.73 | 4.00±1.00 | 0.00±0.00 |
| ISC-176 | 165.67±21.22 | 126.67±6.11 | 9.07±1.31 | 11.67±1.53 | 5.67±2.31 | 0.00±0.00 |
| ISC-178 | 150.00±20.22 | 123.33±11.37 | 7.89±0.15 | 14.67±2.08 | 21.33±8.50 | 8.33±1.15 |
| ISC-179 | 125.33±8.33 | 133.33±7.37 | 9.02±0.36 | 12.00±2.00 | 13.33±2.31 | 0.00±0.00 |
| ISC-183 | 182.33±16.26 | 156.33±6.66 | 11.61±1.64 | 20.33±2.31 | 35.67±4.04 | 35.00±4.36 |
| ISC-184 | 162.33±15.95 | 151.67±10.02 | 7.86±0.50 | 13.33±1.53 | 11.33±1.15 | 0.00±0.00 |
| ISC-185 | 65.67±4.51 | 132.00±8.19 | 7.65±0.87 | 6.00±1.00 | 3.33±0.58 | 0.00±0.00 |
| ISC-186 | 111.00±8.54 | 126.67±4.16 | 8.59±1.14 | 12.67±3.79 | 19.33±4.04 | 26.67±7.23 |
| ISC-2 | 145.67±18.82 | 148.33±9.29 | 7.64±0.32 | 15.67±2.31 | 29.33±3.21 | 29.33±15.31 |
| ISC-201 | 261.67±28.38 | 179.67±6.81 | 13.58±1.47 | 16.00±2.00 | 21.33±2.08 | 0.00±0.00 |
| ISC-202 | 204.33±14.29 | 221.67±4.73 | 10.54±0.90 | 16.00±3.61 | 13.33±1.53 | 0.00±0.00 |
| ISC-23 | 196.00±28.69 | 160.00±11.00 | 9.23±1.05 | 16.33±1.53 | 27.67±4.04 | 7.33±2.08 |
| ISC-24 | 107.33±4.73 | 171.00±4.00 | 13.28±0.72 | 16.67±2.08 | 4.67±1.15 | 0.00±0.00 |
| ISC-25 | 159.67±6.03 | 162.33±6.66 | 11.19±2.77 | 14.00±1.00 | 21.00±2.65 | 29.00±6.00 |
| ISC-3 | 149.00±51.86 | 149.67±18.01 | 9.03±1.05 | 11.00±4.00 | 7.00±1.73 | 1.67±1.53 |
| ISC-30 | 176.33±28.94 | 131.33±5.03 | 8.49±1.05 | 9.33±2.52 | 5.33±3.51 | 0.00±0.00 |
| ISC-31 | 180.33±3.51 | 153.00±4.58 | 7.79±0.42 | 12.67±1.15 | 12.67±3.06 | 0.00±0.00 |
| ISC-34 | 64.33±4.16 | 124.33±5.03 | 8.55±0.98 | 16.33±2.31 | 9.00±2.65 | 0.00±0.00 |
| ISC-35 | 208.33±3.06 | 170.67±8.02 | 8.61±0.31 | 31.33±2.08 | 35.33±23.86 | 12.67±2.52 |
| ISC-4 | 66.67±2.08 | 143.33±9.07 | 8.74±0.20 | 14.33±1.53 | 18.33±4.51 | 17.33±9.71 |
| ISC-40 | 181.67±8.50 | 139.00±4.00 | 10.99±1.66 | 14.00±2.00 | 16.67±1.15 | 0.00±0.00 |
| ISC-42 | 191.33±37.50 | 124.00±10.44 | 8.77±0.74 | 14.33±2.52 | 32.00±3.61 | 43.67±12.22 |
| ISC-46 | 158.33±20.26 | 148.00±3.00 | 9.50±1.15 | 8.00±1.00 | 6.33±2.08 | 0.00±0.00 |
| ISC-51 | 142.00±9.00 | 141.33±8.62 | 11.25±0.75 | 11.00±1.73 | 7.00±2.00 | 0.00±0.00 |
| ISC-63 | 188.33±40.05 | 161.67±8.08 | 13.29±0.47 | 19.00±4.00 | 33.00±6.08 | 47.67±4.04 |
| ISC-66 | 134.00±10.82 | 152.67±3.51 | 8.72±0.09 | 10.33±1.53 | 10.00±2.00 | 0.00±0.00 |
| ISC-76 | 165.67±15.82 | 154.00±10.58 | 7.29±0.46 | 12.67±2.52 | 8.33±2.08 | 0.00±0.00 |
| ISC-77 | 158.00±12.77 | 168.00±5.57 | 8.35±0.51 | 18.00±3.00 | 20.67±2.08 | 10.67±2.08 |
| ISC-78 | 171.00±35.79 | 171.00±9.17 | 8.98±0.60 | 24.33±2.08 | 25.00±6.00 | 0.00±0.00 |
| ISC-82 | 118.33±23.54 | 146.33±6.66 | 7.96±0.89 | 11.67±5.69 | 20.00±7.00 | 19.33±9.45 |
| ISC-84 | 99.00±13.45 | 124.67±2.52 | 7.61±0.49 | 7.33±1.53 | 5.00±2.00 | 0.00±0.00 |
| ISC-86 | 145.00±6.00 | 169.33±6.81 | 8.161.29 | 25.67±2.08 | 16.67±4.16 | 0.00±0.00 |
| ISC-91 | 69.00±4.36 | 143.00±7.21 | 8.04±0.06 | 15.67±2.08 | 8.67±5.03 | 0.00±0.00 |
| ISC-95 | 174.00±15.52 | 166.33±9.29 | 9.50±0.40 | 36.33±5.03 | 15.33±1.53 | 4.00±3.61 |
| Minimum | 54.00 | 116.33 | 6.06 | 3.67 | 3.33 | 0.00 |
| Maximum | 261.67 | 221.67 | 13.58 | 36.33 | 35.67 | 47.67 |
| Mean | 147.98 | 149.21 | 9.01 | 14.94 | 16.76 | 8.81 |
| Std. Deviation | 45.76 | 22.69 | 1.62 | 6.45 | 9.57 | 13.24 |
| CoV | 30.92 | 15.20 | 17.93 | 43.18 | 57.06 | 150.33 |
| F (51, 104) | 17.08** | 22.28** | 9.08** | 17.33** | 11.08** | 25.43** |
PHT: Plant Height (cm); D50M: Days of 50% Maturity; SDWT: 100 Seed Weight (g); PBRCH: Number of primary Branches; SBRCH: Number of Secondary Branches; TBRCH: Number of Tertiary Branches
The evaluation of the qualitative characters showed that the evaluated traits were polymorphic among sampled pigeonpea accessions (Table 5). A total of 20 accessions had green leaf colour; one was light green (1SC-129), and 31 had dark green, while 40 accessions had light yellow base flower colour; 9 accessions had yellow colour, and 3 accessions (ISC-136, ISC-186, ISC-91) had ivory base flower colour. The dominance of the green colouration reported in this study corroborates the reports of Manyasa et al. (2008) and Kimaro et al. (2021). The pattern of streaks was sparse in 29 accessions, less sparse in 8 accessions, dense in 2 accessions, less dense in 7 accessions, medium in 4 accessions, and uniform in 2 accessions (ISC-24, ISC-133). The flowering patterns were determinate in 10 accessions, semi-determinate in 9 accessions, and indeterminate in 33 accessions. The dominant flowering pattern within the accessions studied was indeterminate, which agrees with the result of Upadhaya et al. (2014) who also reported dominance of an indeterminate flowering pattern in pigeonpea in their study. Leaflet shape is narrow-elliptic for 34 accessions, broad-elliptic for 12 accessions, and lanceolate for 6 accessions; leaflet hairiness is glabrous for all 52 accessions. Growth habit was spreading for 30 accessions, semi-spreading for 18 accessions, erect and compact for 4 accessions. Spreading was the dominant growth habit among 54% of the Nigerian pigeonpea accessions evaluated. This is in proximity with the work of Zavinon et al. (2019) who reported the dominance of compact and erect (55.68%) growth habits in Beninese pigeonpea landraces collection.
All accessions had green stem colour. The pod colour was mixed green and purple for 35 accessions, green for 14 accessions, purple for 2 accessions, and dark purple for 1 accession. Mixed pod colour was dominant in this study which does not corroborate the report of Upadhaya et al. (2010) who observed a dominant green colour for pod colour and was the most preferred pod colour by consumers and traders. The pod form is flat for 23 accessions and cylindrical for 29 accessions (Table 5). Leaf hairiness was glabrous in all of the accessions with no pubescence, similar to reports by Sahu et al. (2018).
Table 5 Qualitative morphological characters evaluated.
| Accession | LC | BFC | PS | FP | LS | LH | GH | SC | PC | PF |
| ISC-107 | G | LY | SSp | ID | NE | G | S | GB | P | C |
| ISC-11 | G | LY | SSp | ID | BE | G | S | GB | MGP | F |
| ISC-111 | DG | Y | SSp | ID | NE | G | S | GB | MGP | F |
| ISC-115 | DG | LY | LSS | SD | L | G | SS | GB | MGP | F |
| ISC-118 | DG | Y | SSp | ID | NE | G | SS | GB | MGP | F |
| ISC-120 | DG | Y | SSp | D | NE | G | SS | GB | G | C |
| ISC-123 | G | LY | UC | ID | NE | G | S | GB | MGP | C |
| ISC-124 | DG | LY | LSS | D | NE | G | EC | GB | MGP | F |
| ISC-129 | LG | LY | SSp | D | NE | G | SS | GB | MGP | F |
| ISC-131 | DG | LY | SSp | ID | NE | G | SS | GB | MGP | F |
| ISC-133 | G | LY | LDS | SD | L | G | SS | GB | G | F |
| ISC-136 | G | I | MS | ID | NE | G | S | GB | MGP | F |
| ISC-140 | DG | Y | LSS | D | BE | G | EC | GB | MGP | C |
| ISC-158 | G | LY | SSp | ID | BE | G | S | GB | P | C |
| ISC-168 | G | LY | LSS | SD | BE | G | SS | GB | MGP | F |
| ISC-169 | DG | LY | SSp | ID | NE | G | S | GB | G | C |
| ISC-171 | G | LY | SSp | ID | NE | G | S | GB | MGP | C |
| ISC-172 | DG | LY | LDS | ID | NE | G | SS | GB | G | C |
| ISC-174 | DG | LY | SSp | D | NE | G | S | GB | MGP | C |
| ISC-176 | DG | LY | SSp | ID | NE | G | SS | GB | MGP | C |
| ISC-178 | DG | LY | SSp | ID | NE | G | SS | GB | MGP | C |
| ISC-179 | DG | Y | LDS | SD | L | G | SS | GB | G | F |
| ISC-183 | G | LY | MS | ID | NE | G | S | GB | G | C |
| ISC-184 | G | LY | SSp | SD | NE | G | S | GB | MGP | F |
| ISC-185 | DG | LY | SSp | D | NE | G | EC | GB | MGP | C |
| ISC-186 | DG | I | MS | D | NE | G | EC | GB | G | C |
| ISC-2 | DG | LY | SSp | ID | NE | G | S | GB | DP | C |
| ISC-201 | DG | LY | LSS | ID | L | G | S | GB | G | C |
| ISC-202 | G | LY | SSp | D | L | G | S | GB | G | F |
| ISC-23 | G | LY | SSp | ID | NE | G | S | GB | MGP | F |
| ISC-24 | DG | LY | UC | ID | BE | G | SS | GB | MGP | F |
| ISC-25 | DG | LY | DS | SD | NE | G | S | GB | MGP | C |
| ISC-3 | G | LY | SSp | ID | L | G | S | GB | MGP | F |
| ISC-30 | DG | Y | LDS | ID | BE | G | S | GB | MGP | F |
| ISC-31 | DG | Y | SSp | ID | NE | G | S | GB | MGP | F |
| ISC-34 | DG | LY | LDS | ID | NE | G | S | GB | MGP | C |
| ISC-35 | DG | LY | SSp | ID | NE | G | S | GB | MGP | F |
| ISC-4 | DG | LY | LSS | D | BE | G | SS | GB | MGP | C |
| ISC-40 | DG | LY | MS | ID | BE | G | SS | GB | MGP | F |
| ISC-42 | DG | LY | LDS | ID | BE | G | S | GB | MGP | C |
| ISC-46 | DG | LY | SSp | ID | NE | G | S | GB | MGP | F |
| ISC-51 | DG | LY | LSS | SD | NE | G | S | GB | MGP | C |
| ISC-63 | G | LY | LDS | ID | NE | G | S | GB | G | C |
| ISC-66 | G | LY | SSp | ID | NE | G | SS | GB | G | F |
| ISC-76 | G | LY | SSp | ID | NE | G | S | GB | MGP | C |
| ISC-77 | G | Y | SSp | SD | BE | G | S | GB | G | C |
| ISC-78 | G | LY | SSp | ID | NE | G | SS | GB | MGP | C |
| ISC-82 | DG | LY | SSp | SD | NE | G | S | GB | MGP | C |
| ISC-84 | G | LY | SSp | ID | NE | G | SS | GB | G | C |
| ISC-86 | DG | Y | SSp | ID | NE | G | S | GB | G | C |
| ISC-91 | DG | I | LSS | D | BE | G | SS | GB | MGP | F |
| ISC-95 | G | LY | DS | ID | BE | G | S | GB | MGP | C |
DG: dark green, G: green, LG: light green, LY: light yellow, I: Ivory, Y: yellow, DS: dense streaks, LSS: less sparse seeds, SSp: sparse streaks, ID: indeterminate, D: determinate, SD: semi-determinate, UC: uniform coverage, LDS: less dense streak, NE: narrow elliptic, BE: broad elliptic, GB: glabrous, SS: semi-spreading, S: spreading, EC: Erect and compact, MGP: mixed green and purple, P: purple, F: flat, C: cylindrical, BFC: base flower colour, PS: pattern of streaks, FP: flowering pattern, LS: leaflet shape, LH: leaf hairiness, GH: growth habit, SC: stem colour, PC: pod colour, PF: pod form, LC: leaf colour.
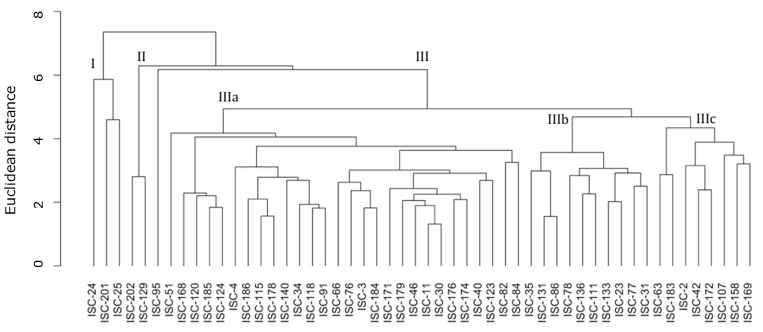
Cluster analysis among Nigerian pigeonpea accessions. Three major groups were observed when all accessions were clustered based on the quantitative traits evaluated with a cluster correlation coefficient of 0.81 (Figure 1). Both Cluster I contained three accessions (ISC-24, ISC-201 and ISC-25) while two accessions (ISC-129 and ISC-202) were observed in Cluster II. Cluster III comprised 90% of the accessions evaluated sub-divided into three subclusters (Cluster IIIa-c). The first subcluster, cluster IIIa has 28 accessions; cluster IIIb has 10 accessions while cluster IIIc comprises 8 accessions. ISC-95 accession in Cluster III was not grouped under any of the three subclusters.
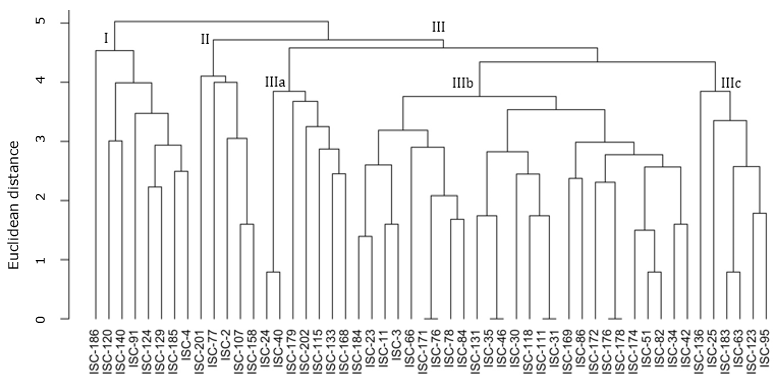
Similarly, the hierarchical clustering of evaluated pigeonpea accessions based on qualitative traits revealed three clustered groups with a cluster correlation coefficient of 0.67 (Figure 2). Clusters I and II had 8 and 5 accessions, respectively. Cluster III contains three sub-clusters, with cluster IIIa having 7 accessions; cluster IIIb having 26 accessions, and cluster IIIc having 6 accessions. Accessions, ISC-171 and ISC-76, ISC-35 and ISC-46, ISC-111 and ISC-31, ISC-176 and ISC-178 show similar qualitative appearance in the study, hence clustered together as shown in Figure 2. This is an indication of low variability in the qualitative traits observed among these accessions.
Also, three clustered groups were observed among the evaluated 52 pigeonpea accessions when both quantitative and qualitative characters were combined using the hierarchical clustering method with a cluster correlation coefficient of 0.78 (Figure 3). Cluster I had four accessions (ISC-201, ISC-25, ISC-24, and ISC-95).
Cluster II consist of two accessions, ISC-129 and ISC-202, while Cluster III contained three sub-clusters (IIIa-c) accommodating more than 80% of the accessions used in the study. Cluster IIIa had 7 accessions; cluster IIIb had 8 accessions; and cluster IIIc had 30 accessions (Figure 3).
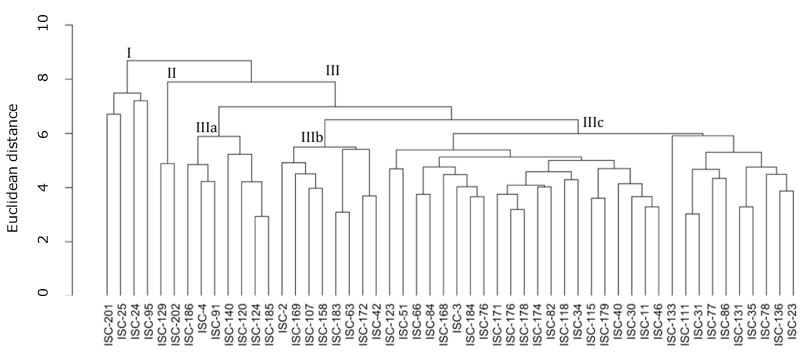
Figure 3 Clustering of the 52 pigeonpea accessions evaluated based on both quantitative and qualitative traits.
The morphological dendrogram generated from the distance matrix provided an overall pattern of variation as well as the degree of relatedness among the collected accessions. The cluster analysis conducted using these traits grouped the accessions into three clusters, regardless of whether quantitative, qualitative or combine traits were used, indicating sufficient variability to warrant selection. Manyasa et al. (2008) classified 123 Tanzanian pigeonpea genotypes into six clusters. Ayenan et al. (2017) observed 49 Beninese pigeonpea genotypes grouped into 10 phenotypic clusters, while Kimaro et al. (2021) classified 48 pigeonpea genotypes into three clusters. Thus, from this study, accessions observed in these clusters were potential sources of genetic material for breeding varieties combining superior agronomic traits.
The cluster correlation is a measure of the reliability of a cluster. The closer the cluster correlation coefficient value is to 1, the more accurately the cluster solution reflects the data. Hence, values above 0.75 are good cluster reliability (Kassambara, 2017). All dendrogram clusters (r > 0.75), except the qualitative cluster analysis, are good reflectors of the diversity observed among the sampled accession. The lower cluster correlation observed when qualitative data was used might be attributed to the low variations observed among accessions.
Correlation analysis among evaluated characters. The coefficient of correlation between the thirteen quantitative characters is presented in Table 6. The study showed there was a significant positive correlation between 100-seed weight and all the evaluated traits except the number of pods, primary, secondary, and tertiary branches.
There was a significant positive correlation between vigour and plant height (r = 0.70, p < 0.01). D50F was significantly correlated with vigour (r = 0.61, p < 0.01), PDL (r = 0.21, p < 0.01), plant height (r = 0.58, p < 0.01), D50M (r = 0.89, p < 0.01), 100 seed weight (r = 0.26, p < 0.01), primary branches (r = 0.52, p < 0.01), and secondary branches (r = 0.34, p < 0.01). Similarly, D50M was significantly correlated with vigour (r = 0.58, p < 0.01), PDL (r = 0.22, p < 0.01), plant height (r = 0.52, p < 0.01), 100-seed weight (r = 0.26, p < 0.01), primary branches (r = 0.47, p < 0.01), and secondary branches (r = 0.47, p < 0.01).
Table 6 Correlation coefficient between the characters evaluated among Nigerian pigeonpea accessions
| Traits | LLNT | LLWT | VIG | D50F | PDL | PDN | SDPD | PHT | D50M | SDWT | PBRCH | SBRCH | TBRCH |
| LLNT | 1.00 | ||||||||||||
| LLWT | 0.80** | 1.00 | |||||||||||
| VIG | 0.14 | -0.01 | 1.00 | ||||||||||
| D50F | 0.00 | -0.13 | 0.61** | 1.00 | . | ||||||||
| PDL | 0.34** | 0.19* | 0.22** | 0.21** | 1.00 | ||||||||
| PDN | -0.04 | -0.06 | 0.158* | 0.10 | -0.15 | 1.00 | |||||||
| SDPD | 0.11 | 0.13 | 0.04 | 0.14 | 0.21* | -0.06 | 1.00 | ||||||
| PHT | 0.12 | -0.05 | 0.70** | 0.58** | 0.26** | 0.34** | 0.13 | 1.00 | |||||
| D50M | -0.08 | -0.19* | 0.58** | 0.89** | 0.22** | 0.04 | 0.11 | 0.52** | 1.00 | ||||
| SDWT | 0.34** | 0.26** | 0.30** | 0.26** | 0.43** | -0.07 | 0.25** | 0.31** | 0.26** | 1.00 | |||
| PBRCH | 0.07 | 0.04 | 0.42** | 0.52** | 0.07 | 0.14 | 0.05 | 0.39** | 0.47** | 0.04 | 1.00 | ||
| SBRCH | 0.05 | 0.10 | 0.24** | 0.34** | 0.19* | 0.24** | 0.16* | 0.39** | 0.31** | 0.12 | 0.38** | 1.00 | |
| TBRCH | 0.08 | 0.21** | 0.06 | 0.08 | 0.24** | 0.01 | 0.26** | 0.14 | 0.06 | 0.17* | 0.05 | 0.67** | 1.00 |
*, ** Significant at p < 0.05 and p < 0.01; LLNT: Leaf length; LLWT: Leaflet width; VIG: Vigour at 50% flowering; D50F: Days to 50% Flowering; PDL: Pod Length; PDN: Number of Pod; SDPD: Number of Seed Per Pod; PHT: Plant Height; D50M: Days of 50% Maturity; SDWT: 100 Seed Weight; PBRCH: Number of primary Branches; SBRCH: Number of Secondary Branches; TBRCH: Number of Tertiary Branches
Principal component analysis. At an eigenvalue greater than 1, four PCAs were identified explaining 68.95% of the total variation observed among the Nigerian pigeonpea accessions (Table 7). The study showed that PC1 accounted for most of the variability (PC1 = 30.13%) observed in the study and was associated with yield traits which include days to 50% flowering, plant height, days to 50% maturity and vigour at 50% flowering with 0.77, 0.83, 0.79, and 0.78 loadings, respectively. PCA 2 accounted for 17.74% of the total phenotypic variation with leaflet length and leaflet width characters as major contributors to the PC. PC3 accounted for 11.38% of the phenotypic variation observed with the number of secondary branches and tertiary branches contributing majorly to the PC (Table 7).
Table 7 Principal component analysis of characters evaluated among Nigerian pigeonpea accessions.
| Principal Component | 1 | 2 | 3 | 4 |
| Eigenvalue | 3.92 | 2.31 | 1.48 | 1.26 |
| Percentage Variance (%) | 30.13 | 17.74 | 11.38 | 9.71 |
| Cumulative % | 30.13 | 47.86 | 59.24 | 68.95 |
| Leaflet Length | 0.22 | 0.79 | -0.28 | 0.38 |
| Leaflet width | 0.09 | 0.83 | -0.08 | 0.38 |
| Vigour at 50% flowering | 0.77 | -0.16 | -0.26 | 0.15 |
| Days to 50% flowering | 0.83 | -0.30 | -0.17 | -0.11 |
| Pod length | 0.43 | 0.46 | -0.16 | -0.34 |
| Pod number | 0.21 | -0.24 | 0.31 | 0.64 |
| Seeds per pod | 0.27 | 0.32 | 0.18 | -0.42 |
| Plant height | 0.79 | -0.14 | -0.04 | 0.19 |
| Days to 50% maturity | 0.78 | -0.34 | -0.19 | -0.21 |
| 100 seed weight | 0.47 | 0.45 | -0.27 | -0.23 |
| Primary branches | 0.61 | -0.20 | 0.02 | 0.25 |
| Secondary branches | 0.59 | 0.10 | 0.70 | 0.05 |
| Tertiary branches | 0.33 | 0.37 | 0.74 | -0.21 |
Interestingly, significant strong positive correlation coefficients were found among these yield-associated traits observed to contribute to the PC1, which was similar to that observed by Sreelakshmi et al. (2011). A significant strong correlation between yield and yield components implies that it would be possible to simultaneously improve the correlated traits during crop improvement or breeding programmes (Upadhaya et al., 2014).
Hence, important quantitative traits to characterize pigeonpea germplasm should be yield characters (Kimaro et al., 2021). Since there is a dearth of information concerning improved Nigerian pigeonpea varieties and improvement programmes are in their infancy (Fatokimi & Tanimonure, 2021), some of these accessions can be selected for or incorporated into the agronomic improvement of the Nigerian pigeonpea germplasm. Accessions ISC-11, 34, 42, 84, 115, 118, 124, 140, 172, 186, 185, 171, 174, 176, and 178 are good candidate materials for breeding early maturing varieties; accessions ISC-23, 31, 40, 78, 77, 82, 84, 111, 133, 136, and 171 are good candidates for breeding higher pod number; accessions ISC-24, 25, 40, 51, 63, 183, 158, 201, and 202 are good materials for breeding higher seed weight; accessions ISC-3, 4, 11, 25, 30, 40, 42, 51, 63, 66 78, 95, 107, 118, 123, 183, 172, 184, 201, and 202 are good materials for breeding longer pod lengths in pigeonpea. Interestingly, some of these accessions can be used to breed more than one agronomical trait. ISC-40 can be incorporated into breeding for pod number, seed weight, and pod length; ISC-84 and ISC-171 for both early maturity and pod number; ISC-11 and ISC-118 for both early maturity and pod length; ISC-51, 63, 201, and 202 for seed weight and pod length, and ISC-78 for pod number and pod length. Alternately, these accessions can be improved for underperforming yield traits.
CONCLUSIONS
Our findings revealed a wide range of morphological variations both with quantitative and qualitative traits evaluated. The first PCA was associated with yield traits that strongly correlated among themselves. Hence, the tendency for simultaneous improvement of these traits is high. The study also identified several potential accessions, interestingly clustered, that can be selected for multilocational evaluations and crop improvement.

