


 English (pdf)
 Article in xml format
 Article references
 Send this article by e-mail
 Cited by SciELO
  Cited by Google
  Similars in
SciELO
Similars in
SciELO  Similars in Google
 Permalink
INTRODUCTION
The soy (Glycine max) is one of the main crops and has great socioeconomic importance in Brazilian agro-industrial complex, thus making Brazil the largest producer and exporter of soy in the world with a cultivated area of 36.950 million hectares, with a production of 124,845 million tons, and productivity of 3,379 kg ha-1 (Embrapa, 2020). Soybean development is influenced by several environmental factors, such as temperature, soil moisture, precipitation, relative humidity, but the factor that most influences is the sowing period (Silva et al., 2020).
Soybeans can reach their maximum productivity when 800 mm of water is supplied throughout their cycle, changes in climatic factors in some periods of the year can lead to water shortages and thus affect the development of the plant (Bortoluzzi et al., 2020). During growing seasons, droughts result in large losses in productivity, and thus result in lower financial income. These losses are directly linked to the damage caused by drought, which directly influences the reduction in the size and number of new branches at the beginning of the crop's establishment, which starts to influence the reproductive phase of the plant and the drop in the number of pods (Viçosi et al., 2017).
Water deficit is an abiotic condition where plant growth is water-restricted, reducing the osmotic potential of cells in the total leaf, which affects transpiration through the stomatal pathway, as a result of disturbances in the physiology of the plant caused by water restriction, modify the planting planning of the crop (Naoe et al., 2020; Nadal et al., 2020; Lavergne et al., 2020). One of the main changes in plant physiology is the reduction in the concentration of chlorophylls after the plant is under water stress for a long period, which affects the rate of photosynthesis and consequently carbon fixation in the dry mass of the plant, and thus, leaf area index and plant height are harmed due to this stress (Lawes et al., 2019).
When different varieties of plants are under water deficit, the plants begin to present physiological changes to reduce the effects of drought, starting to use osmotic control mechanisms of tolerance of the stomatal guard cells, which reflect on the tension of the membranes of the stomatal guard cells, which makes it possible to directly close the stomatal cleft. When stress lasts for a long period, stomatal structures may undergo changes in the size of the guard cells, which then start to reflect on stomatal functionality and conductance, which provides less water loss to the environment (Rockwell & Holbrook, 2017). There is a variation in the osmotic adjustment, which shows the crop's ability to withstand drought, in soybean crop it has a low osmotic adjustment capacity, which can cause plant death if the water stress is very intense and long-lasting (Morando et al., 2014).
Thus, the objective of this work was to evaluate the morphophysiological responses and development of soybean cultivars when grown under irrigation intervals.
MATERIAL AND METHODS
The experiment was carried out in January 2021, in a greenhouse on a rural property, located in the municipality of Lavínia, state of São Paulo, at geographic coordinates 21°10'17.739"S and 51°4'29.303" W and with altitude of 402 meters. The greenhouse was covered with light-diffusing plastic film with a thickness of 1000 microns, under controlled conditions (the temperature in the greenhouse during plant growth varied between 25.1°C (minimum) and 34.7°C (maximum) and had an average of 29.9°C. The average relative humidity of the air was 60% ±5%, and the maximum flux density of photosynthetic photons (sunlight) was approximately 2,000 μmol photons m-2 s-1 at the leaf level.
The design was completely randomized, in a 2x5 factorial scheme, with two soybean cultivars, M7110IPro (Monsoy®) and Desafio RR8473RSF (Brasmax®), interacting with the irrigation intervals being: 24 hours (Control); 48 hours; 72 hours, 96 hours and 120 hours making ten treatments with four repetitions, totaling 40 plots or vessels.
The pots contained a volumetric capacity of nine dm3 and were filled with soil originating from the 0-0.3 m layer classified as a Luvisol (FAO - Food and Agriculture Organization & UNESCO - Organización de las Naciones Unidas, 1974) and had the following chemical attributes, as shown in Table 1.
Table 1 Chemical attributes of the soil used in the experiment.
| pH | OM | P | K | Ca | Mg | H+Al | Al | SB | CTC | V% | m% |
|---|---|---|---|---|---|---|---|---|---|---|---|
| CaCl2 | g dm-3 | mg dm-3 | -------------------------- mmolc dm-3 ------------- | ||||||||
| 4.6 | 8 | 25 | 3.5 | 9.0 | 4.0 | 23 | 1 | 16.6 | 39.6 | 42 | 5.68 |
| OM: organic matter; SB: Sum of bases; V%: Base saturation; m%: Saturation by aluminum. | |||||||||||
The soil was fertilized according to the requirements of the soybean crop, according Raij et al. (1996) , and then five viable seeds were sown five centimeters deep. At the V4 stadium, the best plant was selected to compose each parcel. During the conduction of the experiment, the pots were irrigated until reaching the field capacity and all cultural treatments were carried out.
At the phenological R5.1 stage the leaflets of the first fully expanded trefoil were chosen from the apex of the plant, where the following parameters were determined: contents of Chlorophyll-a and Chlorophyll-b (ChlA and ChlB - µmol m-2), through direct reading with the use of the device clorofiLOG, brand Falker®, given the index values SPAD (Parry et al., 2014) and subsequently converted into absolute values of the pigments as described by Chang & Troughton (1972). The organic nitrogen content (N-org. - dag kg-1) in leaves was also estimated according to Sant’Ana et al. (2010).
Printing was also performed on the lower or abaxial epidermal face of leaf fragments collected using cyanoacrylate ester, for determining the stomatal functionality of the lower or abaxial face (SF) and stomatal density (SD) of the lower or abaxial face (Segatto et al., 2004; Castro et al., 2009). For all variables, 10 measurements were made per slide and the plots were represented by the average value obtained from the measurements of each characteristic.
To understand the development of the crop, the plant height was determined (PH) determined by the aid of a ruler graduated in millimeters; number of leaflets (NL) and number of pods (NP) obtained through direct counting at the plant. The following were determined: dry mass of the aerial part (DMAP) and dry mass of root (DMR) where they were dried in an oven with circulation and air renewal at 65˚C until they reach constant weight.
All variables were subjected to the F test (p<0.05) and regression analysis was applied to the irrigation shifts, where their models were tested: linear; quadratic and cubic, while for soybean cultivars the Tukey test was applied at a 5% probability of the event occurring (Banzatto & Kronka, 2013) and the statistical program was used RStudio (Rstudio Team, 2019).
RESULTS AND DISCUSION
There was no statistical difference between soybean cultivars for chlorophyll A content (ChlA) and chlorophyll B (ChlB), however, when the plants were subjected to irrigation intervals, they presented a negative linear response as shown in Table 2 and Figure 1. It is important to analyze the amount of chlorophyll that are present in the leaves, as chlorophyll is linked to plant productivity, which showed a correlation between the characteristics of shoot and root dry mass, number of pods and leaves as shown in Figure 2 and Table 3, given that the low concentration of these pigments will negatively affect the photosynthetic rate, which consequently, the amount of carbohydrates that the plant can accumulate for dry mass production (Rosa et al., 2020).
Table 2 Average values of Chlorophyll a and b (ChlA and ChlB); stomatal functionality (SF); stomatal density (SD) and organic nitrogen (N-org) of soybean when grown under different irrigation intervals.
| Cultivars (C) | ChlA (µmol m-2) | ChlB (µmol m-2) | SF | SD (s/mm-2) | N-org (dag kg-1) |
|---|---|---|---|---|---|
| M7110IPro | 248.79a | 82.93a | 1.95a | 338.75a | 1.65a |
| RR8473RSF | 239.44a | 79.81a | 1.92a | 316.87a | 1.42a |
| SMD | 29.16 | 9.72 | 0.07 | 35.70 | 0.37 |
| p value | 0.5174ns | 0.5174ns | 0.3773ns | 0.2205ns | 0.2329ns |
| Intervals (I) | |||||
| 24 h | 281.68a | 93.89a | 1.86b | 359.37a | 2.08a |
| 48 h | 258.10ab | 86.03ab | 1.83b | 354.68a | 1.74ab |
| 72 h | 244.62ab | 81.54ab | 1.86b | 328.12a | 1.61ab |
| 96 h | 233.38ab | 77.79ab | 2.04a | 304.68a | 1.24ab |
| 120 h | 202.79b | 67.59b | 2.08a | 292.18a | 1.00b |
| SMD | 65.48 | 21.82 | 0.16 | 80.17 | 0.84 |
| p value | 0.0217* | 0.0217* | 0.0001** | 0.0812ns | 0.0076* |
| p value C x I | 0.8314ns | 0.8314ns | 0.0527ns | 0.4164ns | 0.5653ns |
| CV (%) | 18.49% | 18.49% | 5.80% | 16.86% | 37.84% |
| OA | 244.11 | 81.37 | 1.93 | 327.81 | 1.53 |
| Regression | |||||
| p value | 0.0007** | 0.0007** | 0.0001 | 0.7692ns | 0.0002** |
| Model | L | L | L | --- | L |
| SMD: Minimum significant difference. CV: Coefficient of variation. OA: Overall average. Ns p = 0.05; * 0.01 ≤p<0.05; ** p<0.01. The averages in the column followed by the same letter do not differ statistically from each other in the Tukey test was applied at a 5% probability. L: Polynomial of the 1st degree. | |||||
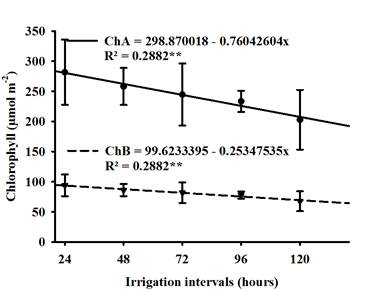
Figure 1 Regression of Chlorophyll a and b (ChlA and ChlB) of soybean when grown under different irrigation intervals.
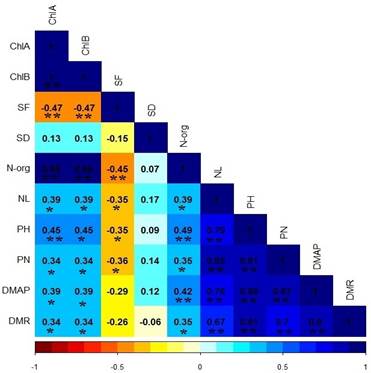
Figure 2 Correlation of Pearson between the parameters evaluated in soybean grown at different irrigation intervals.
Table 3 Matrix of significant linear regressions of Pearson interactions of the variables analyzed in soybean cultivars when grown in different irrigation intervals.
| y= | a+bx | p valor | R2 |
|---|---|---|---|
| DMAP | -5.9203040 + 0.36321124PH | 0.0001** | 0.7818 |
| -3.0309922 + 0.02273475ChlB | 0.0129* | 0.1534 | |
| 3.0309922 + 0.06820425ChlA | 0.0129* | 0.1534 | |
| -0.2054551 + 1.77010596N-org. | 0.0079** | 0.1757 | |
| -2.3042227 + 0.47402680NL | 0.0001** | 0.5828 | |
| -0.7249560 + 0.38164188NP | 0.0001** | 0.7548 | |
| 0.16649466 + 2.74344646DMR | 0.0001** | 0.6424 | |
| NP | -9.2023670 + 0.76187547PH | 0.0001** | 0.6638 |
| -2.5275516 + 0.04517279ChlA | 0.0303* | 0.1169 | |
| -2.5275516 + 0.13551837ChlB | 0.0303* | 0.1169 | |
| 3.79846669 + 5.48283768DMR | 0.0001** | 0.4951 | |
| 37.2686261 - 14.8316126SF | 0.0204* | 0.1331 | |
| 6.13004763 + 2.62804632N-org. | 0.0151* | 0.1494 | |
| -3.7499304 + 1.20392436NL | 0.0001** | 0.7254 | |
| PH | 7.71301975 + 0.06358460ChlA | 0.0032** | 0.2025 |
| 7.71301975 + 0.19075379ChlB | 0.0032** | 0.2025 | |
| 52.5870637 - 15.1322739SF | 0.0315* | 0.1212 | |
| 17.4197186 + 6.78196081DMR | 0.0001** | 0.6625 | |
| 15.4445741 + 5.06168066N-org. | 0.0015** | 0.2425 | |
| 11.0561960 + 1.19695862NL | 0.0001** | 0.6270 | |
| NL | 1.35903842 + 0.03611333ChlA | 0.0152* | 0.1493 |
| 1.35903841 + 0.10833998ChlB | 0.0152* | 0.143 | |
| 29.8414256 - 10.1389898SF | 0.0281* | 0.1243 | |
| 7.00610203 + 3.69550783DMR | 0.0001** | 0.4494 | |
| 6.13004763 + 2.62804632N-org. | 0.0151* | 0.1494 | |
| SF | 2.30965043 - 0.00151552ChlA | 0.0024** | 0.2174 |
| 2.30965043 - 0.00454656ChlB | 0.0024** | 0.2174 | |
| 2.10312721 - 0.10619138N-org. | 0.0042** | 0.2017 | |
| ChlA | 226.753157 + 20.2521122DMR | 0.0227* | 0.1179 |
| -2.139E-08 + 3.0000000ChlB | 0.0001** | 0.9999 | |
| 137.960823 + 68.9722603N-org. | 0.0001** | 0.8988 | |
| ChlB | 45.9869411 + 22.9907534N-org. | 0.0001** | 0.8988 |
| 75.5843857 + 6.75070405DMR | 0.0227* | 0.1179 | |
| N-org. | 1.29843818 + 0.28071121DMR | 0.0206* | 0.1199 |
No difference was observed between soybean cultivars for stomatal functionality (SF), but the irrigation intervals had a positive influence as shown in Figure 3, where the 72-hour period caused an increase of approximately 9.0% compared to the 96-hour period, which had the lowest functionality. Due to the property of the relationship between the polar and the equatorial diameter, the guard cells became flaccid, thus altering the elasticity of the cells (Nadal et al., 2020), which resulted in a smaller equatorial diameter, which consequently the ostiole remained closed so that the leaf water potential is constant inside the leaf (Lavergne et al., 2020), this phenomenon can be clearly seen in Figure 4.
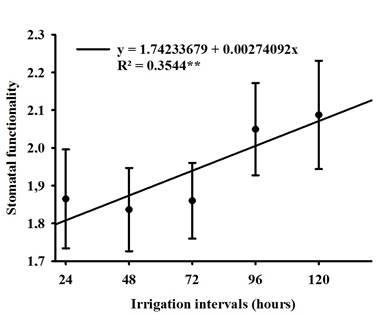
Figure 3 Regression of stomatal functionality (SF) of soybean when grown under different irrigation intervals.
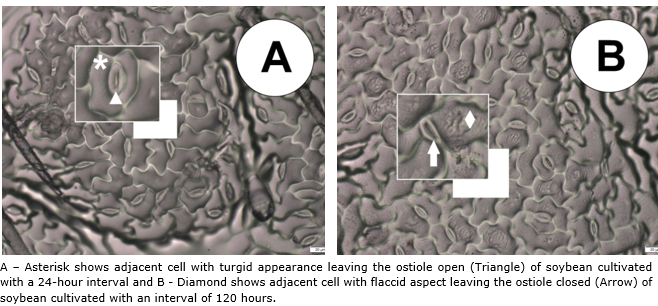
Figure 4 Epidermis impression of the abaxial face of soybean leaves when cultivated at different irrigation intervals.
It is also worth highlighting that stomatal functionality showed decreasing correlations with the characteristics PH, NL and NP (Figure 2 and Table 3), due to the reduction in gas exchange with the environment and the CO2 assimilation rate is compromised, which begins to reflect on the synthesis of carbohydrates during photosynthesis (Sack & Buckley, 2016; Rockwell & Holbrook, 2017).
The factors did not influence the stomatal density (SD) of soybean when cultivated in different irrigation intervals. In situations of water restriction, leaves tend to take advantage of the short period of high relative humidity of the day to carry out gas exchange, where a greater number of stomata per area can make this phenomenon more efficient, which corroborates the results found (Rui & Anderson et al., 2016; Chater et al., 2017).
Soybean cultivars did not differ statistically for org-N concentration. However, it was linearly negatively influenced by the irrigation intervals Figure 5, water restriction affected the absorption of inorganic N present in the soil which may have been influenced by the reduction dry mass of root (DMR), as these characteristics show correlations as shown in Figure 2 and Table 3, as water is a limiting factor for organic nitrogen biosynthesis (Lawes et al., 2019).
It is noteworthy that nitrogen starts to compose the main proteins of the plant, which in this way its deficiency implies in the physiological disarrangement of the plant, mainly in the photosynthetic rate, as the chlorophyll molecule has four N atoms around one magnesium atom, thus In this way, the low availability of water affected chlorophyll and thus reflected the low concentration of Nitrogen as demonstrated in this work (Taiz et al., 2017; Lisboa et al., 2021).
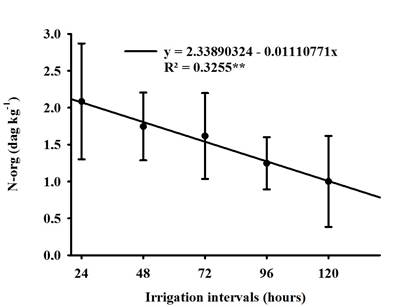
Figure 5 Regression of organic nitrogen (N-org) of soybean when grown under different irrigation intervals.
Soybean cultivars showed different responses for plant height (PH) when grown in different irrigation intervals, where M7110IPro was superior by approximately 11.52% in relation to RR8473RSF (Table 4), therefore, it is important to select the differences in the responses of soybean cultivars when subjected to water restriction, as plant height is a fundamental characteristic for the efficiency of mechanized harvesting, as taller plants tend to have greater height of the first branch, and thus, facilitates mechanized harvesting (Cavalcante et al., 2020).
Irrigation intervals had a negative quadratic influence on plant height, where the minimum point was approximately 96 hours, with the increase in this period, plant heights were reduced by approximately 50% when compared to the 24-hour interval, as seen in Figure 6A, and this difference in plant height can be observed in the Figure 7, it is also worth highlighting that there was a gradual reduction in the size of soybean plants, this result was a reflection of the water stress that the plants suffered, where the plants, when exposed to long periods of low water availability in the soil, begin to express the enzymes that act on oxidative stress to minimize these negative effects (Katam et al., 2020) and also influences the efficiency of the RuBisCo molecule in the Calvin Cycle in carbon fixation (Das et al., 2016).
Table 4 Average values plant height (PH); number of leaflets (NL); number of pods (NP); dry mass of the aerial part (DMAP) and dry mass of root (DMR) of soybean when grown under different irrigation intervals.
| Cultivars (C) | PH (cm) | NL | NP | DMAP (g) | DMR (g) |
|---|---|---|---|---|---|
| M7110IPro | 24.65a | 10.35a | 9.20a | 3.12a | 0.75a |
| RR8473RSF | 21.81b | 10.00a | 7.80a | 1.91b | 0.95a |
| SMD | 2.18 | 1.68 | 1.98 | 0.58 | 0.31 |
| p value | 0.0124* | 0.6745ns | 0.1598ns | 0.0002** | 0.1938ns |
| Intervals (I) | |||||
| 24 hours | 34.56a | 17.37a | 19.25a | 7.42a | 2.20a |
| 48 hours | 22.53b | 10.75b | 9.50b | 2.25b | 0.46b |
| 72 hours | 21.12bc | 8.12b | 4.75c | 1.32bc | 0.52b |
| 96 hours | 17.30c | 7.12b | 4.37c | 0.71c | 0.59b |
| 120 hours | 20.65bc | 7.50b | 4.62c | 0.88c | 0.49b |
| SMD | 4.90 | 3.78 | 4.45 | 1.30 | 0.70 |
| p value | 0.0001** | 0.0001** | 0.0001** | 0.0001** | 0.0001** |
| p value C x I | 0.7666ns | 0.5840ns | 0.8956ns | 0.0008** | 0.4537ns |
| CV (%) | 14.54% | 25.64% | 36.13% | 35.74% | 56.32% |
| OA | 23.23 | 10.17 | 8.50 | 2.51 | 0.85 |
| Regression | |||||
| p value | 0.0001** | 0.0001** | 0.0001** | 0.0001** | 0.0001** |
| Model | Q | Q | Q | Q | Q |
SMD: Minimum significant difference. CV: Coefficient of variation. OA: Overall average. Ns p = 0.05; * 0.01 ≤p<0.05; ** p<0.01. The averages in the column followed by the same letter do not differ statistically from each other in the Tukey test was applied at a 5% probability. L: Polynomial of the 1st degree. Q: Polynomial of the 2st degree
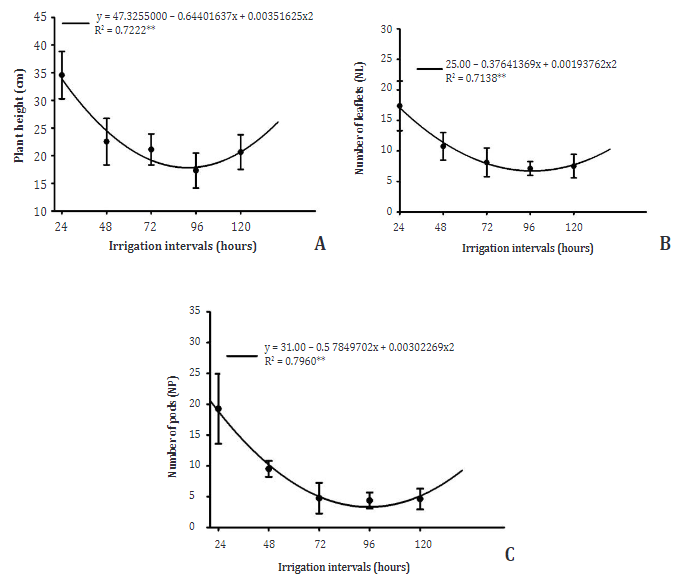
Figure 6 Regression of plant height (A); number of leaflets (B) and number of pods (NP) of soybean when grown under different irrigation intervals.
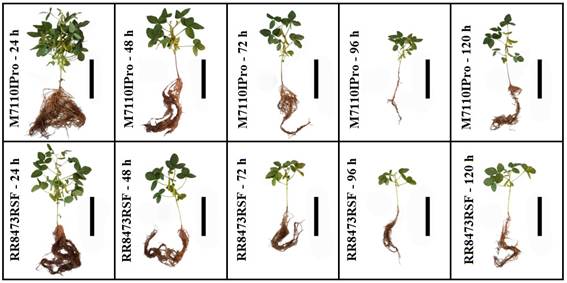
Figure 7 Soybean plants grown under different irrigation intervals, showing differences in their aerial part and root development. Bar = 15 cm.
Soybean cultivars did not differ statistically for NL (Table 4), however, a statistical difference was observed for irrigation intervals factor, where plants responded in a negative quadratic way and at 96 days the plants presented their lowest number of leaflets as shown in Figure 6B. A favorable response for plant development after 96 hours was not expected, as the longer the water stress the plant is experiencing, the more its development is affected. With the reduction in the number of leaflets, the plants present lower photosynthetic rate, which starts to negatively influence their development (Wijewardana et al., 2019), as they present correlations with the other development parameters (Figure 2 and Table 3), thus making the water deficit an important factor for decision making in crop management, demanding irrigation technologies (Suriadi et al., 2021).
For the number of pods (NP) there was no statistical difference between cultivars, however, the factor irrigation intervals was limiting for this trait, where the plants showed a negative quadratic response as shown in Figure 6C, where 95 hours was the point at which plants had lower pod numbers. These results were already expected, given that, in the phenological stage of reproduction, the plants require a large amount of water to ensure good hydration in the pollen tubes, thus ensuring greater fertilization and consequently increasing the number of grains, in addition to providing a greater filling of grains with sugars and proteins which increases their dry mass, as evidenced by the significant correlations shown in Figure 2 (Almeida et al., 2021; Wijewardana et al., 2019).
An interaction was observed between the factors studied (Table 4), where the cultivars showed negative quadratic responses with the irrigation intervals as shown in Figure 8A, where the minimum point of the M7110IPro was approximately 125 hours while the cultivar RR8473RSF presented the 124 hour minimum point for its aerial part dry mass (DMAP), this demonstrates that the two cultivars showed similarity in the water stress response.
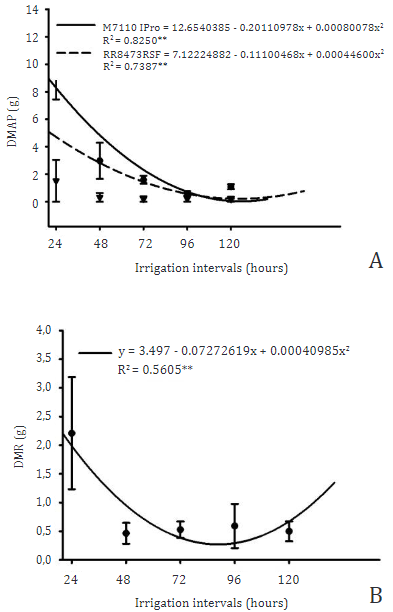
Figure 8 Regression of dry mass of the aerial part (A) and dry mass of root (B) of soybean when grown under different irrigation intervals.
Due to changes in other characteristics, this resulted in a decrease in dry mass deposition in the aerial part, as water restriction is already well proven to be a limiting factor for plant development (Agostinetto et al., 2020), mainly in the photosynthetic process, since water is the electron donor in the PSI photosystem when photolysis occurs in the oxygen reaction center, releasing oxygen molecules as a final product O2 (Taiz et al., 2017). In this way, water restriction compromises the formation of NDPH+ for the Clavin Cycle process, and thus the carbon fixation performed by the RuBisCo molecule is negatively affected and reduces the synthesis of sugars that start to provide carbon skeletons for the formation of other molecules such as proteins, nucleic acids, lipids and others (Das et al., 2016).
For dry mass of root (DMR) only the irrigation intervals factor showed a statistical difference, where soybean plants responded in a negative quadratic way with the minimum point of 88 h as shown in Figure 8B.
We didn´t expected a recover at 120 h, as wetter soils provide greater root development due to lower resistance, in addition to increasing the matrix potential of the soil (Herooty et al., 2020), with the lower availability of water, the absorption of nutrients was affected and thus reflected in the plant metabolism as presented in the concentration of chlorophylls and N-org. (Silva et al., 2019) proving this correlation through Figure 2 and Table 3.

