


 English (pdf)
 Article in xml format
 Article references
 Send this article by e-mail
 Cited by SciELO
  Cited by Google
  Similars in
SciELO
Similars in
SciELO  Similars in Google
 Permalink
INTRODUCTION
The global economy has confirmed Brazil's leading role as an agricultural commodity producer. However, several challenges overcame, such as competitiveness for producing fibers, fruits, grains, proteins, and wood and incorporating value into feedstock. Nevertheless, Embrapa (2018) appointed increases of 63% in land use and 406% in agricultural production during the 50 years from 1977-2017, confirming the fact.
Developments in soil science verified a significant change in society's thinking in the 60s regarding using natural resources since the 80s, increasing concern about environmental and ecosystem protection (Mermut & Eswaran, 2001). At the same time, resource consumption has increased worldwide, including in developed and developing countries.
From a pedological perspective, research methods and priorities advances occurred in the 1990s. While traditional surveys had lost intensity, the need for edaphic information became more significant in sustainable management, ecosystem balance, and biogeochemical cycles. Soil resources monitoring and evaluation began a new era due to the amount and quality of information produced by innovative technologies such as geographical information systems (GIS) and remote sensing. Precision Agriculture (PA) is a site-specific soil management technique combining intensive sampling and data modeling, leading to a remarkable scientific process in agriculture (Mermut & Eswaran, 2001).
The PA concept has changed over the years, from farming by the soil through variable-rate technologies and vehicle guidance systems, including product quality and environmental management (McBratney et al., 2005). Therefore, managing variability is always remarkable, whether related to agricultural production, crop performance, or environmental quality (Pierce & Nowak, 1999; Dobermann & Ping, 2004). Currently, the International Society for Precision Agriculture (ISPA) defines PA as a management strategy considering temporal and spatial variability to achieve agricultural production sustainability (ISPA-International Society for Precision Agriculture, 2018), combining technology-based information and agricultural management systems to identify, analyze, and manage variability within crops to optimize production, protect land resources, and profit.
Digital soil mapping and PA were discussed by McBratney et al. (2003), focusing on the difference in work scales. PA works with scales greater than 1:5,000 of the USDA mapping procedure. SCORPAN is a digital soil mapping model considering the pedological parameters as mathematical functions derived from soil (S), climate (C), organisms (including vegetation, animals, and humans - O), relief (R), age or time (A), and spatial location (N). The authors reviewed 66 works using equivalent digital soil mapping models from 1964 to 2003, most in developed countries with the simulation of different parameters. Some of the variables considered were clay or silt content, soil layer depth, water stocking capacity, organic matter, C, Mn, and P concentration, which were processed by several methods, as Kriging, linear regression, classification methods, principal components, and fuzzy or Bayesian logic. Therefore, if the conventional landscape analysis model explain a deductive-nomological reasoning, SCORPAN would be a new paradigm related to an inductive-statistical model oriented to digital information procedures, computers, GIS, and neural networks.
The precedent text established a narrow relation between PA and soil or soil attributes and the necessity of improving soil-mapping methods for PA applications. The recommended scale of 1:5000 or greater (McBratney et al., 2003) represents an inter-sample distance of 20 meters or less when conventional soil mapping based on traditional landform analysis appears restricted. Young & Hammer (2000) stated that the Soil Taxonomy creates classes only partially related to landforms, but with different defining constructs, more homogeneous soil classes exist.
Empresa Brasileira de Pesquisa Agropecuária (Embrapa) PA network initiated in 2009, including 200 researchers, 20 Embrapa centers, 30 private companies, and nine universities. The first validated results composed a book including 60 works, 30% thematic reviews, and 70% technical works (Bernardi et al., 2014). PA's themes included soil apparent electrical conductivity (ECa), automation, big data, geostatistics, pedology, geographic information systems, remote sensing, UAV, technology transfer, and socioeconomic impacts. If agricultural production is considered, 27% of the works described processing tools, management procedures, or field instrumental performance; 25% of the works involved cultures of grains; 20% of the works spoke about fruit culture; and the remaining works associated with pastures or integrated systems (10%) or fiber, wood, and agro-energy (18%).
A research study about the precision and digital agriculture uses in Brazil by 504 farmers showed higher interest in information and communication than in technical solutions (Bolfe et al., 2020). Using GPS, data or images from field sensors, orbital imagery, or management software was associated with 20% of farmers. Moreover, 58% of questionnaires were associated with informational software and 70% with the internet and connectivity.
This review article aims to present and discuss the most effective methods of PA from a soil management perspective, inducing advances for farming and producers in Brazil, laying the foundations for automatic digital agriculture, including artificial intelligent systems, autonomous soil sensors, and continuum climatic monitoring. The five main themes in this perspective were soil mapping, ECa, topography, proximal and remote sensing, and crop yield. The review considered 62 references from 1985 to 2021, 35% between 2000 and 2009, and 52% since 2010.
Soil mapping. The Brazilian System of Soil Classification (BSSC) started in the '70s, based mainly on the Soil Taxonomy, WRB/FAO, and France systems (Baize & Girard, 2009; Santos et al., 2018; IUSS Working Group, 2022; Soil Survey Staff, 2022). The BSSC, like other systems, considered profile sampling, which includes the sequence of soil horizons at surface and depth (Santos et al., 2018). Physical, chemical, mineralogical, morphological, and topographic characteristics of soil samples related to the local and regional environment established the soil-landscape relationships.
Soil maps are rich in information; however, the perception of some data is complex due to legend masking. Conversely, most of the data collected during soil surveys cannot be included in the analogic versions of maps. Thus, to facilitate the availability of information, digital systems are used. For example, soil information systems with a punctual structure for describing the attributes of soil profiles (Rosa et al., 2002) or spatial structure considering soil mapping units (Omuto et al., 2013) have recently been developed. Other examples in this regard are the FAO Digital Soil Map of the World (FAO, 1996), the Canadian Soil Information System - CANSIS (MacDonald & Kloosterman, 1984), and the USA National Soil Information System- NASIS (USDA - Natural Resources Conservation Service, 2021).
Digital soil maps of ten Brazilian states divided into 1:250.000 cartographic sheets (IBGE, 2021) were derived from the soil survey in scale 1:750,000 of the preterit RADAM BRASIL project (IBGE, 2018) overlying analogical Landsat images. Brazil's profile soil data compose a database, including some thousands of profiles distributed irregularly across the country, with consistency tests for positioning (Samuel-Rosa et al., 2020). These data are helpful to agricultural management on regional to global scales, for instance, for climate and soil zoning with different crops (Filippini-Alba et al., 2011; Filippini-Alba et al., 2013; Filippini-Alba et al., 2020).
Soils are central components of “terroir”, a land concept related to viticulture (Leeuwen et al., 2010). However, soil surveys can be expensive, and there is no direct relation to the type of wine, so survey methods based on geology or geomorphology can be cheaper and more efficient than traditional ones. Furthermore, agronomic variations in a vineyard occur due to scale problems in the soil units, such as small organic matter content changes or horizon thickness variations. For this reason, new technologies appeared as digital elevation models, GIS, remote sensing, or ECa to aim for an efficient survey for viticulture management.
The necessity of detailed soil attributes mapping for PA approaches explains analyzing some soil units classified by the BSSC on a local scale (Table 1). Horizontal variability is almost uniform for the same Order until the Subgroup level.
Table 1 Soil units based on BSSC in three vineyards.
| Mapping Unit | Order | Suborder | Great group | Subgroup | Other information |
|---|---|---|---|---|---|
| PBACal1 | Ultisol | Brown-gray | Alitic | Tipical | A moderate clayey soft wavy |
| PBACal2 | Ultisol | Brown-gray | Alitic | Abruptic | Medium clayey to clayey moderately wavy |
| PBACal2 | Ultisol | Brown-gray | Alitic | Abruptic | A prominent medium clayey to clayey wavy |
| CXve1 | Cambisol | Haplic | Eutrofic | Tipical | A moderate, clay loam to clayey, wavy, strong wavy, stony |
| CXve2 | Cambisol | Haplic | Eutrofic | Tipical | A moderate, clay loam to clayey, strong wavy |
| CXve3 | Cambisol | Haplic | Eutrofic | Tipical | A moderate sandy clay loam to clayey, strong wavy |
| RRh1 | Neosol | Regolitic | Humic | Tipical | Sandy clay loam to loam soft wavy |
| RRh2 | Neosol | Regolitic | Humic | Tipical | Sandy clay loam to loam soft moderately wavy |
| RRh3 | Neosol | Regolitic | Humic | Tipical | Sandy clay loam to loam wavy |
| RRh4 | Neosol | Regolitic | Humic | Tipical | Sandy clay loam to loam strong wavy |
Source: Flores et al. (2011).
Bünemann et al. (2018) pointed out two approaches related to soil quality: i) inherent to soil properties and ii) related to human management's effects and agriculture productivity. However, the definition would inform the adaptive land management in existing agricultural systems and include the soil's ability to promote plant, animal, and human health and environmental quality as regenerative agriculture in the circular economy framework.
Topographic variables. Land relief is a significant soil-forming factor following soil landform analysis (Hole & Campbell, 1985) and can affect climate, erosion processes, texture, hydrology, and biological activities. McBratney et al. (2003) pointed out that topographical variables considered by 85% of reviewed approaches of digital soil mapping, emphasizing 1:10,000 to 1:20,000 scales.
MacMillan et al. (2000) appointed a robust approach for describing and segmenting landforms directly applicable to precision farming. The model uses derivatives computed from digital elevation models and a fuzzy rule base to identify up to 15 morphologically distinct landform facets. Amatulli et al. (2018) worked on global scales with digital elevation models derived from Aster and SRTM products considering a suite of topographical variables such as elevation, slope, aspect, eastness, northness, and roughness, which allows defining ten landforms: flat, foot-slope, hollow, peak, pit, ridge, shoulder, slope, spur, and valley.
Coipel et al. (2006) studied “Grenache Noire” vines planted under stress conditions in Côtes du Rhône, France. One conclusion was that the soil type does not affect the quality of grapes; however, this property would be associated with soil depth. Filippini-Alba et al. (2017) applied PA procedures on three vineyards at “Vale dos Vinhedos”, Bento Gonçalves, RS, Brazil, concluding that the management zones could be defined through the pedological map or when a GIS integrates several information layers of the A horizon soil attributes. A different point of view was appointed in a recent article (Filippini-Alba et al., 2021) because the attributes of sub superficial horizons showed lesser variability than A horizon attributes, suggesting the influence of management procedures.
Inamasu et al. (2011) determined that the topography in concave and convex areas, due to its relation to soil, deriving in accumulation or migration of water and nutrients, respectively, as well as by the ability to define vulnerability in terms of erosion, is also a potential indicator of soil variability at low cost.
Only 13% of Embrapa's PA network applications considered altitude, with mapping used in half of the cases (Bernardi et al., 2014). A possible explanation would be that several studies, especially with grains and fibers, developed in the Cerrados, where agriculture usually affects plane or soft wavy relief areas. Irrigated rice system uses systematized areas, leveled land to facilitate irrigation management.
In a global context, the relationship between climate and land relief established a temperature decrease of about 0.5 °C for every 100 m elevation increase (Fritzsons et al., 2008). However, soil participation is more significant on a micro-scale due to a direct action of relief on the climate of soil through the undifferentiated incidence of solar radiation according to the position of slopes and the decrease of temperature with an increase in altitude, affecting living specimens as an indirect action (Flores et al., 2009).
Soil apparent electrical conductivity (ECa). Soil apparent electrical conductivity (ECa) and electrical resistivity (ER) measurements combined with Global Navigation Satellite Systems (GNSS) and GIS have been one of the most used techniques to characterize the spatial variability of soil properties (Corwin & Lesch, 2005; Samouëlian et al., 2005; Robinson et al., 2008; Serrano et al., 2014). ECa and ER show significant correlations with soil properties such as the content of clay, water, organic matter, or nutrients (Michot et al., 2003; Samouëlian et al., 2005; Machado et al., 2006; Bernardi et al., 2019).
Commercial sensors for ECa and ER measures in the field with or without ground contact are available. Electromagnetic induction (EMI) is the principle of function of some non-contact or non-invasive sensors (Corwin & Lesch, 2005). Contact sensors introduce an electrical current into the ground through electrodes on rolling discs that contact the ground and measure the electrical resistance. Commercial equipment measures the soil's ER (Samouëlian et al., 2005; Bernardi et al., 2019), and the ECa (Moral et al., 2010; Bernardi et al., 2018) can be used to delineate management zones. Different proximal sensors for soil measurements act non-destructive and minimally invasive: electromagnetic, optical, mechanical, acoustic, and electrochemical (Adamchuk et al., 2004; Molin & Tavares, 2019).
Sudduth et al. (2005) measured in the USA the soil ECa in 12 areas cultivated with soybean and corn in texture, geology, and mineralogy in different soils with two equipment: the EM38 (no contact sensor) and the Veris 3100 (rolling metallic disks). The superficial texture changed according to the state: Michigan (loam), Wisconsin (silt loam), Iowa (loam to clay loam), Illinois, Missouri, and South Dakota (silt loam to silty clay loam). Subsoil texture was even more variable, ranging from loamy sand (Michigan) to clay (Missouri). The soil ECa replied differently, depending on the instrument. The lowest correlation coefficient occurred between Veris shallow and EM38. The correlations between the ECa, clay content, and cationic change capacity (CEC) were the most significant. Conversely, the correlations with soil moisture, silt or sand content, and organic carbon were lower and more variable.
Yield data integrated into soil ECa map in grain crops or wine grape farms in Australia suggested a possible association between poor returns and a soil constraint (Bramley & Trengove, 2013). Although a simple comparison between maps is not immediately suggestive of similar patterns of variation, careful ground-truthing of the EM38 map would be essential to understanding the cause of the variation.
Although the soil ECa is quick, reliable, and valuable, it does not always correlate with crop yields (Rabello et al., 2014). Nevertheless, measuring soil ECa is among the most common tools in PA research to characterize the space-temporal and anthropogenic soil properties that influence crop yield. For example, 10% of the works validated by Embrapa's PA network considered the soil ECa using commercial equipment (Veris, EM38) or a prototype (Bernardi et al., 2014).
Soil properties can vary spatially in regional scale-up within the same plot due to intrinsic soil formation, management practices, and extrinsic fertilization factors (Cambardella & Karlen, 1999; McBratney et al., 2003; Viscarra-Rossel & Bouma, 2016).
Embrapa's PA network collected data on soil ECa measured with a manual prototype considering the soil units of three vineyards in Bento Gonçalves, RS, Brazil (Table 2). The deep ECa appeared more remarkable than the shallow ECa for Cambisols-CXve and Ultisols-PBACal (Figure 1). The three parameters were significant for the ANOVA test, considering soil units as a factor of variability with the increasing significance of the statistic, that is, ECa-shallow, ECa-deep, and altitude. Advances to understanding the process will need new detailed studies.
Table 2 Altitude and values of ECa in the percentage of the maximum value in the soil units of three vineyards.
| Soil unit | N | Altitude m | Eashallow % | ECa deep % |
|---|---|---|---|---|
| CXve1 | 21 | 566 | 87 | 78 |
| CXve2 | 24 | 578 | 68 | 100 |
| CXve3 | 48 | 574 | 80 | 98 |
| PBACal1 | 15 | 596 | 79 | 99 |
| PBACal2 | 29 | 563 | 76 | 100 |
| PBACal3 | 12 | 560 | 35 | 88 |
| RRh1 | 24 | 595 | 59 | 48 |
| RRh2 | 10 | 589 | 78 | 52 |
| RRh3 | 17 | 593 | 55 | 38 |
| RRh4 | 38 | 588 | 69 | 80 |
N = Numbers of measures.
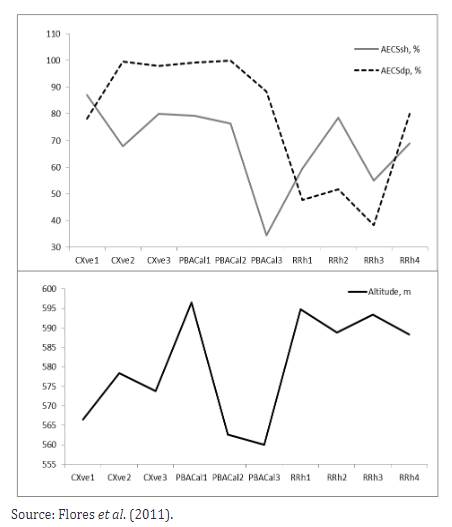
Figure 1 Mean altitude values and ECa of soil associated with soil units in three vineyards. Source: Flores et al.(2011).
Proximal and remote soil sensing. Remote sensing imagery can be obtained from various platforms, such as satellites, aircraft, UAVs (Jorge & Inamasu, 2014), and self-propelled agricultural machines (Mulla, 2013). Remote sensing allows the diagnosis of spatial and temporal variability in large agricultural extensions. Commercial companies (Houborg & McCabe, 2016) have highlighted it in PA due to advancements in the spatial and temporal resolution of orbital sensor systems and the increase in the offer of orbital images. Shiratsuchi et al. (2014) mentioned approaches to remote sensing from an agricultural perspective for several vegetation indexes and imagery with low to high resolution involved. In that sense, remote sensing studies would have strong potential for PA, especially when using sensors attached to agricultural machinery or UAVs.
Ge et al. (2011) considered that conventional remote sensing and spectroradiometry (in situ reflectance measures or proximal sensing) are complementary techniques because the former covers extended areas with a lower spectral resolution, and the latter involves detailed spectral information at specific points, so interpolation is necessary for continuous mapping, with the corresponding errors. The 36 works in the 1986-2007 period showed the relation between remote sensing and soil attributes involving orbital or aerial sensing (36%), spectroradiometry in a laboratory (61%), or on the field (11%). Multispectral sensors involved 13 cases and hyperspectral ones 23 cases, with the infrared interval prevailing over the visible.
The spectral signature is intense for some components and weak for others, with an overlap of peaks in the 1.4 to 1.9-micrometer range, which makes interpretation difficult (Ge et al., 2011). On the other hand, spectral resolution affects the quality of the information. Thus, multispectral sensors characterized few soil properties, as changes are confused with variations in moisture or roughness. Consequently, hyperspectral sensors were used less in PA.
Filippini-Alba et al. (2015) established a regression model of soil iron content with six bands of Landsat 8 sensor (R, G, B, NIR, SWIR1, and SWIR2) as independent variables, considering soil samples collected in a regular grid without vegetal cover in an experimental área, Capão do Leão - RS, Brazil. The best-fit model explained 85% of the total variance, including six bands: three in the electromagnetic spectra visible region and three in the infrared region.
Spectroradiometry is a potential application for PA, but its use is restricted due to the high quantity of available data and the difficulty of interpreting results. Filippini-Alba et al. (2019) considered Planosol samples collected according to a regular grid of one hectare with a 15m pass in the "Terras Baixas" experimental station of Embrapa in an area with rice cultivated by a conventional system in rotation with pastures. Phosphorus, K, Ca, Mg, Na, Al, and clay content involved conventional physical and chemical methods and spectroradiometry (2151 bands, 350 to 2500 nm). Analysis of dependence, factor analysis, and cluster analysis explained why the variance of the regression models was higher than 95%.
Sensors and geotechnologies use a higher sampling density, generating consistent soil survey and mapping data. Hence, the Brazilian Soil Spectral Library (BSSL) established in 1995 a protocol to gather soil samples from all 26 Brazilian states from 41 institutions and reach 39,284 soil samples (Demattê et al., 2019). The BSSL had a great relationship with soil mineralogy and allowed the estimation of physic and chemical soil attributes by fitting models on local, regional, and national scales. Spectral signatures lead to consistent soil texture, organic carbon, and CEC estimates. Nevertheless, low Ca, K, and P content was more prone to inaccuracies, necessitating more in-depth assessments. The Brazilian soils showed differences depending on geographic location or geology. The Brazilian pedometrics community standardized Brazilian soils' 350-2500 nm range spectra.
Yield. Thylén et al. (1997) considered yield mapping an adequate and acceptable method for evaluating agricultural heterogeneity. However, yield maps do not recognize the cause of such variation, which may be due to disease, disability, chemical imbalances, or water stress, and if the specific cause is not determined, no management response exists (Lark & Stafford, 1997).
PA aimed at nutrient management based on the initial soil sampling strategy. The procedure had many successful results when used in experimental parcels, with promising results, especially if large areas controlled all yield variabilities. Therefore, a grid of one sample per hectare appeared as the solution for most applications because maps of fertility and management were processed. However, most farmers were disappointed because yield variability of tillages persisted, which was attributed to sampling problems independent of data processing.
Zhang et al. (2002) appointed six variability factors related to agricultural production: (1) historical productivity; (2) field attributes occurrence; (3) soil fertility as nutrients content, texture, and soil humidity, CEC, ECa; (4) plant attributes; (5) anomalies as weed and pest infestation, nematodes occurrence, frost, and hail; (6) management related to sowing rate, crop rotation, fertilizer, and pesticide application.
Anderson-Cook et al. (2002) classified the mid-Atlantic coastal plain (USA) soil based on Eca and yield data. Data integration improved results, with the correct soil classification ranging from 80-90%. Amado & Santi (2011) analyzed agriculture in southern Brazil, emphasizing PA use in the North half of Rio Grande do Sul State (plateau region) with different grain crops, soil variability, fertility, and yield maps. The content and buffering capacity of soil nutrients, water infiltration, and plant availability are the limiting factors for productivity in eroded and marginal zones, soil compaction, organic matter loss, reduced water infiltration, and retention capacity.
Bramley & Trengove (2013) criticized regular grid sampling in PA, highlighting data integration by a GIS. Successful alternatives would be related to data-driven by intelligent irregular based on soil differences, micro-changes mapping in land relief, patches of color and texture, or big data with surveys of ECa, digital elevation models, remote sensing, and UVA.
Productivity or yield maps represented the most significant of the four themes related to Embrapa's PA network, with 28% of the total works (Bernardi et al., 2014). Productivity and vegetation indexes combined maps for fertilizer application oriented predominantly at technical articles for grains and fiber crops.
Filippini-Alba & Zanella (2016) revised about 91 Brazilian agricultural areas with PA approaches, covering 3665 ha, with 38% in the Southern region, 36% in the Southeast region, 20% in the Midwest, and 6% in the Northeastern region. Soil and plant sensors, position instruments (GPS), and yield maps were involved in 69, 27, 72 and 20% of the cases, respectively.
FINAL CONSIDERATIONS
Soil is a fundamental item in agriculture, mainly due to its three-dimensional nature.
Spectrometry in PA context should evolve to include drones, UAV approaches, or even commercial multispectral sensors installed in agricultural machines. However, developments in software and equipment are still pending until they reach the commercial application stage.
About the themes here considered, Digital soil mapping explores topographic variables; ECa allows the study of vertical changes between soil horizons; proximal and remote sensing can simulate fertility soil attributes or monitor plant attributes; and productivity is a significant dynamic variable, including economic aspects.
The cost of technology may be high for small producers, with farms smaller than 50 ha, a common condition in Brazilian territory. Some authors have indicated areas of 20 to 40 hectares as sustainable for PA approaches. Precision fruit-culture strategies differ from grain or grass production with PA strategies due to planting area size, dossel structure, and proximal and remote sensing usage. Fruit-culture precision strategies can be adapted to in situ measures or high-resolution and drone imagery because dossel structure and rural machines are limited to interline width. The structure of dossel usually allows conventional imagery usage for grain production, which is complementary to in situ studies in small areas in the way that data extrapolation allows a complete perspective.
Soil mapping significantly contributes to PA, especially on the property scale (order-0 scale of USDA). Brazil is a continental-sized country with several biomes and a characteristic reply in each case. For example, grids of at least one sample per hectare affect plain areas of the Cerrados cultivated with grains. However, vineyards of less than 2 hectares join several soil classes in southern Brazil, so intensive sampling is necessary if conventional methods are applied. Therefore, big data, spectroradiometer, digital soil mapping, UAV, multi-thematic sensors, and connectivity in rural areas appear as disruptive technologies, focusing on sustainability through PA.

