


Services on Demand
Journal
Article
 English (pdf)
 Article in xml format
 Article references
 Send this article by e-mail
Indicators
-
 Cited by SciELO
 -
 Access statistics
Related links
-
 Cited by Google
 -
 Similars in
SciELO
Similars in
SciELO -
 Similars in Google
Share

 Permalink
Boletín de Geología
Print version ISSN 0120-0283On-line version ISSN 2145-8553
bol.geol. vol.30 no.2 Bucaramanga July/Dec. 2008
MORPHOMETRY AND SEDIMENT DYNAMICS OF THE
CHURIYA RIVER AREA, SIWALIK RANGE IN NEPAL
Madhusuda Bhakta Shrestha11, Naresh Kazi Tamrakar2 and Toshitaka Miyazaki1
1 Department of Forestry, Faculty of Agriculture, Shinshu University,8304 Kamiinagun Minamiminowamura, Nagano,399-4598,Japan
2 Central Department of Geology, Tribhuvan University, Kirtipur, Kathmandu, Nepal (ntamrakar@hotmail.com).
1 Department of Forestry, Faculty of Agriculture, Shinshu University,8304 Kamiinagun Minamiminowamura, Nagano,399-4598,Japan
ABSTRACT
The Siwalik Range of Central Nepal has weakly consolidated rocks with thin soil cover. Being one of the several north-flowing subsequent tributaries, the Churiya River originated from the southern uplifted range of the Siwalik Group. Morphometry and hydraulic parameters of the Churiya River Basin (CRB) were studied to know how capable is the river for carrying its sediment out of the basin. In many cases, hypsometric integral (HI) in 1st order watershed was lower (0.33–0.57) compared to that of 2nd and 3rd order watersheds (0.45–0.54) suggesting that it had been undergoing severe erosion. The surface flow in the Churiya River appeared only during intense middle monsoon rainfall (June–August) and disappeared most of the time probably due to highly permeable riverbed. Stream powers (Ps) calculated from morphometric analyses of the drainage basin, and stream powers per unit bed area (Ωb) computed from hydraulic data showed that 2nd order watershed in both cases were 2.5 times higher than 3rd order watershed. This suggests that stream powers of 2nd order watersheds had high potentiality of transporting sediments into 3rd order segment, where stream powers diminished due to reduction in slope, boundary shear stress, and increase of infiltration rate. Although, stream powers reduced downstream (in 3rd order segment), they were quite high enough to flush out from the basin even the largest grain size (dmax) of the riverbeds during the period of high flows. Therefore, sediment erosion should be controlled in the Churiya River Basin to reduce its impact on downstream segments and infrastructures.
Key words:Siwalik Range, morphometry, riverbed, sediment, grain size, stream power
MORFOMETRIA Y DINAMICA DE LOS SEDIMENTOS EN EL AREA DEL RIO
CHURIYA, SERRANIA DE SIWALIK EN NEPAL
RESUMEN
La Serrania de Siwalik en la región central de Nepal presenta rocas débilmente consolidadas con una delgada cubierta de suelos. Siendo uno de los tributarios del norte, el rio Churiya se originó del levantamiento en el Sureste del Grupo Siwalik. La morfometria y los parámetros hidráulicos de la cuenca del rio Churiya (CRB) fueron estudiados para conocer la capacidad del rio de transportar sedimentos fuera de la cuenca. En muchos casos la hipsometría integral (HI) de parte aguas de primer orden fue muy baja (0.33-0.57) comparada con las de segundo y tercer orden (0.45–0.54), sugiriendo que ha sufrido erosión severa. El flujo superficial del rio Churiya aparece solo durante las intensas lluvias monzonicas (junio-agosto) y desaparece la mayoría del tiempo probablemente debido a la alta permeabilidad del lecho del rio. El poder de sedimentos (Ps), calculado a partir de los análisis morfometricos del drenaje de la cuenca y el poder de sedimentos por unidad del área del lecho (Ωb) calculado de los datos hidráulicos mostraron el parte aguas de segundo orden en ambos casos fue 2.5 veces más alto que el de tercer orden, sugiriendo que los de segundo orden tienen más potencial de transporte que los de tercera dado a que en estos últimos disminuye el poder debido a la reducción en la pendiente, limite de cizalla por stress e incremento en la tasa de infiltración. Aunque en el parte aguas de tercer orden hay bajo poder de sedimentación y transporte, esto aumenta en los periodos de lluvias, por consiguiente, la erosión por sedimentación debe ser controlada en la cuenca del rio Churiya para reducir el impacto en la infraestructura.
Palabras clave: Serranía de Siwalik, morfometria, lecho de rio, sedimento, poder de corriente
INTRODUCTION
The Siwalik Range (Churiya Range) extends E–W with a width of 10–20 km and rises from the Ganges Plain to an altitude of about 1500 m amsl (above mean sea level). Steep slopes of the Siwalik Range and weakly consolidated rocks with thin soil cover generally tends to promote severe surface erosion in spite of the thick vegetation (Galay, 1987). Almost every monsoon, sediment related disasters in the region have been causing countless misery to the inhabitants and causing havoc in the national infrastructures. Shrestha et al. (2005) highlighted the sediment dynamics and suggested that the apparent reason for the huge sedimentation within the Siwalik basins could be because of fluvial characteristics. The fluvial characteristics are in turn influenced by topography and climate (Grantham and Velbel, 1988), tectonics and weathering (Johnson, 1990), composition of source area and riverbed materials. Assuming that tectonics, topography and weathering conditions are being consistent within a small basin, mobility of riverbed material may depend on the available lithology of the source area, hydrology and morphometry of the basin. Therefore, understanding of sediment dynamics of the region is an important concern in order to mitigate and control in the future the sediment-related disasters.
STUDY AREA
Geology
The CRB is located in the northern face of the Churia Mai Range having elevation of 800 m amsl, from which the Churiya River originates and contributes the Utterpani River a tributary of the Rapti River (FIGURE 1). The basin area and total stream length of the CRB is 7.6 km2 and 18.2 km, respectively. The Churiya River has gravelly riverbed material.
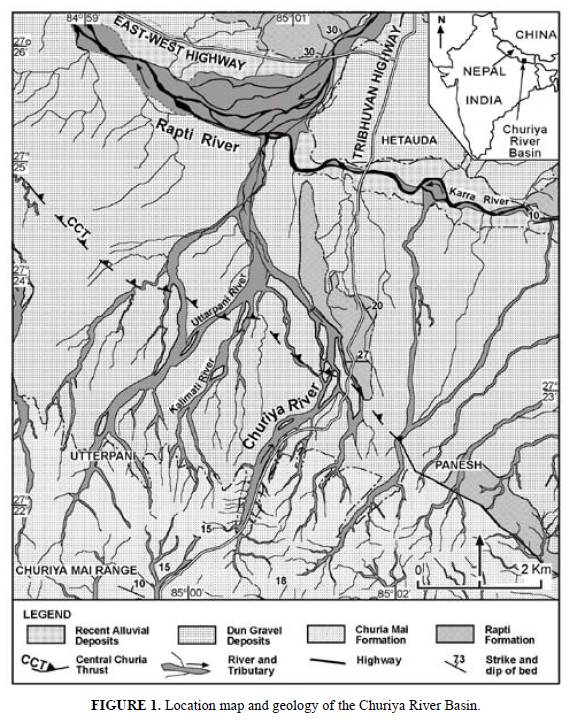
The southern prominent ranges (Churiya Mai Range) came into existence in Late Pleistocene after southward thrusting of the Siwalik belts (Kimura, 1994). Since then, the northern slope of the Churia Main Range has been giving rise to northward flowing streams and their sediments to the inner belt in different levels of terraces, thus forming the extensive Dun Gravel Deposit (FIGURE 2).
Loosely consolidated matrix-supported conglomerate, sandstone and mudstone of the Siwalik Group, and the Dun Gravel Deposit crop out in the CRB. Clasts (size > 2 mm) of conglomerates are composed of limestone, marble, quartzite, sandstones, schist, phyllite, granite and gneiss. Roughly three levels of terraces occur in the north-facing slopes of the Churia Mai Range. Terrace deposits are composed of matrix-supported cobble and pebble with few sand layers. The sediments thus distributed in the CRB are loosely consolidated to unconsolidated and are susceptible to erosion.
Hydrometeorology
The mean annual rainfall (during 1987–2004 at Hetauda Meteorological Station (HMS) with elevation 470 m amsl) was 1847–3323 mm (FIGURE 3a). More than 80% of mean annual rainfall was observed during the monsoon period (June–September). The monthly maximum daily rainfall (1987-1994) ranged between 5 mm in November and 453 mm in August (FIGURE 3b). The total rainfall and rainy days recorded by Shrestha et al. (2001) at the headwater segment from 31 August 1997 to 5 May 1998 were 699.8 mm and 90 days, respectively.
Similarly, annual maximum, minimum and mean air temperatures recorded at the HMS from 1987 to 1994 were 29.3°C, 16.8°C and 23.1 °C, respectively. Annual mean relative humidity recorded at 8:45 Nepal Standard Time (NST) and 17:45 NST were 78% and 73%, respectively. The CRB lies in the subtropical zone.
LANDUSE AND COVER
For land use and cover changes within the CRB, USGS produced Landsat5-TM imagery acquired in October 18, 1988 was used. Geometric, radiance and reflectance corrections (Seker et al., 2004) were conducted on the image before classifying land use/cover. Supervised classification method in the Erdas Imagine was followed. Ground truths were carried out by using sole black and white aerial photographs, 1/25,000 scale topo-map and field observations. Orthorectification was done for the aerial photos taken in 1987 and 1989 before using them as ground truths.
All the sub-watersheds have the largest coverage of dense forest followed by sparse forests, cultivated lands, river channels and grasslands in descending order (FIGURE 4). The protected Sal forest covers more than 70% of its neighboring area. Mixed forest of Chire pine (Pinus roxburghii Sargent), Khayer (Acacia catechu (L.f.) Willd) and Sisau (Dalbergia Sissoo Roxb.) show low forest coverage, 10 to 40%. Other species existing in the vicinity are: Adina Cordifolia (Wild. ex. Roxb.), Hook f., Dalbergia latifolia Roxb., Simal (Bombax malabaricum DC.), and Sajh (Terminalia tomentosa Wight et Arn.) (Shrestha et al., 2001).
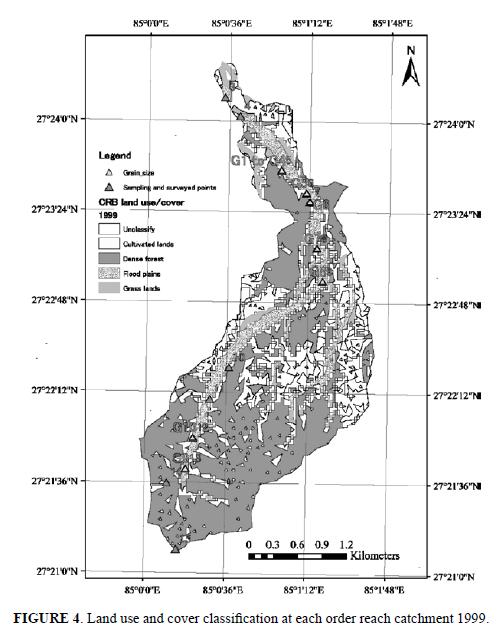
Cultivated lands at each order sub-watershed covers more than 30% of its corresponding total watershed area. River channel coverage at 2nd and 3rd order sub-watersheds is about two and three times, larger than that of 1st order sub-watershed, respectively. The cultivated lands that are prevalent and localized along/at main channel (FIGURE 4) are highly susceptible to the annual floods, and are prone to sediment sources (Shrestha, 2000; Shrestha et al., 2005; Shrestha and Miyazaki, 2005).
ASIN MORPHOMETRY
Morphometric parameters
Terrain analysis was made to obtain the morphometry. Aster DEM (30 m) was used to extract channel networks and watersheds delineation, which were carried out in the ArcGIS 9.0 using TauDEM (Terrain Analysis Using Digital Elevation Models). In this model "DEM Curvature based" algorithm was used, and then the morphometric parameters were calculated (Tarboton et al., 1991 and 1992). In this study, for the stream drops and basin drops, elevation values were obtained from the 1/25,000 scale topo-map and contour-based data. The results are shown in TABLE 1.
The CRB is a 3rd order basin having 19 1st order and 2 2nd order sub-watersheds. First order sub-watershed has the maximum RB of 9.50, whereas, 2nd order has 2.0 (TABLE 1). It suggests that inlet channels in the 2nd order watershed are 9.50 times larger than the outlet channels. Similarly, RA and RL at 2nd order watershed suggest that total 2nd order drainage area is 15.90 times higher than total 1st order drainage area, and total stream length is 17.28 times longer than total 1st order streams.
In comparing to other Siwalik basins, the average RB, RA and RL are significantly higher in the CRB (TABLE 1). In contrast to RA and RL, basin relief ratio (RZ) is lower in the CRB. The second order sub-watershed of the CRB has characteristically different mean total drainage area and the mean total stream length compared with other Siwalik basins (FIGURE 5a and 5b). The basin and stream drops also differ (FIGURE 5c and 5d). Stream drops of the CRB are larger than other Siwalik basins. But, CRB's stream slopes are far less than that of other Siwalik basins (FIGURE 5e). Similarly, drainage density (DD) is lower in the CRB (FIGURE 5f).
Hypsometric Integrals (HI)
Hypsometric integral (Strahler, 1952) is sensitive to factors that control elevations within a watershed such as tectonics and erosion in landscape building; and are tractable through hypsometric analysis. HI was computed as:
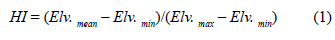
where, Elv. mean, Elv. max and Elv. min are the mean, maximum and minimum elevations within the watershed, respectively. The HI value ranges between 0 and 1, as a value closes to 0 suggests significant incision, slope movement, and erosion of soil mass since the formation of the watersheds (Bishop et al., 2002). The mean hypsometric integrals (HI) for the CRB is 0.48–0.55 suggesting the stage of maturity (Strahler, 1952), and shows homogeneity within the basin (FIGURE 5f). In comparison to other Siwalik basins (Shrestha and Miyazaki, 2005), excluding 3rd order sub-watershed, HI are less in the CRB, and it suggests significant incision and slope movement of topsoil and bedrock materials. Sub-watersheds of 2nd and 3rd order streams have similar DD and HI values, which would probably suggest the similar erosional morphology. Low HI values and high variation of DD at 1st order sub-watershed suggests that it has been undergoing severe erosion compared to its corresponding higher order sub-watersheds.
SEDIMENT CHARACTERISTICS
Grain size of riverbed material
As riverbed materials were heterogeneous, grain size analysis was made using digital images obtained from the riverbed surfaces at ten different locations (FIGURE 2). The Scion Image Analyzer was applied, and intermediate axes of about 400 grains per square meter were counted using a grid–by–number method, that is comparable to a volume-by-weight analysis (Kellerhals and Bray, 1971). These apparent sizes were corrected after Adam (1979), and were then counted for Udden–Wentworth Size-Grade Scale. The mean of 10 largest clasts (grain > 2 mm) in each sample was taken as Dmax.
The surface sediments of the riverbed in each point represent chiefly pebble grade and subordinately cobble grade (TABLE 2). FIGURE 6a and b show downstream views of respectively the second and third order segments of the Churiya River showing its riverbed material. In most of the sampling points Dmax is cobble but is pebbly sand and sandy muddy pebbles in some places. The average Dmax of 2nd and 3rd order segments are 73 and 97 mm, respectively. The D50 lies on pebble grade (4–37 mm) and varies widely. The clast/matrix ratio is as high as 77.85 and as low as 0.21 (TABLE 2). The results show heterogeneity in grain size among the samples within a river segment.
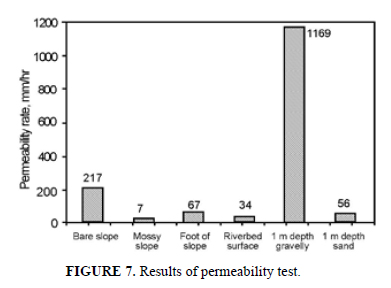
Permeability rate
Permeability tests at the headwater segment (both source area or hill slope) and riverbeds were made using an infiltrometer. The amount of water and time to percolate through the cylinder was measured, and the permeability rate was calculated in mm/hour. The result is shown in FIGURE 7. Mossy hill slope has the lowest permeability rate of 7 mm/h and subsurface gravelly riverbed (at 1 m depth) has the highest permeability rate of 1169 mm/h. The permeability rate increases with the increase of volume of gravelly clast present.
Sediment source
The riverbed materials have been derived from the valley walls formed of loosely consolidated conglomerates of the Siwalik Group, and of the gravelly terrace deposits (FIGURE 8). Besides, the Churiya River also erodes its banks. The matrix-supported gravelly outcrops are also susceptible to slope failure, because they are poorly stratified and unconsolidated (Tamrakar, 1999). High permeability rate in gravel deposit allows percolation of rainwater down the gravel deposit and increases fluid pressure, which when exceeds strength of the gravel deposit, the latter disperses due to buoyancy (Collinson and Thompson, 1989). The gravity and the fluid contribute in dispersing grains or erosion of the hill slopes. With mass wasting and associated physical disruption of clasts from matrix of gravel deposits, a huge volume of debris has been supplied from the headwaters and the riverbanks.
The cultivated lands (situated along the banks or terraces) and sparse forests (mainly of Sal) yielded enormous sediments because these lands were unable to resist erosion. Sal forest floors had been poorly vegetated and damaged due to grazing and litter collection that impair the resisting erosive forces exerted during intense rainfall (Shrestha, 2000). Additionally, Sal has intensive main root type (Shrestha et al., 2001), and possess stake-like main root which is very thick and strong enough to penetrate hardpans of red soils (lateritic soil) but, it has extremely few lateral hair roots, thus, has very low effects in protecting surface erosion.
HIDRAULIC PARAMETERS
The CRB lacks gauge station, therefore discharge (Q) and velocity (V) of the Churiya River were estimated using continuity equation and Manning's equation (Chow, 1959), respectively as:


where, A is cross-sectional area at bankfull stage, R is hydraulic radius, which is a ratio of A to sum of width and twice the bankfull depth, S is an average channel slope and n is Manning's roughness coefficient. River hydraulic parameters (stream length, drop in elevation and stream width) were obtained from terrain analysis. The average depth for the channel from field survey was 2 m. The segment considered for the channel width calculation was from the beginning of the second order mainstem (Churiya Bridge) to the end of the third order mainstem river (FIGURE 2).
The length and drop of the mainstem Churiya River are 8.73 km and 293 m, respectively. The channel gradients of 1st, 2nd and 3rd order streams are 0.050, 0.042 and 0.017 m/m, respectively (TABLE 3) As shown in FIGURE 9, the channel gradient is not uniform and is relatively steeper at the upstream segment and major slope break exists between each order mainstem.
The average widths of 2nd and 3rd order streams are 95.21 m and 140.49 m, respectively. The width/depth ratio (W/D ratio) nearly doubles in the 3rd order segment. The average bankfull discharges of 2nd and 3rd order streams are 1000 m3/s and 1421 m3/s, respectively. Similarly, the average bankfull velocities are 5.25 m/s and 5.06 m/s, respectively, and these do not differ largely. In the downstream segment the discharge increases due to increased stream cross-sectional area and the corresponding drainage area.
Comparing the boundary shear stress (t) on the channel bed at bankfull discharge with the critical shear stress (tc) required to transport a specific bed material size, the competency of the river was evaluated. The boundary shear stress and critical shear stress for D50 was obtained using the following expressions (Shield, 1936):


where, γ= unit weight of water (9810 N/m3), R = hydraulic radius (m), S = slope of stream (m/m), Θc = Shields parameter for critical dimensionless shear stress, g = gravitational constant (9.81 m/s2), ρs = density of sediment (2650 kg/m3), ρ = density of water (1000 kg/m3), and D50 = median diameter of particle (m). For coarse-bedded stream, where dimensionless viscosity may exceed tens of thousand, the Θc approaches nearly a constant value of 0.045 from the Shields Curve, and therefore, this value was considered.
Boundary shear stresses of 2nd and 3rd order segments of the Churiya River are 791 N/m2 and 324 N/m2, respectively. These boundary shear stresses are large enough to entrain respectively the size grades of 543 mm and 222 mm. Considering the average D50 of 2nd (24 mm) and 3rd order streams (16 mm), the critical shear stresses required to entrain D50 (tc50) approach 18 and 12 N/m2, respectively. Even the critical shear stresses required to move Dmax (tcmax) of 2nd (53 N/m2) and third order streams (70 N/m2) are very small compared to the corresponding boundary shear stresses (TABLE 4). Therefore, boundary shear stresses exerted by 2nd and 3rd order segments at the bankfull flow are strong enough to transport riverbed material from the basin.
STREAM POWERS
The stream power per unit bed area as defined by Brookes (1990) was calculated as:
where, Ωb = stream power per unit bed area (m-kN/s/m2), V = bankfull velocity from equation (3), and t = boundary shear stress (kN/m2) from equation (4).
The scouring rate is strongly influenced by the stream power (Ps). It was calculated as:

where, Q is the discharge and S is the stream slope. The rational equation was used to estimate discharge, allowing equation (7) to be rewritten as:

where, f is the runoff coefficient, r is the rainfall intensity, A is the drainage area, and S is the average stream slope. The values of f and r were considered to be equal within the same basin; thus, the ratio of average stream powers between the lower (w) order and higher (w+1) order sub-watersheds were thus calculated from the measurements of their drainage area and average stream slope as:

where Psw, Aw and Sw are stream power, average drainage area and average stream slope of the w order watershed. Sw is the ratio of stream drop to stream length of the w order watershed. Both stream power per unit bed area (Ωb ) and the ratio of stream power of higher to lower order watershed (Ps) were calculated for the CRB.
Stream powers per unit bed area (Ωb ) of 2nd and 3rd order segments were 4.16 and 1.64 m-kN/s/m2, respectively. Because the bankfull velocities in both segments are nearly equal, Ωb is mainly a function of t. The rates of transport per unit bed area in 2nd and 3rd order segments are high enough to mobilize riverbed materials D50 as well as Dmax during the bankfull flow. The stream of 2nd order segment is 4.26 times and that of 3rd order segment is 1.75 times strong enough to transport the largest cobble (256 mm). Undoubtedly, Ω and Ωb of 3rd order stream diminish due to reduction in slope and t. This reduction (of about 2.5 times) perhaps indicates that the 3rd order stream has been depositing significant volume of sediments on its channel bars each time during the subsidence of flood.
Mean stream power (Ps) of 1st order sub-watershed is 1.12 and 2.85 times higher than 2nd and 3rd order sub-watersheds, respectively (FIGURE 10a). Similarly, mean stream power of 2nd order sub-watershed is 2.54 times larger than 3rd order sub-watershed. It suggests that stream powers of 1st and 2nd order sub-watershed have high scouring power and potentiality in transporting sediments into the 3rd order sub-watersheds. Most of the 3rd order sub-watersheds, localized near the confluence with the Uttarpani River, at the outlet of the CRB, have longer reach length (FIGURE 10b) and smaller catchment area (FIGURE 10c) compared to its corresponding lower order sub-watersheds, therefore bear low stream power.
Other possibility for diminish of stream power of 3rd order stream is an abrupt reduction of stream slope from 2nd to 3rd order segment. On of the causes of this slope break is an extension of the Central Churia Thrust (FIGURE 2). Such a slope break is accompanied with riverbed gravels, which are highly permeable. On these, surface flows appear only during intense rainfall that exceeds permeability rate, called 'wadji' rivers by Nelson et al. (1980) and Bruinjnzeel and Bremmer (1989).
During the survey in dry season (November to December), surface water was not observed up to the sampling point 3 to 4 (FIGURE 2). Surface flows at upper segments (2nd and 3rd order segments) were seen only during the intense rainfall of July and August when average daily and monthly rainfall exceeded 100 mm and 350 mm, respectively. During this time the surface water level could rise up to 2 m, and flows are capable of entraining and transporting all the size-grades present on the riverbed. However, the stream powers exerted by the river during flood stage tend to cease immediately after decline of rainfall, and no surface flow appears to move riverbed material. Therefore, without surface flows, entrainment and transportation of riverbed sediments may not be expected during the dry season.
Furthermore, sediment concentrations are elevated soon after the first monsoon rains, when the soils are dry, the protective vegetative cover is minimal, and fine-grained unconsolidated material is available in adequate quantity (Kale and Hire, 2004). This means that irrespective of the flow magnitude, the sediment concentration is higher during the early monsoon season. Therefore, it is evident that fewer high-magnitude flows can remove a large proportion of suspended sediment from the 1st and 2nd order basin and deposit near/at the bifurcations of the streams.
CONCLUSIONS
From the results, the sediment dynamics of the CRB could be expressed by carrying out morphometric analysis, land use and cover classification, grain size analysis of riverbed material and using river hydraulic parameters. The CRB has longer stream lengths and larger drainage areas than other Siwalik basins. From the nature of the loosely consolidated conglomerate or gravelly outcrop and riverbed material, it is observed that the river carries significant amount of sediments as available in the source. During high rainfall period, the river possesses large boundary shear stress, and has exceeding competency and capacity to flush out material from the outcrop, river banks and riverbed, and finally from the Churiya basin. Stream power diminishes from 2nd to 3rd order segments mainly because of great reduction of slope, boundary shear stress, catchment areas, and increased infiltration rate.
The scenario of the river dynamics changes when dry season prevails and sediment transport is ceased. Comparing the 2nd with 3rd order segments, during transitional period between high flow and subsiding flow, while 2nd order segment is still capable of transporting coarse riverbed material, 3rd order segment ceases its competency to move sediments out of the basin. Therefore, the sediments derived from 2nd order segment are mostly deposited in river bars of 3rd order segment. Hence, 3rd order segment possibly is the zone of deposition throughout the year, except during the intense rainfall period.
REFERENCES
Adam J. 1979. Gravel size analysis from photographs; Journal of the Hydraulics Division, ASCE, 105 (HY10): 1247–1255. [ Links ]
Bruijnzeel, L.A. and Bremmer, C.N. 1989. Highland-Low land in the Ganges Brahmaputra river basin. In: International Center for Integrated Mountain Development (ICIMOD) Paper No.11, ICIMOD, Kathmandu, Nepal, 9–119. [ Links ]
Brookes, A. 1990. Restoration and enhancement of engineered river channels: some European experiences. Regulated Rivers: Research and Management 5(1): 45–56. [ Links ]
Bishop, M.P., Shroder, J.F., Bonk, R., Olsenholler, J. 2002. Geomorphic change in high mountains: a western Himalayan perspective. Global and Planetary change, 32: 311–329. [ Links ]
Chow, V.T. 1959. Open channel hydraulic. McGraw-Hill, Inc. New York. [ Links ]
Collinson, J.D. and Thompson, D.B. 1989. Sedimentary structures. Unwin Hyman, London, 207p. [ Links ]
Galay, V. 1987. Erosion and sedimentation in the Nepal Himalaya, An assessment of river processes, Ministry of water resources HMG Nepal, Report no. 4/3/012587/1/1, seq. 259p. [ Links ]
Grantham, J.H. and Velbel, M.A. 1998. The influence of climate and topography on rock-fragment abundance in modern fluvial sands of the Southern Blue Ridge Mountains, North Carolina. Journal of Sedimentary Petrology, 58(2): 219–227. [ Links ]
Johnson, M.J. 1990. Tectonic versus chemical-weathering controls on the composition of fluvial sands in tropical environments. Sedimentology, 37: 713–726. [ Links ]
Kellerhals, R. and Bray. D.I. 1971. Sampling procedures for coarse fluvial sediments. Journal of the Hydraulics Division, ASCE 97 (HY8): 1165–1180. [ Links ]
Kimura, K. 1994. Formation and Deformation of River Terraces in the Hetauda Dun, Central Nepal; A Contribution to the Study of Post Siwalikan Tectonics. The Science Report of the Tohoku University, 7th Series (Geography), 44, 2: 151–181. [ Links ]
Kale, V.S. and Hire, P.S. 2004. Effectiveness of monsoon floods on the Tapi River, India: role of channel geometry and hydrologic regime. Geomorphology, 57: 275–291. [ Links ]
Nelson, D.O., Laban, P., Sherstha, B. D., and Kandal, G. P. 1980. A reconnaissance inventory of the major ecological land units and their watershed condition in Nepal, Dept. of soil conservation and watershed management, report IWM/WP/17, 292p. [ Links ]
Seker, D.Z., Duran, Z., Altan, O., Shrestha, M. B., Yuasa, A., and Kawamura, K. 2004. Producing Landslide Risk Map of Sebinkarahisar-Turkey, Proceedings of ISPRS XXth Congress, Volume XXXV, Part B4, Commision : 465–469. [ Links ]
Shields, A. 1936. Application of similarity principles and turbulence research to bed-load movement. In: W.P. Ott and J.C. Uchelen (translators), Mitt. Preuss. Verschsanst., Berlin. Wasserbau Schiffbau. California Institute of Technology, Pasadena. CA, Report, 167, 43p. [ Links ]
Shrestha, M.B. 2000. Restoration of vegetation colony of dilapidated mountainous region of Nepal, Ph. D. thesis, United Graduate School of Agricultural Science, Gifu University (in Japanese). [ Links ]
Shrestha, M.B., Yamadera, Y., and Miyazaki, T. 2001. A study on root morphology of the plants that were introduced to stabilize steep road cut slope of the Siwalik region in Nepal, J. Japan. Soc. Reveget. Tech. 27 (2): 416–429. [ Links ]
Shrestha, M.B., Miyazaki, T., and Watanabe, K. 2005. Analysis of Siwalik and Mahabharat watersheds with geomorphometric parameters, Proc. International Symposium on Landslide Hazard in Orogenic from the Himalaya to Island Arc in Asia, Kathmandu, 321–333 [ Links ]
Shrestha, M. B. and Miyazaki, T. 2005. Geomorphometric analysis of two regions of central Nepal using GIS, Proc. International Symposium on Fluvial and Coastal Disasters, DPRI, Kyoto University, CD-ROM [ Links ]
Tamrakar, N.K. 1999. Tectonic developments and slope movements along the Surai Khola River, Siwalik Hills, Mid Western Nepal, Unpublished Master's Thesis of Shimane Univ., Japan, 162p. [ Links ]
Tarboton, D. G., Bras, R. L. and Rodriguez-Iturbe, I. 1991. On the extraction of channel networks from Digital Elevation Data, Hydrologic Processes, 5(1): 81–100. [ Links ]
Tarboton, D. G., Bras, R. L. and Rodriguez-Iturbe, I. 1992. "A Physical Basis for Drainage Density, Geomorphology, 5(1/2): 59–76. [ Links ]
Trabajo recibido: agosto 4 de 2008.
Trabajo aceptado: noviembre 10 de 2008.

