


Services on Demand
Journal
Article
 English (pdf)
 Article in xml format
 Article references
 Send this article by e-mail
Indicators
-
 Cited by SciELO
 -
 Access statistics
Related links
-
 Cited by Google
 -
 Similars in
SciELO
Similars in
SciELO -
 Similars in Google
Share

 Permalink
Boletín de Geología
Print version ISSN 0120-0283
bol.geol. vol.34 no.2 Bucaramanga July/Dec. 2012
VOLCANO, COLOMBIA
Carlos A. Vargas1; Lluis Pujades2; Alexander Caneva3
1 Department of Geosciences, Universidad Nacional de Colombia, Bogotá, Colombia.
cavargasj@unal.edu.co
2 Technical University of Catalunya, Barcelona, Spain.
3 Universidad Antonio Nariño, Bogotá, Colombia.
Spatial variation of coda-Q (Qc) was analyzed in the Galeras volcano, located in the south western Andes of Colombia. The Qc value was calculated using the Single Backscattering model and using seismograms filtered in the band centered on 3.0 Hz. We used the estimated values as the mean attenuation that represents the total effect of the simple scattering process inside an ellipsoidal shell volume. An inversion procedure was implemented to estimate the spatial variation of Qc as function of volume fractions. Synthetic tests in 2D and 3D allow us to extend the procedure with available data from the seismological network located at the Galeras volcano.
The inversion of 2855 Qc values in a grid of 8 x 8 x 8 nodes associated to 435 earthquakes and 19 stations permitted resolve the presence of two levels of attenuation anomalies which are assumed to be related to bodies of partially melted rocks, the first located around 6.0 km depth and the other one at >13.3 km depth from the summit. These bodies could be responsible for the vulcanian-type explosions as a consequence of mixture of shallow magma with depth basic magma. The shallow body seems extend along the summit and may represent the presence of plugs and fluids that are constantly fed from the deeper body and produce the actual hydrothermal activity with eruptive events. From 2002 to nowadays several eruptions has happened, e.g. at November, 2005, the volcano generated evacuation of aprox. 9000 persons from four towns around the Galeras volcano (Mapachico, Genoy, La Florida and Nariño). Along these episodes, including the one on December 6th, 2010, it looks like a large and deep magma volume is involved in this process and that more eruptive events may be expected.
Keywords: Coda Q attenuation, 3D tomography Galeras volcano, Eruptive activity.
ESTRUCTURA DE ATENUACIÓN EN EL VOLCÁN GALERAS, COLOMBIA
RESUMEN
La variación espacial de coda-Q (Qc) fue analizada en el Volcán Galeras, localizado en el suroccidente de los Andes de Colombia. El valor de Qc fue calculado usando el modelo de retro-dispersión simple y usando sismogramas filtrados en la banda centrada a 3.0 Hz. Posteriormente, fueron usado los valores estimados como la atenuación promedia que representa el efecto total del proceso de dispersión simple dentro de una concha volumétrica elipsoidal. Un procedimiento de inversión fue implementado para estimar la variación espacial de Qc como función de las fracciones de volumen. Evaluaciones sintéticas en 2D y 3D permitieron extender el procedimiento con datos disponibles derivados de la red sismológica del Volcán Galeras.
La inversión de 2855 valores de Qc en una grilla de 8 x 8 x 8 nodos asociados a 435 eventos y 19 estaciones, permitió detectar la presencia de dos niveles de anomalías de atenuación las cuales podrían estar relacionadas con cuerpos de rocas parcialmente fundidas, la primera localizada alrededor de 6.0 km de profundidad y la segunda a una profundidad >13.3 km desde la cima. Estos cuerpos podrían ser responsables de las explosiones vulcanianas como consecuencia de la mezcla de magmas superficiales con profundos más básicos. El cuerpo superficial parece extenderse en una amplia zona de la cima y puede estar relacionado con la presencia de intrusiones y fluidos que son constantemente alimentados desde el reservorio mas profundo y produce la actual actividad hidrotermal con eventos eruptivos. Desde el 2002 hasta hoy en día, varias erupciones ha ocurrido, ej. en Nov. 2005, el volcán generó la evaluación de aprox. 9000 personas de cuatro poblaciones cercanas al Volcán Galeras (Mapachico, Genoy, La Florida and Nariño). A lo largo de estos episodios, incluyendo el ocurrido el 6 de Diciembre de 2010, parece que un gran volumen de magma esta siendo envuelto en este proceso y que más episodios eruptivos podrían esperarse.
Palabras clave: Atenuación de Coda Q, Tomografía en 3D, Volcán Galeras, Actividad eruptiva.
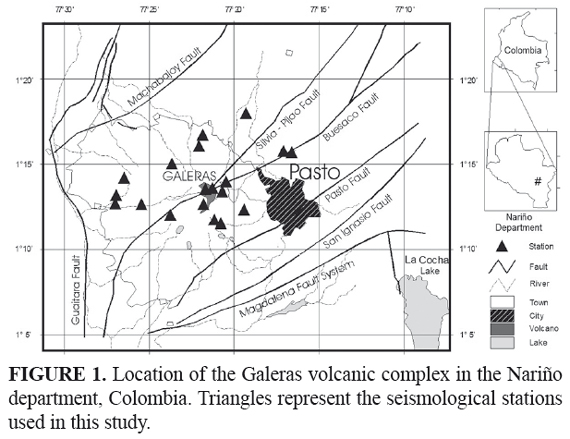
The Galeras volcano (lat. 1°14'N, lon. 77°22'W) is a 4200 m-high andesitic volcano in the SW Colombia (Nariño department) and it is the most recent active center of the Galeras volcanic complex (Cepeda, 1986). The cone of this active volcano has a 320m diameter and it lies within a caldera that is breached to the west. The Galeras volcanic complex is historically characterized by vulcanian type explosions (Calvache, 1990), the most important one, recorded in 1936, generated a pyroclastic flow to the northeast of the volcanic structure. The volcano lies 8 km from the Pasto city (FIGURE 1) and various other towns are located on its flanks. In total, about 400.000 people live close to the volcano, inside the hazardous zone.
Since 1988, when the Galeras volcano was reactivated, after 50 years of calm, it entered in a fumarolic and degassing stage, with seven eruptions between 1989 and 1993. An andesitic dome was extruded in September 1991 and was destroyed during the July 1992 eruption. Since 1994 the Galeras is in a quiet stage with lesser explosions, and seismic crises in the years of 1995, 1998, 2000, 2002, 2004, 2005, 2006, 2008, 2009 and 2010.
Few studies have been performed in the Galeras volcano. The first works were oriented to describe the evolution and its geological frame (Cepeda, 1986; Calvache, 1990). Because in beginnings of the year's 1990 Galeras volcano was declared the Decade Volcano, several works were done in order to propose its eruptive mechanism throughout geological, geochemical and geophysical observations. Some of these studies were based on the assumption of two magmatic deposits (Calvache and Williams, 1992; Muñoz et al., 1993; Stix et al., 1993; Fischer et al., 1996; Calvache and Williams, 1997a,b; Calvache et al., 1997; Banks et al., 1997; Fischer et al., 1997; Stix et al., 1997; Sano et al., 1997; Zapata et al., 1997). In the seismological framework, Gómez and Torres (1997) gave the first study related with the coda wave attenuation in low-frequency volcanic seismic events. On the other hand, Narváez et al. (1997), Gómez et al. (1999) and Seidl et al. (1999) have worked with the screw-type signals and the features of the different seismic sources. Carcolé et al. (2006) estimated a 3D distribution of relative scattering coefficients for the two analyzed frequency bands (4-8 and 8-12 Hz). Their study found two zones of strong scattering: the shallower one is located at a depth from 4 km to 8 km under the summit whereas the deeper one is imaged at a depth of ~37 km from the Earth's surface. Lacruz et al. (2009) have approach the attenuation imaging of this volcano based on the assumption of uniform distribution of Qc over a spheroidal shell with its volume determined by the associated source-receiver distance. Ugalde et al. (2010) estimated the intrinsic absorption and scattering attenuation by means of a fitting procedure between the observed and synthetic coda envelopes in four frequency bands (1-2, 2-4, 4-8, and 8-12 Hz). They found that the mean free path for scattering of S-waves range between 2.7 ≤ l ≤ 8.1 km, which are higher than those obtained in other volcanic regions of the world. However, nobody has worked on the spatial variation of the Qc parameter using the assumption of uniform distribution of Qc over an ellipsoidal shell, so this is an innovative study that enlarges the knowledge about the Galeras volcano and the application of the coda-wave attenuation for imaging the crustal structure.
The Galeras volcano is in the Galeras Volcanic Complex (GVC), located in south western Colombia, a region with a metamorphic rocks basement of Precambrian and Paleozoic ages. The basement is overlaid by metamorphic rocks of Cretaceous age with low and medium grade associated with amygdular metabasalts. All this is covered by volcano-sedimentary units of Tertiary age that made a plateau, over which the Pleistocenic and Holocenic volcanoes have emerged (Hurtado and Cortés, 1997). The GVC has erupted lavas and pyroclastic flows, ranging from basaltic andesites to dacites, during the last million years. The chemical composition of the volcanic products has been fairly constant, characterized by calc-alkaline, high-silica, medium-potassium andesites. Variations from basaltic andesites to dacites have occurred during individual stages, but overall, composition and petrographic characteristics are quite constant (Calvache and Williams, 1997a).
The tectonic of this region is very complex, being with the result of the collision between the Nazca and South American plates, which causes the uplift of the Andes and the volcanism in the region. The structural trend is N40°E and the principal tectonic feature is the Romeral Fault Zone, which has been interpreted as the limit between continental crust at East and the oceanic crust at West (Barrero, 1979). This system includes the Silvia-Pijao and Buesaco faults. Both faults cut the Galeras volcano structure, and are associated with many old caldera systems. The Machabajoy, Pasto, Guaitara, San Ignasio and Magdalena faults limit the volcano structure with similar trend (FIGURE 1).
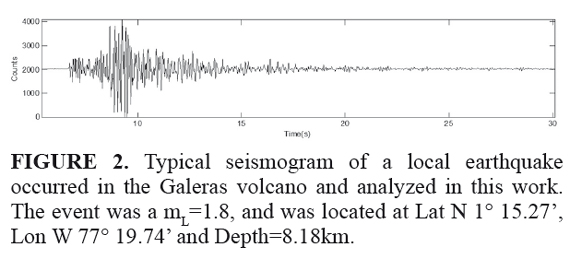
The seismic data used in this study covered 435 earthquakes recorded in the period between September 1989 and June 2002. The seismograph network installed on the Galeras is composed of 19 stations equipped with vertical component L-4C seismometers with 1.0 second natural period. All seismograph stations, however, have not operated continuously through time because various modifications in the network configuration. The ground motions are sent by radio to an observatory in Pasto city and the signals are sampled with an ADC system of 12 bits at a rate of 100 sec-1. The complete system has a flat response between 1.0 and 25.0 Hz. We used earthquakes with local magnitude less than 2.0 to avoid clipping. FIGURE 2 shows a typical seismogram of a local earthquake occurred in the Galeras volcano and analyzed in this work.
Coda Q
We follow the Single Backscattering (SBS) model of Aki and Chouet (1975) for calculating the coda Qc-1. This assumes that the coda of a local earthquake is composed of the sum of secondary S-waves produced by heterogeneities distributed randomly and uniformly in the lithosphere. The coda is the portion of seismogram corresponding to back-scattered S-waves. We have estimated Qc-1 values using the following equation (Aki and Chouet, 1975):
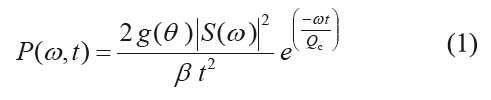
where, P(ω,t) is the time-dependent coda power spectrum, ω is the angular frequency, ω is the shear wave velocity, |S(ω)| is the source spectrum, and g(ω) represents the directional scattering coefficient, defined as 4π times the fractional loss of energy by scattering per unit travel distance of primary waves and per unit solid angle at the radiation direction θ measured from the direction of primary wave propagation. Under these considerations, the geometrical spreading is assumed to be proportional to r-1, which only applies to body waves in a uniform medium. The source factor can be treated as a constant value for single frequency, therefore according to equation (1), Qc -1 values can be obtained as the slope of the least squares fit of ln[t2P(ω,t)] versus ωt, for t>tβ, where tβ represents the S-wave travel time (Rautian and Khalturin, 1978; Vargas et al., 2004).
Regionalization technique
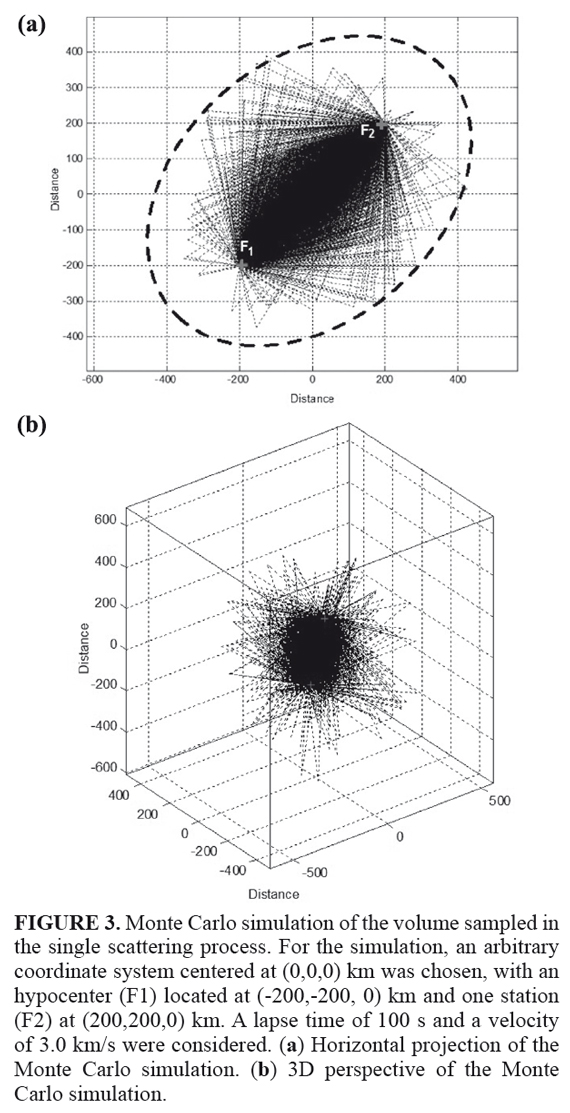
Following Singh and Herrmann (1983), a way for regionalizing the Qc is based on the work of Malin (1978) who, expanding on the work of Aki (1969) and Aki and Chouet (1975), realized that the first order scatterers responsible for the generation of coda waves at a given lapse time are located on the surface of an ellipsoid having earthquake and station locations as foci. According to Pulli (1984), in the ellipsoidal volume sampled by coda waves at a time t, the large semi-axis is defined as a1=βt/2, and the small semi-axis as a2 = a3 = (a12 - r2/4)1/2, where r is the source-receiver distance of the ellipsoid. We have confirmed the volume sampled by coda waves in the case of single isotropic scattering, simulating numerically the movement of many particles, which represents the propagation of S-wave energy using a Monte Carlo method. The basic assumptions for the numerical simulation are: (1) the scattering is isotropic; (2) scattered waves are incoherent and poin-tlike scatterers are randomly distributed with a uniform density; (3) a short duration point-like source radiates S waves spherically; (4) there are no conversions between P and S waves, which travel with a constant S wave velocity. The assumptions and procedure are described in Hoshiba (1991). FIGURE 3 shows the simulation test for the case of single scattering. It can be observed that, in the first order scattering the sampled volume in the attenuation process is closer to the segment defined by the hypocenter-station path that delineates an ellipsoid with focis hypocenter (F1) and station (F2). Consequently, we have assumed that the average sampled volume can be represented by tav=tstart+Δtwin/2, where tav is the average lapse time for the first order scattering, tstart is the starting lapse time, and Dtwin is the window length. Then, by knowing the volumes of the ellipsoids shells sampled during Δtwin, a generalized inversion for regional Qc can be performed. For the purpose of inversion, we define a geographic grid about the seismic station that also encloses the hypocenter. Herein, we recognize that each measured Qc is an average estimate Qav (or Qapparent) for the volume sampled by the ellipsoid given by:
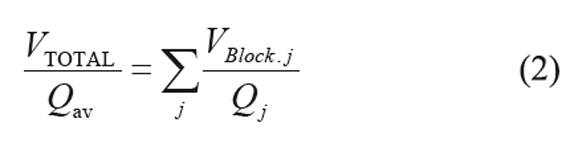
where VBlock-j is the fraction of volume (block) in an ellipsoidal region with the true attenuation coefficient Qj (or Qtrue). Assuming a constant velocity of propagation, the volume travelled by a ray that leaves the hypocenter, moves out to the ellipsoid defined by the observation time of the coda, and is scattered to the receiver, can be determined.
Equation (2) can be written as:
where, the ratio VBlock-j/VTOTAL is just the volume fraction associated to the total scattered wave travel path spent in the jth block. If the process is repeated for each station-hypocenter pair, the entire region is sampled. Equation (3) is of the form
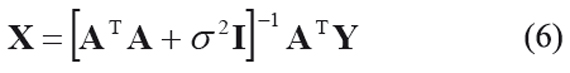
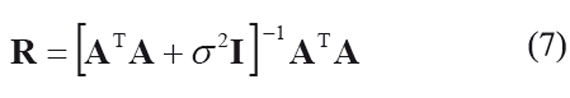
Then, a least squares estimate of the xi is given by the compact matrix equation:
where A is a (k x n) coefficient matrix, X a (n x 1) vector, Y a (k x 1) vector and k is the number of station-hypocenter pairs. A solution of (5) is estimated using the damped least square technique of Crosson (1976). According to this technique the solution and resolution matrices can be found with next equations:
The method described above was used for the regionalization of Qc in several synthetic tests in the Galeras volcano.
Synthetic tests
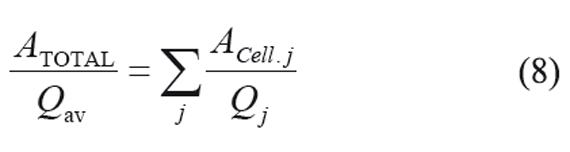
Several tests were done in order to evaluate the efficiency of this procedure. First we solved the problem in 2D for a distribution of regular attenuation anomalies in an area where many station-epicenter pairs were well dispersed. FIGURE 4.a shows a model with two areas associating different attenuation values that are divided into 8x8 cells. In this case only two Qc values have been used: Qc =30 and Qc =90. On this attenuation distribution 500 random ellipses were calculated, that allowed sampling the model mainly in the central zone (FIGURE 4.b). Then we calculated elliptical areas and their Qav (pondered by the distribution attenuation areas) associated with every hypothetical station-epicenter pair. The area fractions in a grid of regular cells permitted building an equation system as:
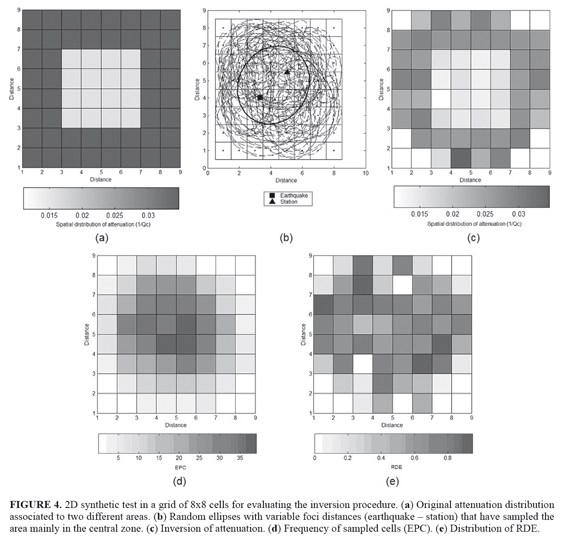
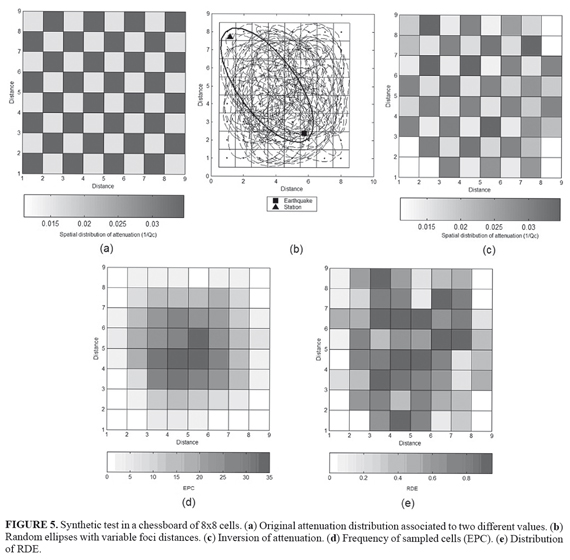
FIGURES 4.c, 4.d and 4.e represent respectively the inverted model, the number of Ellipses per Cell (EPC) and the resolution diagonal elements matrix (RDE) of the system expressed with the equation (8). As we can see, in cells covered with enough ellipses the solution is reliable and true attenuation values (1/ Qc) were well restored. A second 2D synthetic test was developed to evaluate the performance in a more complex frame using a chessboard (FIGURE 5.a). Again, we can see that contrast between high and low attenuation values were well restored (FIGURES 5.b to 5.e). However, these results suggest that there are necessary many station-epicenter pairs with different r that guarantees a well covered area.
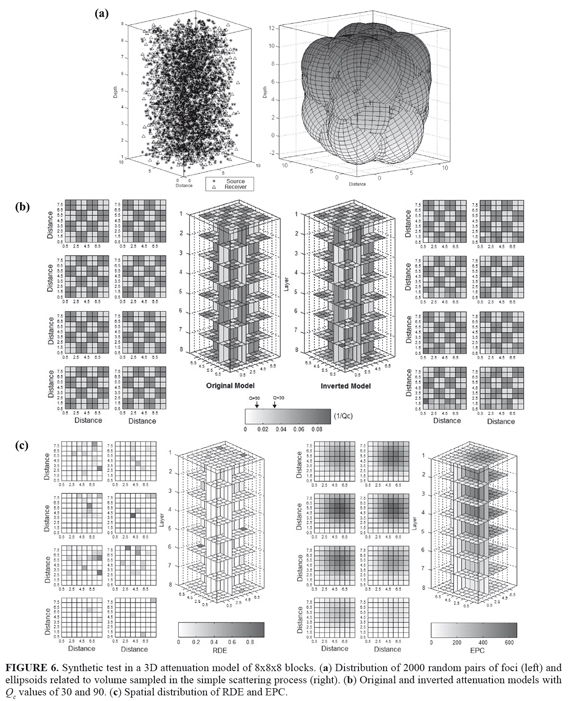
Similarly, we have extended this procedure to 3D models. Two synthetic tests have been analyzed. In the first one we have considered a 3D chessboard with Qc values of 30 and 90. In this scenario we have considered 2000 ellipsoidal focis that sampled well the entire volume (FIGURE 6.a). We have supposed an ideal frame where stations can be located in depth, in places that suggest us to have a better volume sampled. FIGURE 6.b shows how the inversion procedure, in a grid of 8x8x8 blocks, highlights reasonably the attenuation values in the volumes well sampled. Similarly, the RDE and Ellipsoids per Cell (EPC) values represents a good tool to detect the zones well solved and covered with enough ellipsoids (FIGURE 6.c).
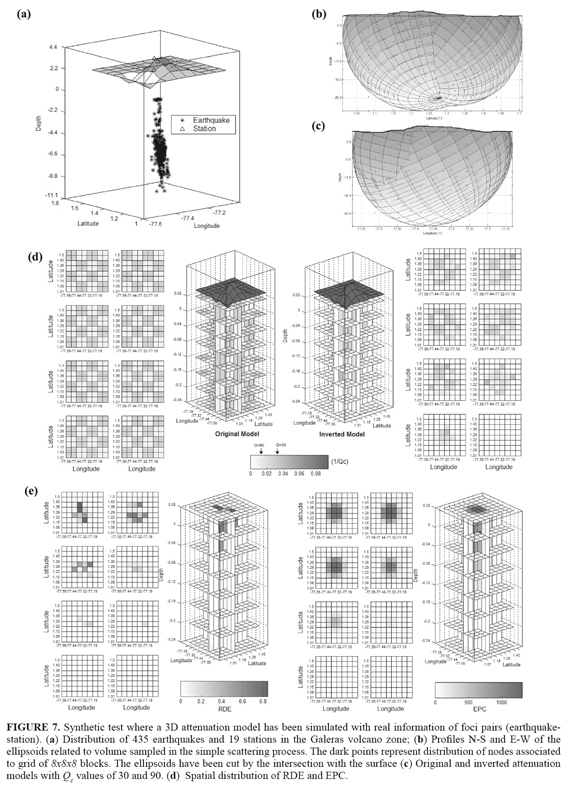
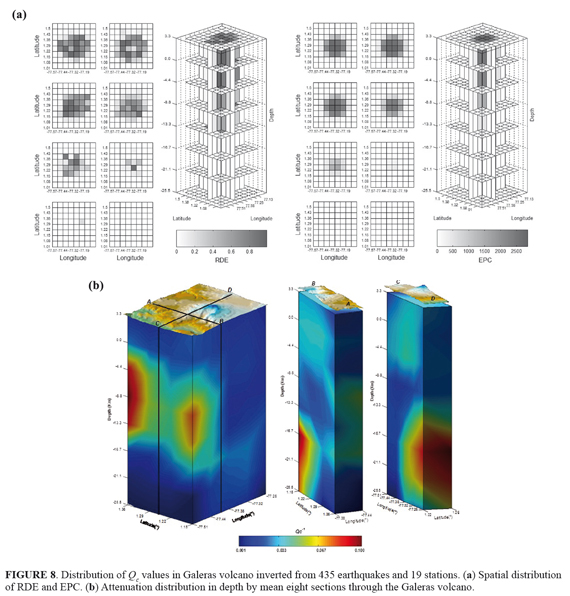
However, we wished know how is the behavior of available data (earthquakes and stations) to determine the presence of attenuation anomalies. A new test was considered to evaluate the inversion performance to determine the same structure used in last test with 19 stations and 435 earthquakes. FIGURE 7.a shows distribution of stations and earthquakes located mainly between 0.0 and 10.0 km depth from summit of the Galeras volcano. The dark points in the vertical projection of the ellipsoids (FIGURE 7.b) represent nodes associated to a grid of 8x8x8 cells that has been used to inversion of Qc values. This distribution of foci allowed us to have sampled volumes that cover almost all the Galeras volcano structure. As we can see in FIGURE 7.c, a comparison of 3D Qc values distribution between original and inverted model suggests a well solved model mainly where there are enough concentration of ellipsoids, that is, in the longitude range between 77.5°W and 77.2°W; latitude range between 1.1°N and 1.5°N, and depth range located between 5.5 and -16.7 km. However, the distribution of RDE and EPC values (FIGURE 7.d) show that above 5.5km and below -11.0km the results would not be reliable.
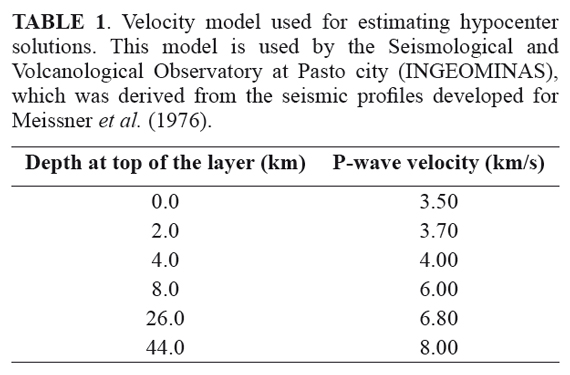
The 435 earthquakes selected for this study permitted to calculate 2855 Qc values. Hypocenter determinations we used the computer program HYPO71 (Lee and Lahr, 1975) and the velocity model adopted by the Pasto Volcano Observatory (TABLE 1) that was defined using regional seismic reflection profiles (Meissner et al., 1976). We carefully selected seismograms of located earthquakes with root mean square residuals of calculated travel times and observed times (RMS) less than 0.1 sec, azimuthal separation between stations (GAP) less than 180°, and horizontal and vertical errors in locations of less than 1 km. FIGURE 7.a shows the location of the seismograph stations and selected earthquakes used.
Qc values
The time-dependent coda power spectrum, over a time-window of 2.0 sec, was calculated as the mean squared amplitudes of the coda Aobs(fr,t) from band pass filtered seismograms around centre frequency 3.0 Hz with the respective bandwidth 1.0-5.0 Hz. The squared amplitudes were averaged in a 50% overlapping time window of t±0.2 sec. Then, Qc-1 was estimated for each seismogram by means of a least-squares regression of equation (1) using a time window of 2(r/β) to 2(r/β)+5 sec from the origin time of the earthquake. Following Aki and Chouet (1975) we have estimated a pondered average S-wave velocity of β=3.0 km/s in the depth range 0 to 26 km, assuming a Vp/Vs = 1.78 (Moncayo et al., 2004), which permit to find the Qc-1 values and to extend them to the tomographic procedure under the hypothesis SBS model and the assumptions of Hoshiba (1991). Only those amplitudes higher than twice the background noise level were considered for the regression and only Qc-1 values obtained from least-squares fit with correlation coefficients greater than 0.7 were kept. With the central frequency and the ω selected we can estimate anomalies with a wave-length of ~1 km.
3D Qc structure under the Galeras volcan
The dense data coverage at Galeras volcano allow to find a zone resolved in the depth range between 3.3 km to -13.3 km, longitude range -77.32° to -77.51°, and latitude range 1.15° to 1.36° (FIGURE 8.a). This volume is associated to several attenuation anomalies that suggest the presence of an intricate system of magma bodies. At least three main attenuation anomalies are evident: 1) in the southeast; 2) in the southwest; and 3) in the northwest of the main cone (FIGURE 8.b). These possible bodies have geometric centres at depths of 9.0 km at NW, >13.3 km at SW, and >13.3 km at SE from crater and have connections through several minor anomalies that, although they are not totally clear in depth, could be associated with the Silvia-Pijao and Buesaco faults. In general, we can see that the rock surrounding the anomalies has Qc values between 50 and 100, and the anomalies have contrast Qc values between 10 and 30.
Ugalde et al. (2010) reported that the main contribution in to the coda envelope at f=3Hz in the GVC is associated to scattering effects. It means that the heterogeneity contributions for the scale length of the analyzed frequency could be related to the tectonic setting that allowed the emplacement of the volcano. Sánchez et al. (2005) reported a two- and three-dimensional mapping of b-value that illuminates a vertically elongated structure beneath the active crater of Galeras, which may be associated with a conduit, or alternatively, with a shallow region of temporary magma storage. This configuration could be related to a fracture system that allows the magma emplacement and explains the scattering effects identified in the attenuation analysis.
On the other hand, it seems very feasible that the minor contribution of the intrinsic attenuation could be associated to rocks partially melted or rich in fluids. Related to this interpretation, Calvache and Williams (1992) and Banks et al. (1997) found that many of the pyroclastic flows deposits already Galeras volcano during the past 50 ka are lithic rich, with fines and clasts so strongly altered by hydrothermal action before eruption which evidences a long-lived hydrothermal system that indicates susceptibility to mass failure and explosive events.
Under the hypothesis that the spatial distribution of attenuation found in this work represents the combined effect of fractures that have been filled by hydrothermal material, we identify an important volume of magma at depth (>13.0 km) that feeds minor shallow magma chambers throughout the fracture system. This fracture system plays a relevant role for the fumaroles activity and explosive eruptions. Stix et al. (1993) based on the record of explosive eruptions since May 1989 to Jun 1992 suggest that the actual magma under Galeras volcano is degassing at depth in the magma chamber and in the conduits. This degassing has reduced the H2O, S, and Cl contents of the magma and generates a sealing process that forces gas-saturated magma to release volatile components into confined spaces, thereby causing pressurization and explosive eruptions. Stix et al. (1997) proposed a model of vulcanian eruption for Galeras assuming that two scenarios for pressurization related with six eruptions occurred during 1992-1993 involving edifice weakening and the development of a shallow hydrothermal system from continued degassing of the magma plug. As weakening of the edifice formed an extensive system of fractures, the shallow hydrothermal system deepened due to meteoric water input and magmatic degassing. With time, a greater number of fractures were filled and partly sealed by hydrothermal minerals at progressively deeper levels. As a result, the source of the overpressure also deepened with time.
Similar models have been proposed by Fischer et al. (1996), Heiligmann et al. (1997), Alfaro and Zapata (1997) and Gil Cruz and Chouet (1997), who based on data of fumaroles, eruptive activity, diffuse degassing, and long period seismic events, identified that about some hundred meters at NW of the main crater is located the principal hydrothermal system which is structurally controlled. In this sector Ordóñez and Rey (1997) reported that at the end of 1990, a deformation source was located at a depth of 2-3 km. By December 1991, the source had migrated to less than 500 m in depth. Calvache and Williams (1997b) suggested that the dome formed was product of a magma mixing event occurred early in the history of its emplacement, and the uppermost part of the dome was degassing freely in the surface for ten months and produced an isolate of the magmatic system. The July 1992 eruption tapped not only the uppermost part of the dome but also a deeper H2O-saturated magma.
Calvache (1990) based on petrologic evidences, suggested a model to explain the eruptive processes at Galeras volcano. The model proposes the presence of a small magma reservoir located at little depth, which is connected to a deeper big deposit. Initial assumption of the model suggests that dacite magma suffers a fractioned crystallization process in the shallow chamber; latter, recharge events of basic material from the deep levels, generates mixture processes. Calvache (1990) concluded that disposition of a superficial chamber is responsible for causing vulcanian type explosions like consequence of mixture of shallow magma with deep basic magma. In agreement with this model, we can suggest that the main attenuation anomalies inverted from Qc values correspond to the two magma deposits.
Moncayo et al. (2004) have reported temporal changes in the Qc values at Galeras associated to changes in the volcanic activity. Along these changes they found a fall in the attenuation between 1989 and 1991, which has been associated with a degassing process that begins after the 1989 eruption. The rise between October 1991 and July 1992 was related to important changes in the volcanic activity, such as the extrusion of the andesitic dome with accompanying shallow deformation, increase in the rates and amplitudes of long-period seismic events, and a decrease in the SO2 flux. Moncayo et al. (2004) suggested that the conduit was partially blocked because the viscous magma in the dome acted like a seal that stopped the gas flux; this caused a increase in the pressure and attenuation that ended with the July 1992 eruption. After this explosive eruption the dome was destroyed, and the gas released, so the pressure drops and so does the attenuation. A little rise took place before the June 1993 eruption, and they proposed that this can be caused by the formation of small plugs that are destroyed in subsequent eruptions. In this scenario, the extension of the shallow attenuation anomaly from depth to surface is related with the presence of plugs and fluids that are constantly fed from a deeper body and produce the actual hydrothermal activity with eruptive events. The most recent events e.g. November, 2005, as well August, 2005, generated the evacuation of people (aprox. 9000 persons) of the at least four towns around the Galeras volcano (Mapachico, Jenoy, La Florida and Nariño). However, the big volume involved in this process suggests that more eruptive events may be expected at the Galeras volcano.
We can conclude that the inversion process applied to estimate the spatial coda wave attenuation in the Galeras volcano allowed us to determine the presence of two levels of anomalies which should be related to bodies of partially melted rocks that are located around 6.0 km and >13.2 km depth from the summit. These bodies are responsible for causing vulcanian type explosions as a consequence of mixture of shallow magma with deep basic magma. The shallow body extends to the summit and represents the presence of plugs and fluids that are constantly feed from a deeper body and produce the actual hydrothermal activity with eruptive events.
We thank INGEOMINAS (Servicio Geológico Colombiano) for the technical support for this study, specially colleagues from the Vulcanological and Seismological Observatory of Pasto OVSP for their comments. This work has been partially supported by Geophysical Group of the Universidad Nacional de Colombia.
Aki, K. 1969. Analysis of the seismic coda of local earthquakes as scattered waves. J. Geophys. Res., 74: 615-631. [ Links ]
Aki, K., and Chouet, B. 1975. Origin of coda waves: source, attenuation and scattering effects. J. Geophys. Res., 80: 615-631. [ Links ]
Alfaro, C., and Zapata J.A.† 1997. Acid gas emissions from Galeras Volcano, Colombia, 1989-1994. Jour. Volcanol. Geotherm. Res.,77: 209-228. [ Links ]
Banks, N., Calvache, M.L., and Williams, S.N. 1997. Stratigraphy and radiometric ages of Volcán Galeras, Colombia. Jour.Volcanol. Geotherm. Res., 77: 39- 56. [ Links ]
Barrero, D. 1979. Geology of central western cordillera west of Buga and Roldanillo, Colombia. Internal report. INGEOMINAS, Bogotá (Colombia). [ Links ]
Calvache, M.L. 1990. Geology and volcanology of the recent evolution of Galeras volcano, Colombia. M.S. Thesis, Louisiana State University. [ Links ]
Calvache, M.L., and Williams, S. N. 1992. Lithic-dominated pyroclastic flows at Galeras volcano, Colombia- An unrecognized volcanic hazard. Geology, 20 (6): 539- 542. [ Links ]
Calvache, M.L., Cortés, P., and Williams, S. 1997. Stratigraphy and chronology of the Galeras Volcanic Complex, Colombia. Jour.Volcanol. Geotherm. Res., 77: 5-19. [ Links ]
Calvache, M.L., and Williams, S.N. 1997a. Geochemistry and petrology of the Galeras Volcanic Complex, Colombia. Jour.Volcanol. Geotherm. Res.,77: 21-38. [ Links ]
Calvache, M.L., and Williams, S.N. 1997b. Emplacement and petrological evolution of the andesitic dome of Galeras volcano, 1990-1992. Jour.Volcanol. Geotherm. Res.,77: 57-69. [ Links ]
Carcolé, E., Ugalde, A., and Vargas, C. 2006, Three-dimensional spatial distribution of scatterers in Galeras volcano, Colombia, Geophys. Res. Lett., 33, L08307, doi:10.1029/2006GL025751 [ Links ]
Cepeda, H. 1986. Investigaciones petrológicas en el ambito de las planchas 429-Pasto y 410-La Union, con especial énfasis en el Complejo Volcánico del Galeras. Internal report. INGEOMINAS, Medellín (Colombia). [ Links ]
Crosson, R.S. 1976. Crustal Structure Modeling of Earthquake Data, 1. Simultaneous Least Squares Estimation of Hypocenter and Velocity Partameters. J. Geophys. Res., 81: 3036-3046. [ Links ]
Fischer, T.P., Arehart, G.B., Sturchio, N.C., and Williams, S.N. 1996. The relationship between fumarole gas composition and eruptive activity at Galeras volcano, Colombia. Geology, 24 (6), 531- 534. [ Links ]
Fischer, T.P., Arehart, G.B., Sturchio, N.C., Counce, D., Stix, J., and Williams, S.N. 1997. Chemical and Isotopic Composition of Fumarole Gases and Spring Discharges from Galeras Volcano, Colombia. Jour. Volcanol. Geotherm. Res., 77: 229- 254. [ Links ]
Gil Cruz, F., and Chouet B. 1997. Long-period events, the most characteristic seismicity accompanying the emplacement and extrusion of a lava dome in Galeras Volcano, Colombia, in 1991. Jour.Volcanol. Geotherm. Res.,77: 121-158. [ Links ]
Gómez, D.M., and Torres, R.A. 1997. Unusual low-frequency volcanic seismic events with slowly decaying coda waves observed at Galeras and other volcanoes. Jour.Volcanol. Geotherm. Res., 77: 173 -193 [ Links ]
Gómez, D.M., Torres, R.A., Seidl, D., Hellweg, M., and Rademacher H. 1999. Tornillo seismic events at Galeras volcano, Colombia: a summary and new information from broadband three-component measurements. Annali di Geofisica, 42(3): 365 - 378. [ Links ]
Hurtado, A.D., and Cortés, G.P. 1997. Third version of the hazard map of Galeras Volcano, Colombia. Jour. Volcanol. Geotherm. Res.,77: 89-100. [ Links ]
Heiligmann, M., Stix, J., Williams-Jones, G., Sherwood, B., and Garzón, G. 1997. Distal degassing of radon and carbon dioxide on Galeras volcano, Colombia. Jour. Volcanol. Geotherm. Res.,77: 267-283. [ Links ]
Hoshiba, M., 1991. Simulation of multiple scattered coda wave excitation based on the energy conservation law. Phys. Earth Planet. Int., 67, 123-136. [ Links ]
Lacruz, J., Ugalde, A., Vargas, C.A., and Carcolé, E. 2009. Coda-Wave Attenuation Imaging of Galeras Volcano, Colombia. Bulletin of the Seismological Society of America, 99: 3510 - 3515. [ Links ]
Lee, W.H., and Lahr, J.C. 1975. HYPO71: A computer program for determining hypocenter, magnitude, and first motion pattern of local earthquakes. U.S. Geological Survey. Open-File report 75-311. [ Links ]
Malin, P.E. 1978. A first order scattering solution for modeling lunar and terretrial seismic coda, Ph.D. dissertation, Princeton Universtiy, Princeton New Jersey. [ Links ]
Meissner, P.O., Flueh, E.R., Stribane, F., and Berg, E. 1976. Dynamics of the active boundary in southwest Colombia according to recent geophysical measurements. Tectonophysics, 35: 113-136. [ Links ]
Moncayo, E.N., Vargas-Jiménez, C.A., and Duran- Tovar, J.P. 2004. Temporal variation of coda Q at Galeras volcano, Colombia. Earth Sci. Res. J., 8 (1):19-24. [ Links ]
Muñoz, F.A., Calvache, M.L., Cortés, G.P., Gómez, D.M., Narvaez, L., Ordonez, M., Ortega, A., Torres, R., Silva, B., Williams, S.N., Sanders, C.O., and Stix, J. 1993. Galeras Volcano, Colombia: the Decade Volcano Workshop and disastrous 14 January, 1993 eruption. EOS, 74 (26): 281- 287. [ Links ]
Narváez, L., Torres, R., Gómez, D., Cortés, P., Cepeda, H., and Stix, J. 1997. "Tornillo"-type seismic signals at Galeras volcano, Colombia, 1992-1993. Jour.Volcanol. Geotherm. Res., 77: 159-171. [ Links ]
Ordóñez, M., and Rey, C.A. 1997. Deformation associated with the extrusion of a dome at Galeras volcano, Colombia, 1990-1991. Jour.Volcanol. Geotherm. Res.,77: 115-120. [ Links ]
Pulli, J.J. 1984. Attenuation of Coda Waves in New England. Bull. Seism. Soc. Am., 74: 1149-1166. [ Links ]
Rautian, T.J., and Khalturin, V.I. 1978. The Use of the Coda for the Determination of the Earthquake Source Spectrum. Bull. Seismol. Soc. Am. 68: 923 - 948. [ Links ]
Sánchez, J.J., Gómez, D., Torres, R., Calvache, M.L., Ortega, A., Ponce, A.P., Acevedo, A.P., Gil Cruz, F., Londoño, J.M., Rodríguez, S.P., Patiño, J., and Bohorquez, P. 2005. Spatial mapping of the b-value at Galeras volcano, Colombia, using earthquakes recorded from 1995 to 2002. Earth Sci. Res. J., 9(1): 30-36. [ Links ]
Sano, Y., Gamo, T., and Williams, S.N. 1997. Secular Variations of Helium and Carbon Isotopes at Galeras Volcano, Colombia. Jour.Volcanol. Geotherm. Res., 7: 255 - 266. [ Links ]
Seidl, D., Hellweg, M., Rademacher, H., Gómez, D.M., and Torres, R.A. 1999. The anatomy of a tornillo: puzzles from three-component measurements at Galeras volcano (Colombia). Annali di Geofisica, 42 (3): 355 - 364. [ Links ]
Singh, S., and Herrmann, R. 1983. Regionalization of Crustal Coda Q in the Continental United States. J. Geophys. Res., 88 (B1): 527-538. [ Links ]
Stix, J., Zapata, J.†, Calvache, M., Cortés, G., Fischer, T., Gómez, D., Narvaez, L., Ordoñes, M., Ortega, A, Torres, C., and Williams, S., 1993. A model of degassing at Galeras Volcano, Colombia, 1988-1993. Geology, 21: 963 - 967. [ Links ]
Stix, J., Calvache, M.L., and Williams, S.N. 1997. Galeras Volcanic Complex, Colombia, Introduction to an Interdisciplinary Study of a Decade Volcano. Jour. Volcanol. Geotherm. Res., 77: 1- 4. [ Links ]
Vargas, C.A., Ugalde, A., Pujades, L., and Canas, J. 2004. Spatial variation of coda wave attenuation in northwestern Colombia. Geophys. J. Int., 158: 609-624. [ Links ]
Ugalde, A. Carcole, E., and Vargas, C.A. 2010. S-wave attenuation characteristics in the Galeras volcanic complex (south western Colombia). Physics of the Earth and Planetary Interiors, 181: 3-4 (73-81). [ Links ]
Zapata, J.†, Calvache, M.L., Cortés, P., Fischer, T., Garzon, G., Gómez, D., Narváez L., Ordóñez, M., Ortega, A., Stix, J., Torres, R., and Williams, S. 1997. SO2 fluxes from Galeras Volcano, Colombia, 1989-1995: Progressive degassing and conduit obstruction of a Decade Volcano. Jour.Volcanol. Geotherm. Res., 77: 195-208. [ Links ]
Trabajo recibido: Mayo 1 de 2012
Trabajo aceptado: Diciembre 21 de 2012
