


 English (pdf)
 Article in xml format
 Article references
 Send this article by e-mail
 Cited by SciELO
  Cited by Google
  Similars in
SciELO
Similars in
SciELO  Similars in Google
 Permalink
Introduction
The study area is located in Upper Magdalena Basin, Colombia (Figure 1); more specifically in the Neiva Sub-Basin.
The last years Neiva Sub-Basin have been underexplored, because the most prospective areas are associated with subthrust structures and the majority of drilled wells have been unsuccessful (De Freitas, 2000). In this context, the oil exploration is linked with the Saldaña Formation (basement) that is overlying the sedimentary sequence (De Freitas, 2000; Macellari et al., 2003).
The geology and stratigraphy of the Neiva Sub-Basin have been described in several works (Carrera-Ortiz, 2015; Jiménez-Díaz, 2008; Mojica and Franco, 1990) but due to lack of high quality in 2D seismic images and new exploration concepts (De Freitas, 2000; Macellari et al., 2003), little attention has been paid to the subthrust structures, principally in the possible prospective zones beneath Chusma, San Francisco and Upar faults. Also, the most recent (2015 – 2017) 2D and 3D seismic information (which possibly has better image quality) is confidential in this area of Colombia.
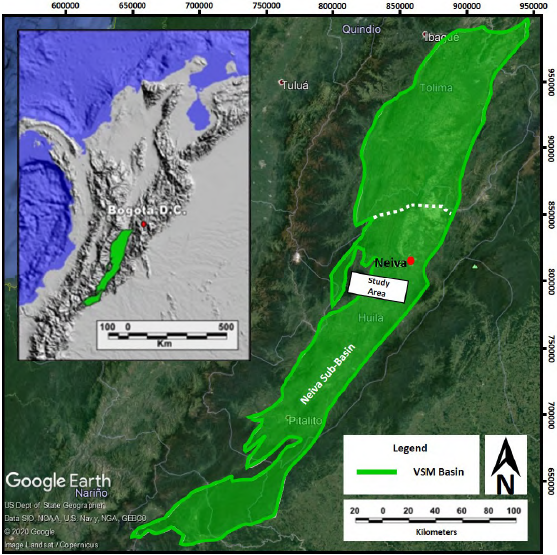
Figure 1. Study area location in Upper Magdalena Basin. Modified from Google Earth (2020) and Carrera-Ortiz (2015).
The main target of this work is to try a 2D geophysical modelling applying wavefield illumination method, from two different seismic interpretations associated to one velocity scenario built from wells and seismic velocities (Macellari et al., 2003; Duarte et al., 2019) in a two stages methodology; in order to evaluate if the illumination could be improved for this section even in the zones under Chusma and Upar faults.
First, we proposed to applicate the illumination by wavefield in a section of the Upper Magdalena Basin due to the geological characteristics of the area. There is a structural configuration that exhibits possible structural traps located below the Chusma and Upar faults which present high dips that produce fault shadow zones. Therefore, the proposed structural styles and geological models were first studied (Blanco and De Freitas, 2003; Jiménez-Díaz, 2008; Macellari et al., 2003) and two different geological models were interpreted for the same seismic image (PSDM), taking into account that the stratigraphy in this part of the basin shows strong velocity contrasts (rocks of the Saldaña Formation overlying the sedimentary sequence) (Macellari et al., 2003; Duarte et al., 2019).
Later, the velocities were estimated to assign them to the geological models and to obtain the geophysical models 1 and 2. These geophysical models were the input data for the wavefield simulation in a software tool (a software tool was developed while we performed the exercise but is under confidentiality yet, so this part of the process cannot be detailed even the order we use the equations) in which the parameters of the original acquisition geometry were setting.
Finally, we concluded that is important to apply this methodology at the initial stages of the exploratory process because allows the option to improve the illumination because acquisition geometries could be tried to reduce the uncertainty acquiring better seismic images and possible better interpretations in the target zones like subthrust areas in Upper Magdalena Basin.
Theoretical Frame
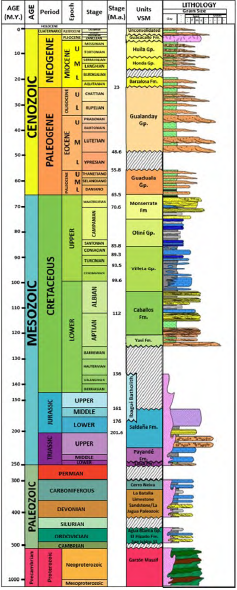
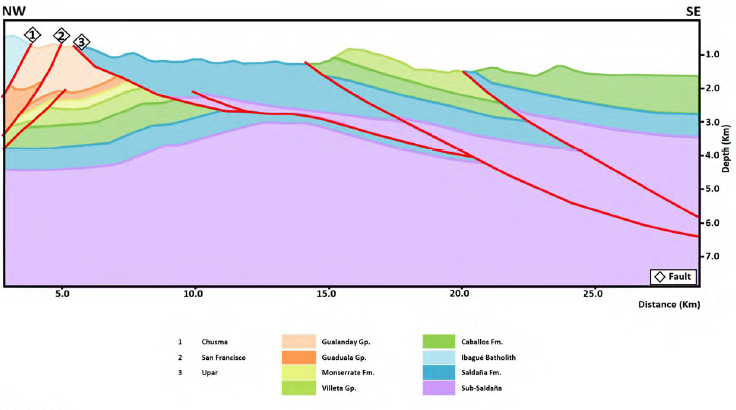
All the reported formations of the Neiva Sub-Basin in Upper Magdalena Basin are shown on the stratigraphic column in Figure 2. In chronological order, the formations are Saldaña, Ibagué Batholith, Caballos, Villeta Group, Monserrate, Guaduala Group and Gualanday Group. Saldaña Formation and Ibagué Batholith are Jurassic in age, Caballos Formation, Villeta Group and Monserrate Formation are Cretaceous in age, and the Guaduala and Gualanday groups are Paleogene in age (Aparicio, 2019; Carrera-Ortiz, 2015).
In Neiva Sub-Basin there are two different structural systems: The first, belongs to thrust faults with trajectories across the stratigraphy from the preCretaceous basement until overlying Cretaceous rocks (Mojica and Franco, 1990; Jiménez-Díaz, 2008) and is associated with Chusma Fault. The second structural system belongs to imbricated fans with blind thrust faults (not emergent faults) vergent to the west, associated in this area with Upar Fault. According to Mojica and Franco (1990), this part of the Upper Magdalena Basin has a compressive structural style that shows the stresses convergency to the Neiva Sub-Basin, exhibiting sedimentary rocks from Paleogene to Cretaceous below Jurassic rocks that forms complex structures.
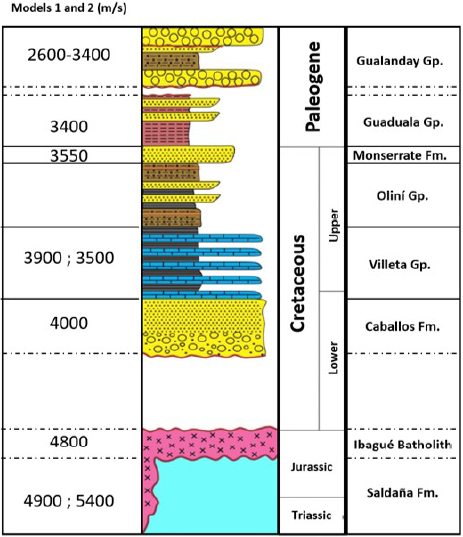
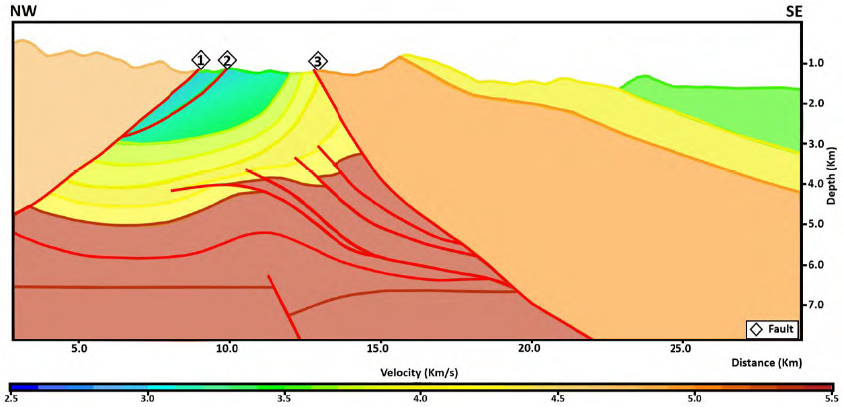
The velocity model needs to be consistent with the structural geology and stratigraphy following the sequence in age and using details about velocity information (Etris et al., 2001). For this reason; our velocity model was compound using the velocities described in Figure 3, estimated for this study area in Neiva Sub-Basin using the reported velocities in Macellari et al. (2003), where used basement velocities from a stratigraphic well and we also took the velocities reported in Duarte et al. (2019), where used velocity information from wells and seismic velocities.
According to Yan and Xie (2016), illumination analysis by wavefield provides vital information regarding the response of an imaging system to subsurface structures. In this context, the illumination analysis by wavefield applied to a geological model interpreted from a low quality seismic image (in depth) in a complex structures (subthrust zones) in Upper Magdalena Basin could show the geology response with the best adjust to the built geophysical model.
Methodology
We performed this work in a methodology with two stages:
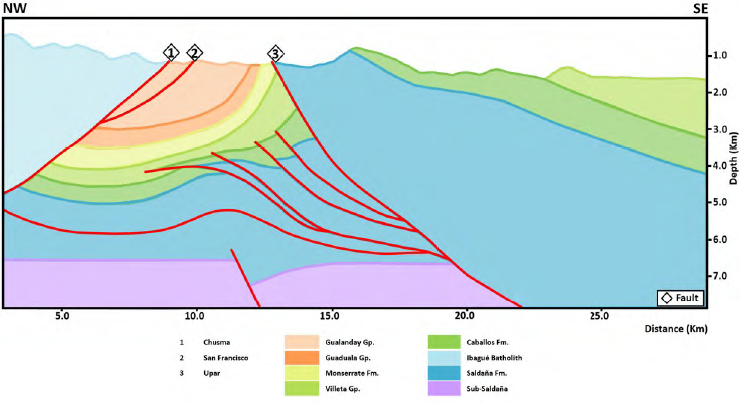
Stage 1: The input was a seismic line in depth located in the study area and two geological models were interpreted (Figures 4 and 5) from the line according with the stratigraphy and information of the two structural systems (Mojica and Franco, 1990) in this part of Upper Magdalena Basin and definitions about the Chusma and Upar faults (Blanco and De Freitas, 2003). It would be interesting to observe the migrated seismic image in depth, in order to accompany the interpretation patterns followed to build each geological model 1 and 2, but due to the confidentiality of this information it cannot be shown.
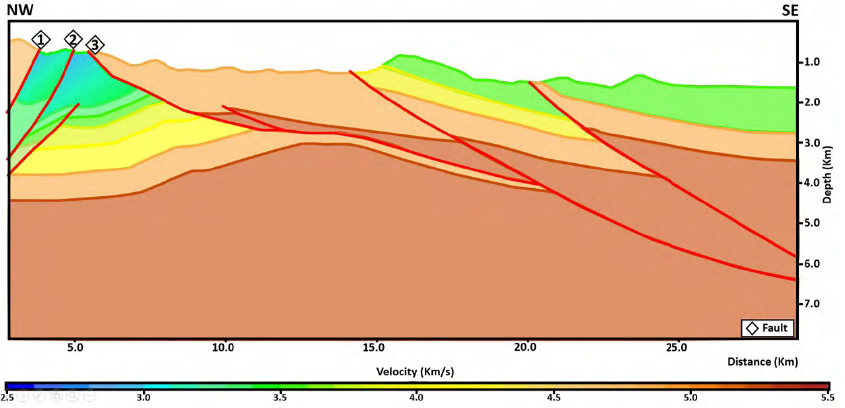
The structural systems proposed for both models were based on Mojica and Franco (1990) matching with a compressive stage in the Neiva Sub-Basin. Figure 4 shows model 1, that was interpreted like a triangle in thick skin zone (Aparicio, 2019) between Chusma and Upar Fault. Chusma Fault causes Ibagué Batholith overlies the sedimentary sequence and Upar Fault causes Saldaña Formation overlies the sedimentary sequence (De Freitas, 2000). Model 2 (Figure 5) was interpreted showing Upar Fault like a shortcut from other regional faults in the east of the section and Chusma Fault exhibits a high dip between Ibagué Batholith overlying Gualanday and Guaduala groups; and San Francisco Fault like an imbrication shows Gualanday and Guaduala groups overlying Caballos Formation and Villeta Group which in the same way overlying Caballos and Saldaña formations.
The velocities for each geologic unit were defined using wells and seismic information (Figure 3) from a close area with similar subthrust structures in Neiva Sub-Basin (Macellari et al., 2003; Duarte et al., 2019).
Then, a geophysical model was generated with the velocity scenario. The velocity scenario shows high velocities in the Saldaña Formation corresponding to volcano-sedimentary rocks and in the Ibagué Batholith high velocities corresponding to igneous rocks. The sedimentary rocks in Caballos Formation, Villeta Group, Monserrate Formation, Guaduala and Gualanday groups have lower velocities than Saldaña Formation and Ibagué Batholith.
In the velocity scenario, Saldaña Formation (De Freitas, 2000) and Ibagué Batholith rocks generates greater lateral contrast comparing to the sedimentary rocks.
Stage 2: The integration of the geological models with the velocity scenario in two geophysical models (Figures 6 and 7) was the input to start the illumination simulation process. Other input, was an acquisition geometry with coordinates for sources and receivers as the same way in a traditional 2D seismic acquisition. We used the same acquisition geometry as in the original seismic line for both models (Source interval: 30 meters; Receiver interval: 15 meters). The last input was a wavelet source bandlimited to simulate the perturbation in the source. Then, we use a wave equation solution to simulate the acquisition recording all the wavepaths in which the energy is distributed by the wavefield (Yan and Xie, 2016) to analyze how is the illumination for each proposed geological model.
Results
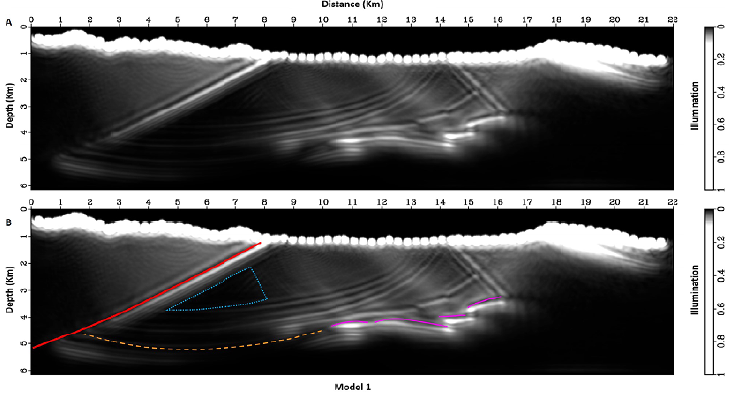
We obtained the illuminated sections and compared for each geological model with the original seismic image. We analyzed in both cases if the resulting illumination is the same or is better in the places where the input seismic image has low quality.
Figure 8, shows the resulting illuminated section for model 1. In this model, the illumination by wavefield improved the definition of reflectors beneath the Upar Fault associated with the branches in the blind imbricate fan (highlighted in magenta). Also, illuminated section for model 1 showed the same shadow zone beneath the Chusma Fault (polygon in dashed blue line) (Trinchero, 2000), which is attributed to the high dip in the Chusma Fault and the contrast between igneous, sedimentary rocks and the Saldaña Formation in the basement (De Freitas, 2000). The illuminated section in model 1 shows a non illumination zone under Saldaña Formation rocks in the SE.
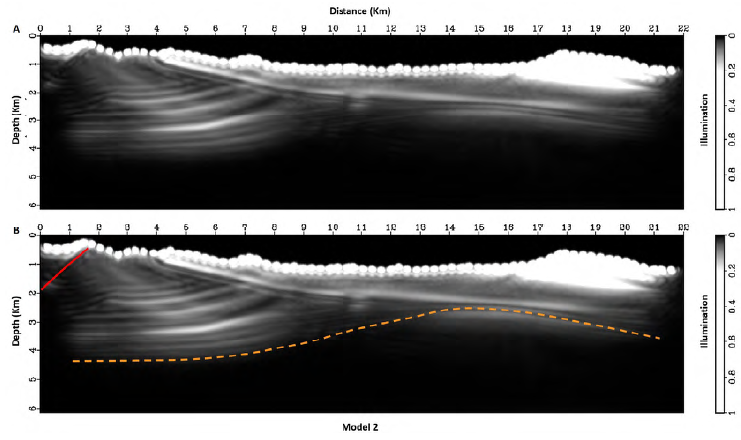
In model 2 (Figure 9) the illuminated section showed a better definition for the basement top (dashed yellow line) in contrast with the underlying pre-Jurassic rocks. In this model, the illumination in subthrust zones is showing a better definition for dip fault angles. The illuminated section in model 2 shows a non illumination zone under 4 km overall the section, which matches with sub-Saldaña rocks.
At final, the lateral velocity contrast between Saldaña Formation rocks (overlying Upar Fault) and Caballos Formation, Villeta Group, Monserrate Formation, Guaduala and Gualanday groups did not affect the possible prospect area underlying Upar Fault and the structural characteristics for a possible trap were better remained after wavefield illumination process.
Discussion
By using wavefield illumination, the illumination results in this area in Upper Magdalena Basin could be evaluated (Figures 8 and 9) and at least compared to reduce risk associated in oil exploration. The integration of this kind of techniques in oil exploration flow suggests the presence of structural traps with more precision that the traditional exploration flow because it can show the same geological model when the rocks properties are different (trying scenarios). For example, in this study case, the basin structural setting allows to try the geological models with the same velocity scenario. However, this methodology also allows to try different velocity scenarios that may help to find better resolution in the evaluated section for the target zone in the geological model.
It is highly recommended to apply this methodology in Colombian Basins that have the same or similar structural setting in order to find one more reliable way to propose the way ahead in oil exploration to solve one of the pitfalls associated to low quality seismic images in depth in subthrust areas.
The results are reasonable and within the geological constraints, because the combination of seismic images, structural interpretation, velocity models and geophysical modelling by wavefield illumination could be the best approach to improve oil exploration process in Upper Magdalena Basin.
The oil exploration has not finished in Upper Magdalena Basin and in the last years has migrated to subthrust prospects (underlying Saldaña Formation), that causes the technical challenge is to strength this kind of analysis in terms of achieve better definition in the target zones, being the most important to apply this methodology during the survey planning stage. Thus, we could compare different survey configurations using wavefield illumination before acquire new seismic information, the resolution on that resulting images could be better (medium to high quality images) and help the oil exploration to find other fields in this basin and increase the oil reserves in Colombia.
Conclusions
This method could be used in the oil and gas exploration process to improve the seismic acquisitions in structurally complex media, because the wavefield illumination method allows to see all of the wavepaths in the different pair of source-receivers in seismic designs and in seismic sections doing fast evaluations of the structure illumination.
Both geological models 1 and 2 were analyzed by wavefield illumination. We need to apply more wavefield tests in order to define the most appropriate settings (acquisition geometries) to improve the illumination under Chusma Fault and take more structural and geological information (surface geology and wells). That non illuminated zones under Chusma Fault is the same with the low quality zone in the seismic image (PSDM) used to interpret the geological models.
In the geological models 1 and 2, the zone underlying Upar Fault is preserved, showing a strength contrast between Saldaña Formation and sedimentary rocks (Caballos Formation, Villeta Group, Monserrate Formation, Guaduala and Gualanday groups) and the basement (Saldaña Formation). However, that causes a better reflectors definition along the Upar Fault showing the possible subthrust traps.
We choose an ideal model to reduce uncertainty in oil exploration, this is the model 2, because: 1) it presents a better delimitation for basement rocks and Chusma and Upar faults, 2) the possible traps are located in shallower depths (drilling costs reduced) and 3) the proposed velocity scenario matches with the study area stratigraphy.
It is necessary to clarify that this methodology needs to match with more information about the geology in the study area including non seismic geophysical methods to build and complement an exclusive velocity profile for each geological model, because structural interpretations are subjective and the data should support the investigation.

