


 English (pdf)
 Article in xml format
 Article references
 Send this article by e-mail
 Cited by SciELO
  Cited by Google
  Similars in
SciELO
Similars in
SciELO  Similars in Google
 Permalink
Introduction
The Exmouth Plateau sub-basin, located on the northwestern Australia offshore, is known for its gas reserves. Its major gas fields are Scarborough field with proven reserves of 11.1 trillion cubic feet (tcf), and the super-giant gas field of Io/Jansz with reserves of almost 20.1 tcf (Barber, 2013). These discoveries have increased the interest in the development and exploration of new prospects within this basin in the last decade. New 1D subsidence models that explain the thermal maturity, organic matter transformation, and thermal flow in the basin, will be helpful at delimitating new generation pods and defining migration pathways inside the basin. This research aims to understand the heat flow evolution and propose timing for hydrocarbon generation on the sub-basin.
1D burial history models are a useful tool in hydrocarbon exploration because they provide a history of evolution of a source's rock transformation rate and thermal maturity through time (Peters and Cassa, 1994). Sedimentation rates vary across a basin, for this reason building multiple 1D subsidence models inside the area of interest is needed, since this will help to identify sedimentation tendencies, zones with the highest organic matter transformation ratio and explain the reasons of these variations (Afife et al., 2016; Amobi et al., 2019; Gawad et al., 2021).
Additionally, to our geochemical evaluation, we built up a geomechanical model to define the potential for unconventional reservoirs in the Mungaroo Formation. Shale gas reservoirs were analyzed after integrating the modelling of the elastic/resistance mechanical properties, pore pressures, and vertical and horizontal stresses.
Geology Background
Tectonic Setting
The Exmouth Plateau sub-basin, located in the northwestern Australia, is part of the North Carnarvon basin which has evolved as a passive margin (Figure 1) (Chongzhi et al., 2013). Among the Exmouth Plateau sub-basin, the Exmouth, Barrow, Rankin Platform, Dampier and Beagle basins make the cratonic Carnarvon basin (Figure 1) (Coblentz et al., 1998; Reynolds et al., 2002; Stagg et al., 2004; Blewett et al.,, 2012). The North Carnarvon offshore basin is bounded by three abyssal plains: Gayscone, Argo, and Cuvier, whose basement is oceanic in composition (Figure 1) (Stagg and Colwell, 1994).
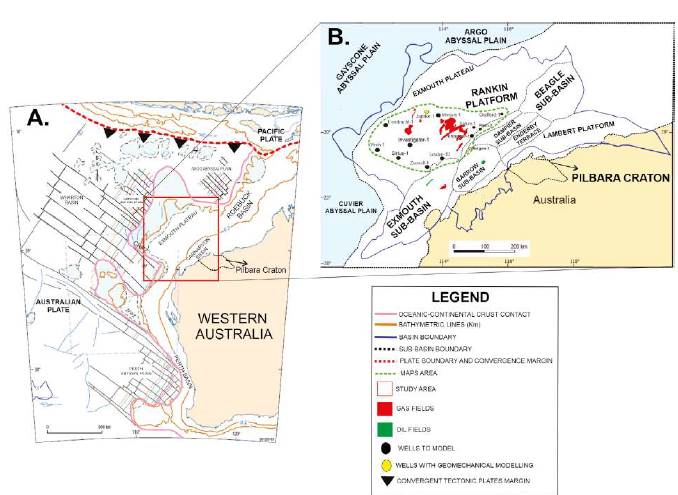
Figure 1 A. Geographical localization of Exmouth Plateau displaying the continental and oceanic boundary (red polygon); general fault trends (black lines); crustal and plate boundaries. B. Map of the Exmouth Plateau and adjacent basins. Notice the distribution of the available wells for the model. Adapted from Stagg et al. (2004) and Chongzhi et al. (2013).
The Carnarvon basin is bounded to the northwest and west by a NW-SE fault system related to a Jurassic-Lower Cretaceous (~155-136 Ma) seafloor spreading event (Exon and Willcox, 1980). Besides the passive configuration of the basin, the northern boundary involves a convergent margin between the Australian and Pacific plates with a relative velocity of 70 mm/ year (Blewett et al., 2012) (Figure 1).
Gravimetric studies on the area show that the basement from the plateau has a continental composition, perhaps as an extension from the Precambrian shield of the onshore area (Exon and Willcox, 1980). It has a thickness between 7 and 10 km (Figure 2) and it is composed by gneiss, granite, schist, and sediments (~3,600-2,700 Ma) (Exon and Willcox, 1980).
Basin Evolution
The paleoenvironmental conditions of the Exmouth Plateau during the Paleozoic were interpreted as a marginal bay of the northern coast of Gondwana that faced the Tethys Ocean (Exon and Willcox, 1980; Exon and Colwell, 1994). In the Early Carboniferous (~359-323 Ma), a transgression caused the deposition of marine sandstone, carbonate, siltstone, and shale (Veevers, 1971; Thomas and Smith, 1974). In Late Carboniferous (~323-299 Ma), sediment deposition decreased (Exon and Willcox, 1980). In the Permian (~299-252 Ma), a marine and paralic sandstone, siltstones and shales were deposited on the Exmouth Plateau and on the onshore part of the Carnarvon Basin (Figure 2) (Exon and Willcox, 1980).
The Post-Permian basin evolution is summarized in six phases: pre-rift, early rift, main rift, late rift, post rift, and passive margin (Stagg and Colwell, 1994; Geoscience Australia, 2014). Pre-rift phase started in the Late Permian and continued until Early Jurassic (~174 Ma). It was dominated by NE-SW trending depocenters, controlled by en echelon faults (Romine et al., 1997; Chongzhi et al., 2013) that limited horsts and grabens (Barber, 1988). The Locker Shale is a transgressive marine sequence composed by muddy facies (Bradshaw et al., 1998). It is capped by fluvio-deltaic facies of the Mungaroo Formation containing quartz sandstone, siltstone, shale, and coal deposited during the Early-Late Triassic with a SE-NW progradation direction (Figures 2 and 3). Hence the predominance of fluvial facies to the SE, and delta front facies to the NW of the Exmouth Plateau (Chongzhi et al., 2013). By the Late Triassic (~205 Ma), the Fitzroy movement caused the uplifting of the Rankin Platform at the northeast of the Exmouth Plateau creating a sediment barrier towards the northwestern offshore basins (Hocking, 1990). Finally, in the Late Triassic and Early Jurassic (~205-183 Ma) siltstones, claystone and platform marls of the Brigadier Formation and Murat Siltstone deposited towards the SE (Figure 2) (Geoscience Australia, 2014).
The early rift phase started in the Early Jurassic (~185 Ma) with the continuation and growth of NE-SW normal faults, horsts, and grabens (Barber, 1988). Deltaic sandstones of the Legendre Formation (mainly in the east) and marine restricted claystone and siltstone of the Athol Formation (Figure 2) were deposited during this period (Chongzhi et al., 2013; Geoscience Australia, 2014).
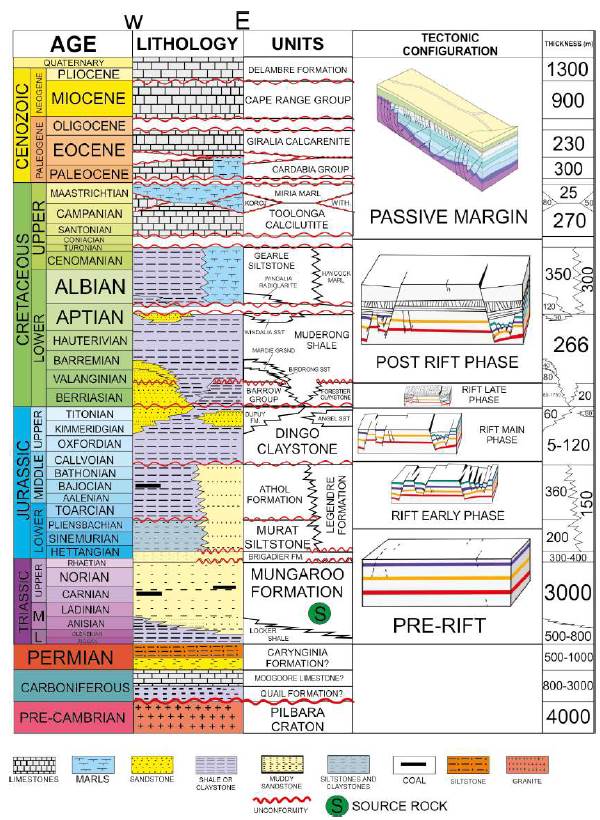
Figure 2 Generalized stratigraphic column of the North Carnarvon Basin. Adapted from He and Middleton (2002).
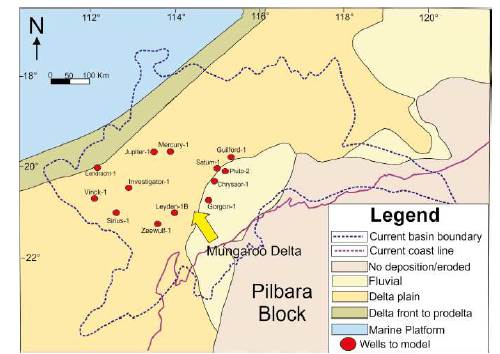
Figure 3 Paleogeographic map of Mungaroo Formation (-228 Ma) with the facies distribution and delta direction deposition. Adapted from Chongzhi et al. (2013).
The main rift phase due to the continental rupture along the north of the Exmouth Plateau (Jablonski, 1997) dates as Callovian and Oxfordian (~166-157 Ma). This rupture caused a change of relief that triggered a change in the depositional pattern (Chongzhi et al., 2013). Such extension formed the Callovian unconformity (Blevin et al., 1994; Geoscience Australia, 2014). The continuous faulting during the Late Jurassic induced the uplift and folding of the Exmouth Plateau and Rankin Platform (Figure 1B), which became important sediment sources for the adjacent basins and because of that, deposition in this period was minimum to null in our study area (Geoscience Australia, 2014). Continuous subsidence during Oxfordian (~163-157 Ma) caused a maximum flooding surface that correlates with the widespread deposition of the deep marine Dingo Claystone unit (~167-147 Ma), except to the NW most zone within the Exmouth Plateau (Figure 2) (Chongzhi et al., 2013). At this time, the Kangaroo synclinal formed after an extensional reactivation of Triassic faulted blocks in the Rankin Platform (Jenkins et al., 2003); this synclinal was an important depocenter, here the turbiditic and deltaic sandstones of the Dupuy Formation and Angel Sandstone deposited (Figure 2), containing a significant contribution of Mungaroo Formation sediments (Jenkins et al., 2003; Moss et al., 2003).
The late rift phase started in the Berriasian (~145 Ma) with the Indo-Australian plate break-up, which caused fault reactivations within the basin (Hearty et al., 2002). Existing evidence suggests another episode of uplift and erosion in the Berriasian (Geoscience Australia, 2014). Unlike Jurassic units (which deposition was really restricted), thinner Cretaceous units were widely deposited (Chongzhi et al., 2013): the Barrow Group, a deltaic sequence (Figure 2) (~148-137 Ma), composed by the Malouet Formation (the lower deltaic lobe, which is product of the delta progradation in S to N direction, from the Exmouth sub-basin to the Exmouth Plateau), the Flacourt Formation (upper deltaic lobe which is related with the delta retrogradation) (Chongzhi et al., 2013; Geoscience Australia, 2014), the Zeepard Formation, and Flag Sandstone (predominantly sandstones) are mainly found to the south of the basin (Geoscience Australia, 2014). To the east the Forestier Claystone was deposited (Chongzhi et al., 2013). By the Valanginian (~140 Ma) the sediment supply to the Barrow Delta ceased because of the continental rupture at the southwest of the Exmouth Plateau, and active seafloor spreading in the Gayscone and Cuvier plains (Hocking, 1990).
Continental break-up in the Valanginian (~140 Ma) caused an unconformity in the basin, which marks the beginning of the post-rift phase (Muller et al., 1998; Polomka et al., 1999; Jablonski and Saitta, 2004; Geoscience Australia, 2014). During the post-rift phase, the Muderong Shale was deposited to the NEE, in a subsiding sub-basin, while the paralic and platform Birdrong sandstones, the Mardie Greensand glauconitic sandstones, and the Windalia sandstone locally deposited in the S of the Exmouth Plateau (Figure 2) (Chongzhi et al., 2013). By the Aptian (~125 Ma) the Windalia Radiolarite (Figure 2) was deposited, evidencing low sediment availability within the basin. Later, in the Middle Albian (~107 Ma) the subsidence rate in the continental margin increased leading to the deposition of the shale and siltstone facies of the Gearle Siltstone (Figure 2) (Chongzhi et al., 2013). Finally, the detritic sediment supply ceased and with the dry weather conditions, lead to the deposition of the Haycock Marl (Figure 2), composed mainly by a marl succession and muddy carbonate rocks (Chongzhi et al., 2013).
In the Middle Santonian (~87 Ma) a stage of passive margin where carbonate lithologies (limestone, muddy limestones, marls, and caliche) deposited, as the Toolonga Calcilutite, Korojon Formation, Miria Marl, Cardabia Group, Giralia Calcarenite, Cape Range Group and Delambre Formations (Figure 2) (Barber, 1982; Hocking, 1988; Chongzhi et al., 2013). By the Miocene, because of the interaction between Indo-Australian and Euroasiatic plates, inversion and fault reactivation took place within the North Carnarvon Basin (Malcolm et al., 1991; Cathro and Karner, 2006). In the Pliocene and Pleistocene, the limestones and marls of the Delambre Formation were deposited (Apthorpe, 1988).
Data and Methodology
This research uses geochemical and well log data available by the Mine, Industry and Security Regulation Department of the Western Australia Government (https://geoview.dmp.wa.gov.au/geoview/?Viewer=GeoView). The data was used for this research in the following steps:
Geochemical Characterization
Our model includes available data from the wells Jupiter-1, Investigator-1, Pluto-2, Gorgon-1, Vinck-1, Chrysaor-1 Leyden-1B, Zeewulf-1, Mercury-1, Saturn-1, Guilford-1, Sirius-1, and Eendracht-1 which contain geochemical information (TOC, HI, OI, Tmax, Vitrinite reflectance, and Pyrolysis Data). These data were used to characterize the source interval (TOC vs Depth), the nature of the organic matter (Van Krevelen diagrams), the generation potential (S1, S2 and S3), the type of hydrocarbon generated, and the thermal maturity (Ro%). The spatial distribution of key geochemical properties was plotted using the method of spline interpolation of ArcMap 10.5 software which helped us to understand the depositional environment and areal distribution of the source rock.
Geochemical Modelling
To understand the geological and tectonostratigraphic evolution, deposition history and to identify the principal uplifting events, we used well completion reports, stratigraphic tops, lithological descriptions, bibliographic information (Bradshaw et al., 1988; Blevin et al., 1994; Muller et al., 1998; Polomka et al., 1999; Kaiko and Tait, 2001; Chongzhi et al., 2013; Geoscience Australia, 2014; Rohead-O'Brien and Elders, 2018; Dempsey et al., 2019; Bilal and McClay, 2022). Because few wells reached deeper than the top of the Mungaroo Formation, the thickness of the underlying units were taken from Goncharov et al. (2006). Also, none of the wells reached the base of the Mungaroo Formation; so, the thickness of the unit was completed based on the information available in the Jupiter-1 well, and the facies distribution of the Mungaroo Formation proposed in Chongzhi et al. (2013) (Figure 3). Original TOC values were obtained according to the methodology proposed in Jarvie et al. (2007), while original HI values were obtained using the methodology from Banerjee et al. (1998). Paleothermal flows were calibrated with vitrinite reflectance data and current thermal flow was calibrated using the Horner corrected bottom hole temperature (BHT) data (Figure 4) which were obtained from the drilling reports of each well. Finally, modelling was done in Petromod 2012 software of Schlumberger where the transformation rates and thermal maturity of the Mungaroo Formation were simulated. Areal distribution of these parameters and thermal flow were used to delimitate possible kitchens and possible migration pathways.
Geomechanical Modelling
Available log data such as neutron-porosity, density, gamma ray, P and S sonic, caliper, and resistivity logs were collected from Jupiter-1, Investigator-1, Pluto-2, Gorgon-1, Vinck-1, Chrysaor-1, Mercury-1, Saturn-1, Guilford-1, Sirius-1, and Eendracht-1 (Figure 1B). Operational parameters and laboratory tests were used for the calibration of the models (mud weight, repeat formation tests (RPT), integrity tests, leak-off tests, VSP), as well as drilling histories were used to identify if any problem existed during the perforation of the wells that may have any impact on the geomechanical modelling.
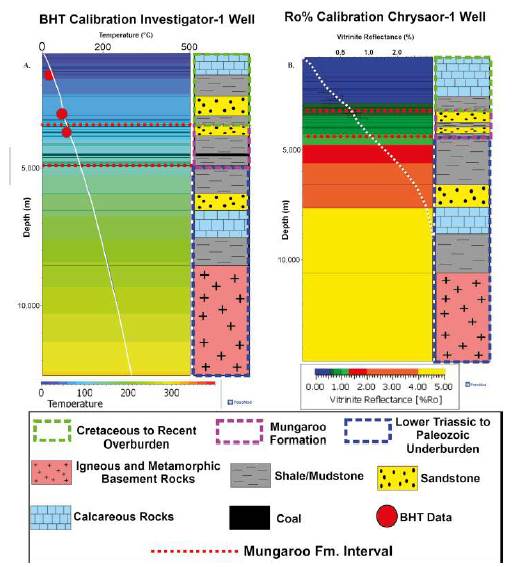
Figure 4 A. BHT calibration for the Investigator-1 well. B. Ro% calibration for the Chrysaor-1 well.
The general workflow used for the geomechanical modelling is explained as follows:
At first, the Vshale curve was calculated according with the following relation:
Where GRlog is the gamma ray log, GRmin is the minimum value or sand line and GRmax is the shale line. This Vshale was calibrated with X Ray Diffraction (XRD) data (Figure 5). Then, the lithotypes of the Mungaroo Formation were obtained using a neural network method among five well logs: photoelectric factor (PEF), density (RHOB), porosity (NPHI), P wave sonic (DTp) and Vshale (Vsh), when available. If some wells do not have PEF logs, the other four well logs were used for the neural network. The pore pressure analysis used a vertical stress (Sv) or overburden calculated with the formula proposed in Jaeger et al. (2007). The hydrostatic pressure was calculated using a relationship between the repeat formation test (RPT) and depth. Afterwards, the normal velocity was estimated based on the interval velocity (Equation 2), which is derived from the DTp:
Where C and b are coefficients that were taken from the model and o is the normal stress.
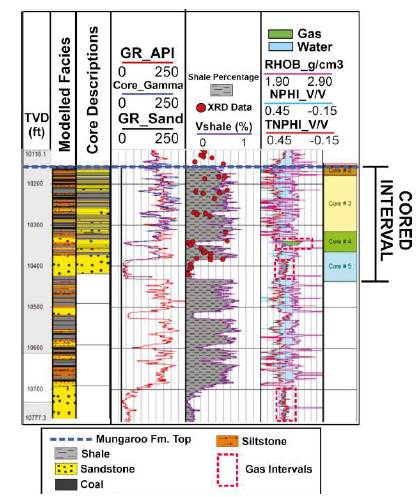
Figure 5 Pluto-2 model showing the calibration between the XRD data and the modelled Vshale and the relationship between the modelled lithotypes and core descriptions.
Finally, pore pressure (Pp) was calculated according to Eaton (1975) for the impermeable lithologies (shales and siltstones) and for the permeable lithologies (sandstones and muddy sandstones). Elastic properties were calculated based on the RHOB log and the S (Vs) and P (Vp) velocity waves. If the wells do not have a Vs log, a calculation of this curve was peformed with the relationship proposed in Illidge (2017). Then Young Modulus (Equation 3) and Poisson Ratio (Equation 4) were obtained:
Where p is the density, Vp is P wave velocity and Vs is S wave velocity.
The resistance mechanical properties modelling started with the calculation of the uniaxial compressive strength (UCS) using the formulas proposed by McNally (1987) for sandy lithologies, and Horsrud (2001) for muddy lithologies. Later the angle of internal friction AFI was calculated using the relations proposed by Lal (1999) for muddy lithologies, and Weingarten and Perkins (1995) for sandy lithologies. Then the calculation of the cohesion (Equation 5), tensile strength (Equation 6) and fracture gradient (Equation 7) were made:
Where to is the tensile strength, Fg is the fracture gradient and Shmin is the minimum horizontal stress.
Additionally, the minimum (Equation 8) and maximum (Equation 9) horizontal stress were model to establish the current stress regime:
Where σ is the Poisson Ratio and Shmax is the maximum horizontal stress.
Finally, a fracture distribution was calculated from the relation between the Young Modulus (rock fragility) and the differential horizontal stress ratio (DHSR) (Equation 10, Gray et al., 2012); this was calculated in order to determine the intervals which contain the best properties for hydraulic fracturing. For lower DHSR values, fracture networks will grow by joining fractures easier, while for higher DHSR values, fractures will not intersect and will be parallel to the SHmax.
To stablish this relation Young Modulus must be static, for this reason the calculated dynamic was converted to static throughout the formula proposed by Eissa and Kazi (1988). From the Young Modulus vs DHSR graph it was determined that the ductile zone has DHSR values higher than 0.2, and the zone where the fractures will join has DHSR values lower than 0.2.
Results
Source Rock Characterization
Source rock on Exmouth Plateau sub-basin is the Triassic Mungaroo Formation that was deposited in a fluvial-deltaic environment and has a type III to II kerogen. For this reason, the expected generated hydrocarbon is mainly gas (He and Middleton, 2002; Chongzhi et al., 2013). Geochemical and basin analysis have shown that the shale intervals of this unit are the main source of the Scarborough and Jansz/Io gas fields (Chongzhi et al., 2013).
Mungaroo Formation shale intervals have TOC (%wt) values ranging from 0.5% to 10% (Figure 6A and 7A) which qualify them as fair to excellent source rocks according to its organic content (Peters, 1986). In the same way, Mungaroo Formation has TOC values higher than 15% (Figure 6A and 7A) which could be related with coaly levels reported in Chongzhi et al. (2013). Its generation potential according to the S2 values is average to good, varying from 0.25 to 10 mg HC/g rock (Figure 6B and 7A). TOC and S2 vs depth comparison (Figure 6A and 6B) shows that higher TOC values are related with higher S2 values confirming the good generation potential that this unit has, especially between 3,000 and 4,000 m, where shale, coal and/or coaly shale have thicknesses between 5 and 15 m.
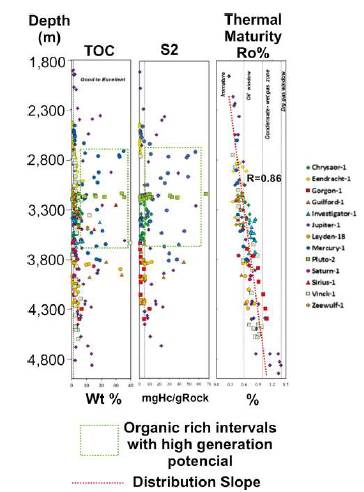
Figure 6 A. TOC vs depth plot where the best values between 2,800 and 3,800 m are highlighted. B. S2 vs depth plot with the best generation potential values between 2,800 and 3,800 m. C. Ro% vs depth plot with the dry gas generation window starting below 4,800 m approx.
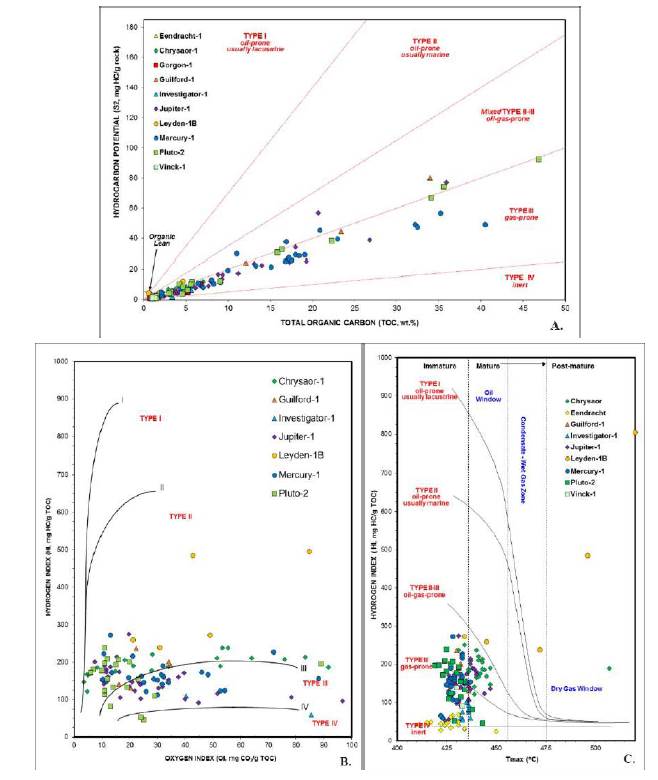
Figure 7 A. TOC vs S2 plot showing that Mungaroo rocks are mainly gas prone and have a good generation potential. B. Modified Van Krevelen diagram showing a type III to II/III kerogen for the Mungaroo source rock. C. Thermal Maturity plot where it is concluded that the sampled Mungaroo Formation is mainly immature to mature (oil window zone).
Hydrogen Index (HI) vs Oxygen Index (OI) diagram shows a type III to II/III kerogen for the Mungaroo Formation (Figure 7B), with HI values from 50 to 275 mg HC/g TOC (Jones, 1984; Tissot and Welte, 1984). Tmax values vary from 425 to 445°C (Figure 7C) showing that the unit is immature to mature for the liquid hydrocarbon generation (Peters and Cassa, 1994). Vitrinite Reflectance values (Ro%) show that the onset of oil generation (Ro% 0.6-1) starts at 3,000 m, wet gas window (Ro% 1-1.4) starts at 4,300 m approximately and dry gas window (Ro%>1.3) deeper than 4,800 m (Figure 6C). A comparison of Tmax with Ro% values indicates a relationship that shows that most of the available values are in the oil window, except for the deeper values of the Jupiter-1 well, which reach the wet gas window (He and Middleton, 2002) (Figure 6C and 7C). Tmax is not available for these intervals. Lastly, S2 vs TOC diagram indicates that the generated hydrocarbon is mainly gas (Figure 7A), a fact that correlated with the kerogen type (Jones, 1984) and the environmental deposition of the Mungaroo Formation interpreted by Chongzhi et al. (2013).
Fluvial-deltaic facies distribution of the unit (Figure 3) condition the geochemical properties distribution (Peters and Cassa, 1994). Higher TOC values are located to the S-NE of the basin (Figure 8B) and are related with zones where the unit is in a transitional environment (Figure 3), while lower values (0-1.2%wt) are found to the NW where the fluvial and more continental conditions predominate. HI shows values characteristic of kerogen type III and II/III throughout the basin (Figure 8C), varying between 250 mg HC/g TOC to the SE-S, and 40 mg HC/g TOC to the NW. Finally, measured Ro% values on the top of the Mungaroo Formation indicate higher values are observed to the SE-E with values ranging between Ro% 0.6 to 0.69 (Figure 8D). The rest of the basin presents values varying between Ro% 0.27-0.51 (Figure 8D).
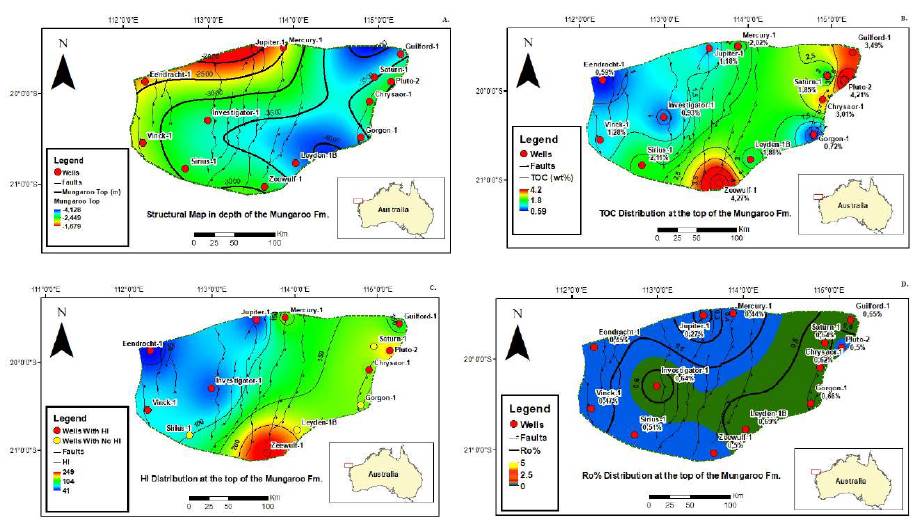
Figure 8 A. Structural map of the top of the Mungaroo Formation. B. TOC% distribution showing best values to the S and NE. C. HI distribution with the highest values to the SE-S. D. Average Ro% distribution showing higher values to the SE-E.
In conclusion, the Mungaroo Formation has a good organic content and generation potential, with TOC% values from fair to excellent (0.5-10%), and S2 values from fair to good (0.25-10 mg HC/g rock), especially between 3,000 and 4,000 m (Figure 6A and 6B). The kerogen type of the unit is III to II/III according with the HI values (50 to 275 mg HC/g TOC) and the generated hydrocarbon is mainly gas (Figure 7A). Thermal maturity shows that the unit is immature to mature in the oil window, on its shallower part, according with the Tmax values, while Ro% values display that the oil window starts at 3,000 m and wet gas starts deeper than 4,700 m. Best TOC% values are found to the S-NE of the basin while the zones with the best maturity are to the SE-E (Figure 8B).
1D Burial Histories and Transformation Ratios
The reconstruction of the burial histories displays three depositional trends throughout the basin (Figure 9): 1) Trend "A" is characterized by high sedimentation rates during the pre-rift phase (~242195 Ma) varying from 69.3 and 95.3 m/Ma; this stage is characteristic of the wells located northward and to the SW of the sub-basin such as Mercury-1, Jupiter-1, Eendracht-1 and Vinck-1 wells (Figure 8). 2) Trend "B" displays high sedimentation rates in the Late Jurassic and Early Cretaceous (~147-137 Ma) (related with the final phase of the syn-rift) varying between 67 to 158 m/Ma; this trend is found to the SW and S on the Gorgon-1, Leyden-1B, Sirius-1, Investigator-1 and Zeewulf-1 wells (Figure 9). 3) Trend "C" presents low sedimentation rates during its entire depositional history, varying from 18 to 40 m/ Ma during the evolution of the rift phase of the sub-basin; this trend is distributed between the E and NE of the area and is found on Pluto-2, Guilford-1, Saturn-1 and Chrysaor-1 wells (Figure 8). Generally, during the post-rift (~137-96 Ma) and passive margin phase (~89-0 Ma), sedimentation rates are low throughout the sub-basin varying between 1 to 22 m/Ma, and 8 to 16 m/ Ma respectively.
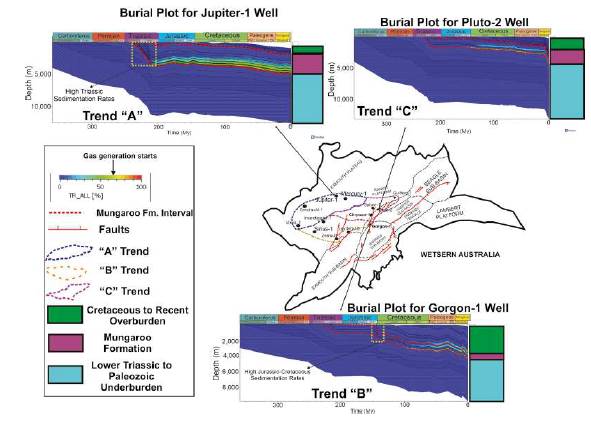
Figure 9 Burial history distribution trends in the Exmouth Plateau. It is highlighted the Transformation Ratios where the gas generation starts.
The hydrocarbon generation and expulsion timing are estimated from the transformation ratios (TR), which were obtained from the kinetic model proposed by Burnham (1989) for kerogen type III samples. The proposed ranges in Law (1999), indicate that for type II kerogen samples, the oil generation stars with a TR of 25-50%, oil expulsion with a 50-88% TR, and gas generation/expulsion >88% while for type III kerogens the oil generation starts with a TR of 12-31%, expulsion between 31-64% and gas generation/expulsion >64%. In this study, areas where trend "A" is mainly present, the TR is higher than 55% and deeper than 3,300 m for the wells located in this region (Figure 9). Areas where trend "B" is mainly present, reach or come close to the gas generation/expulsion zone between 4,400 m and 4,850 m, since the 109 Ma (Figure 9). Finally, areas where trend "C" is mainly present wells reach TR higher than 64% at depths between 4,300 and 4,800 m since 109-107 Ma (Figure 9).
Thermal History
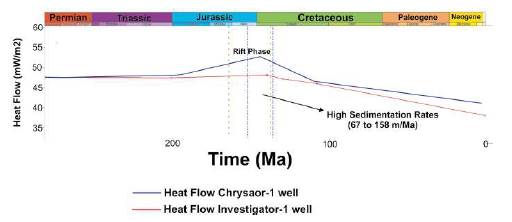
Thermal History is related with the thermal flow that the basin has had during its evolution. Current thermal flows were calibrated with Horner corrected bore hole temperatures (BHT), while the paleo-thermal flow was calibrated with Ro% data (Figure 4). In general, the thermal flow in the study area is little affected by the rift phase because the increase on thermal flow during the syn-rift phase is not as pronounced as proposed in McKenzie (1978). Conversely, heat flow differences between the pre and syn-rift phase do not exceed 5 mW/m2 (Figure 10). Local variations of this trend are observed in the wells located to the ENE (Pluto-2, Chrysaor-1, Guilford-1 and Saturn-1) which have a behavior more consistent with the model proposed by McKenzie (1978), with values close to 53 mW/ m2 (Figure 10) in the syn-rift phase and a progressive decrease during the post-rift until reaching current thermal flows between 24 and 43 mW/m2. High sedimentation rates in trends "A" and "B" might be causing a blanketing effect (Wangen, 1994; Theissen and Rupke, 2010) in this part of the basin, leading to low heat flows during the syn-rift phase, for this reason low sedimentation rates during its depositional history on Pluto-2, Chrysaor-1 and Saturn-1 wells could trigger to heat flow model more related with the one proposed by McKenzie (1978). High thermal flows reached during the syn-rift could be very important in the generation history of the Mungaroo Formation in these sectors, while in the rest of the wells the thermal flows might not be the trigger factor in the organic matter evolution.
Ro% Modelling and Distribution
Thermal evolution was addressed using the methodology of Sweeney and Burnham (1990), that considers gas generation window starts at Ro% 1.3. As the base of the Mungaroo Formation was not reached in the available wells, it was completed using Goncharov et al. (2006) that filled the missing thickness of the Mungaroo Formation and Locker Shale which are considered potential source rock intervals (Geoscience Australia, 2014).
Transformation Ratios (TR%) are compared with a vitrinite reflectance modelling (Ro%) at depth using the kinetics of Sweeney and Burnham (1990) (Figure 11). This modelling shows that for the wells that have the "A" trend subsidence history, like Jupiter-1, the Mungaroo Formation reaches the gas window close to the 4,800 m deep at 120 Ma (Figure 11). For wells within the "B" trend, like the Gorgon-1, the Mungaroo Formation does not reach the dry gas window, however, the Lower Trassic Locker Shale unit does reach the gas window between 4,500 and 5,000 m deep between 80 and 130 Ma (Figure 11), and this formation have reported to be a potential source rock too (Feng et al., 2020). Finally, in the zone of the "C" trend, the Mungaroo Formation reaches the gas window between 4,300 and 4,800 m deep, between 117 and 129 Ma (Figure 11).
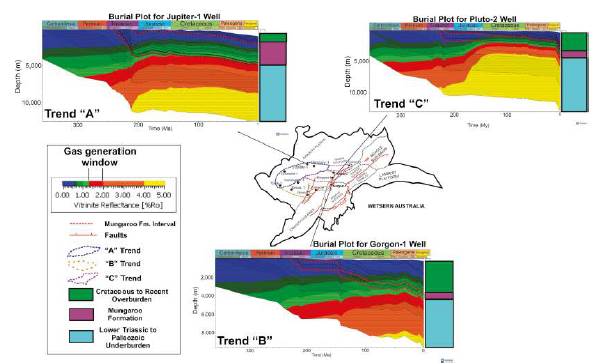
Figure 11 Thermal Evolution using the kinetics of Sweeney and Burnham (1990), and its relationship with the defined burial history tendencies.
Thermal Flow Distribution and Transformation Ratios
Gas generation in the Exmouth Plateau sub-basin starts during the Triassic-Jurassic for the "A" trend and during the Cretaceous for "B" and "C" trends (Figure 9). Locally, gas generation occurs in the Triassic (208 Ma) and Late Cretaceous (98 Ma) (Figure 9). It can be observed that for the Cretaceous, higher TR (2-5%) are located to the SE-NE of the area, while a TR below 1% predominates in the rest of the area at the top of the Mungaroo Formation (Figure 12C). By the Present, a generalized increase of the TR% occurs, specially to the NW of the sub-basin (Figure 12D) where it reaches to 4%.
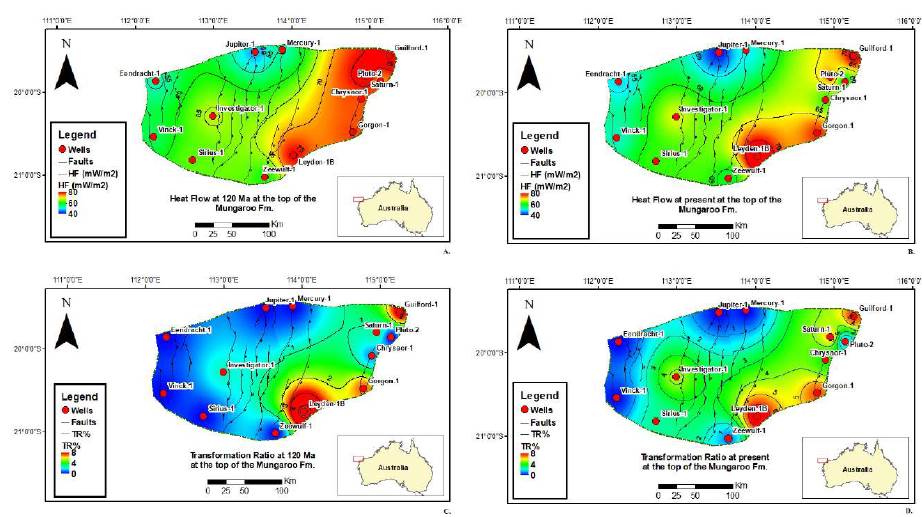
Figure 12 A. Areal distribution of heat flow at 120 Ma. B. Heat Flow at Present. Tendencies are very similar except for the NE-E and SE, where heat flow decreases C. TR% at 120 Ma with the higher values located close to Leyden-1B and Guilford-1 wells. The rest of the sub basin has lower values than 2%. D. TR% at Present showing a significantly rise to the NW.
During the Cretaceous and Present, modelled heat flow shows a decrease on heat flow, which is typical on a rift environment, on the C burial history trend zone, however, the rest of the sub-basin keeps a similar heat flow because of a possible blanketing effect (Figure 12A, 12B). Higher heat flows to the NE-E possible determined the generation in this zone. So, in the zones with the "A" and "B" burial history trends the generation could be more related with its deposition tendencies.
1D GeomechanicalModelling
For the Mungaroo Formation five lithotypes were obtained after the neural network modelling: sandstones, shaly sandstones, siltstones, shales and coals. These lithotypes were calibrated with available core descriptions from the completion's reports. The wells located to the SW (Saturn-1, Pluto-2, Chrysaor-1 and Gorgon-1) have a predominance of sandy lithologies, while the rest of the wells show a predominance of muddy lithologies (Figure 13).
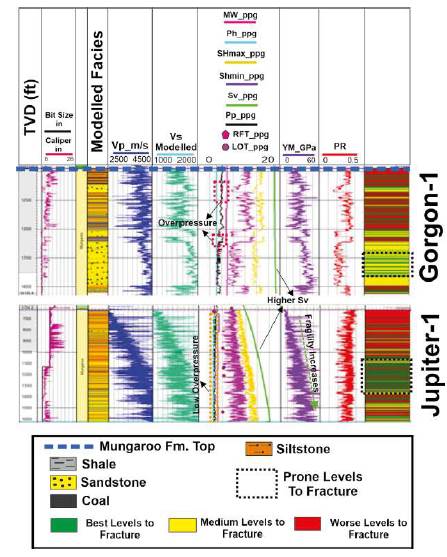
Figure 13 Lithological model, pore pressure, stress analysis, elastic properties, and fracking feasibility of Jupiter-1 and Gorgon-1 wells. YM= Young Modulus, PR= Poisson Ratio, Pp= Pore Pressure, Sv= Vertical Stress.
Generally, more impermeable units have higher pore pressure values (between 8.5 and 9.2 ppg) and differences of 0.7 ppg with respect to hydrostatic pressure, which means low overpressure (Figure 13). However, the Gorgon-1 well has a 1,000 feet interval that displays a difference between 1 and 1.2 ppg with respect to hydrostatic pressure (Figure 13).
As proposed by Warpinski et al. (1985), horizontal stresses are lower in sandy units while higher in muddy lithologies (Figure 13). As it can be observed in the Figure 13 the vertical stress (Sv) is the highest, followed by the maximum horizontal stress (SHmax) and the minimum horizontal stress (Shmin ), confirming that the basin is currently controlled by an extensive stress regime (Anderson, 1905).
From the DSHR modelling can be observed that, in general, shales of the Mungaroo Formation are not prone to be fractured, however, some sandstones levels inside this formation could be fractured (Figure 13).
Discussion
Subsidence models indicate that Mungaroo Formation reaches the gas generation window as a result of: 1) higher sedimentation rates during the Triassic (~210-242 Ma) evidenced in the "A" burial history trend (Figure 9), possibly due to a depocenter located in the northwestern part of the basin; 2) high sedimentation rates during the Lower Cretaceous (~148-127 Ma) as shown in the "B" burial history trend (Figure 9) that results from the Barrow Group deposition distribution (Chongzhi et al., 2013), and 3) high thermal flow during the syn-rift phase (~139 Ma), as evidenced in the "C" burial history trend (Figure 9). Little heat flow increments during syn-rift phase for the "A" and "B" trends could be related with a blanketing effect and/or the low conductivity of laying units over the basement (Wangen, 1994; Theissen and Rupke, 2010; Souche et al., 2017); since sedimentation rates are low on "C" this zone does not have a blanketing effect, resulting in higher heat flows in the syn-rift phase, which is proposed on He and Middleton (2002) and Schenk et al. (2020), nevertheless, since they do not consider Permian and Carboniferous units (deposited above the basement), and do not consider a thicker Mungaroo Formation (as in this paper), which implies higher depositional rates during the Triassic, heat flow in trends "A" and "B" do not adjust to their models.
We proposed the existence of three kitchens in the sub-basin that were based on previous observations and maps of modelled TR% and Ro% included in this study for the Mungaroo Formation (Figure 14C), nevertheless, a fourth kitchen may exist deeper in the Locker Shale unit. The kitchen located at the NWN, starts to generate/expel (TR> 64%) since the beginning of the Lower Cretaceous (~144 Ma) while the other kitchens start their generation/expulsion since 130105 Ma approximately. Lower HI values (Figure 8C) could be explained since the Mungaroo Formation has a fluvio-deltaic origin. Migration pathways from these kitchens were defined based on the structural map of the Mungaroo Formation, in two mainly directions: SE-NWN and SE-NW for the kitchen located to the SE (Figure 14A, 14B). Vertical migration could have contributed to the gas fields too. It can be inferred that the gas generation window occurs from 4,500-4,800 m to approximately 5,500 m deep (Figure 14D).
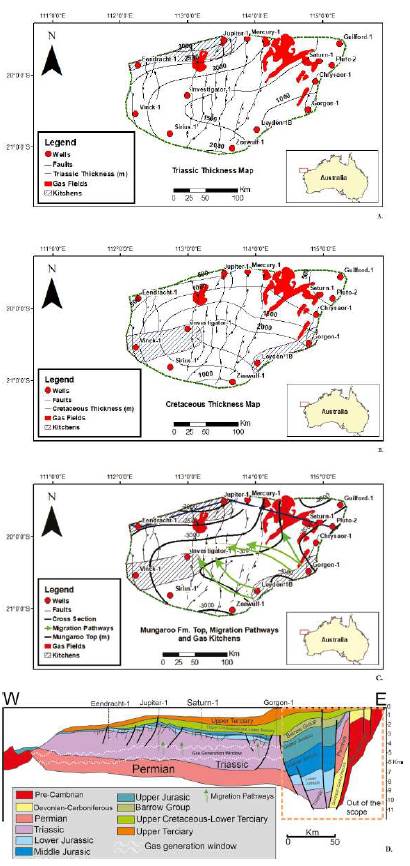
Figure 14 A. Triassic thickness map showing the kitchen location that developed due to deposition during this epoch. B. Cretaceous thickness map showing the kitchens that developed during this epoch. C. Top Mungaroo Formation map with the three proposed kitchens and their migration paths. D. Schematic cross section with possible location of gas generation window at depth. Adapted from Stagg et al. (2004).
The geomechanical model built on the perforated part of the Mungaroo Formation confirms that the shallower levels of the Mungaroo Formation do not generate or expel significant gas contents because there is no evidence of high overpressures, and the shales are mainly ductile (Figure 13). For this reason, they will not be easily fractured to allow a possible hydrocarbon expulsion, nevertheless, because gas generation is happening since 140 Ma ago approximately and the Exmouth Plateau is considered a stable sub-basin, migration could happen through its pores leaving a considerable gas content, whether the shales are ductile or not. Low pressure shales could result from the longtime of generation/expulsion (Figure 13), which could mean that the amount of gas available within them is not significant.
On the other hand, the Mungaroo shale have favorable characteristics to be consider a good source rock because they have TOC% values higher than 1%, they are mature and have high S1 values. However, knowing that the Mungaroo shale has thicknesses less than 45 m with high clay contents (Vsh >50%) and lithological heterogeneity, hinders their possibilities of configuring an unconventional reservoir. Also, the low overpressure of the shales and their ductility, opposite features to what is expected for an unconventional reservoir (Higgins-Borchardt et al., 2016). Likewise, it is expected that deeper levels could be more fragile and have a higher potential for unconventional reservoirs since ductility is dependent of Young Modulus and it is dependent of density. i.e., Jupiter-1 well (Figure 13). However, if these levels are more fragile, from an economically point of view, the exploitation of a deep offshore unconventional reservoir could not be very convenient. In fact, there is no current record of a field with these characteristics.
Conclusions
Mungaroo Formation shales have a kerogen type III and II/III which means that they are mainly gas prone. Its generation potential (S2) and organic richness (TOC%) is good, especially between 3,000 and 4,000 m. Three subsidence trends are recognized along the Exmouth Plateau sub-basin: 1) a trend "A" with high sedimentation rates during the Triassic, 2) a trend "B" with high sedimentation rates during the Lower Cretaceous, and 3) a trend "C" with low sedimentation rates during its entire depositional history. The gas generation/expulsion in the sub-basin is closely related with the high sedimentation rates in the "A" and "B" trends, but in the "C" trend is more related with the thermal flow that shows a rift-like behavior. Heat flow during the syn-rift does not increase too much due to low thermal conductivity of the units over the basement and high sedimentation rates during the syn-rift phase (blanketing effect) on the "A" and "B" trends; nevertheless, low sedimentation rates on the "C" trend led to a higher increase of heat flow during the syn-rift.
Three kitchens are recognized where generation and expulsion of the Mungaroo shales occurs for over 100 Ma ago, so this could be the reason of the giant gas fields in the sub-basin. The location of the kitchens is the possible explanation of the decrease of HI values recognized in the area and the gas window of these kitchens is between 4,500-4,800 m to 5,500 m deep.
Neural Network lithological analysis indicates that the Mungaroo Formation has five lithotypes: sandstones, muddy sandstones, siltstones, shales and coal. 1D geomechanical modelling, shows that the formation is in an extensive tectonic regime, and that the shales of this unit are mainly ductile and under pressured.

