


 Inglés (pdf)
 Articulo en XML
 Referencias del artículo
 Enviar articulo por email
 Citado por SciELO
  Citado por Google
  Similares en
SciELO
Similares en
SciELO  Similares en Google
 Permalink
Introduction
One of the most outstanding approaches for studying groundwater flow was proposed by Tóth (1963). Based on the review and solution of analytical equations in small basins, Tóth proposed the existence of three types of flow that were predominant in hydrogeological media, local, intermediate, and regional. This finding was probably one of the most important contributions to our existing knowledge of groundwater flow systems (Bresciani et al, 2016). In this context, topography, geology, and weather are crucial in the formation of these flow systems and may be characterised by conducting field works in which the recharge and discharge areas are identified along with changes in water levels, associated vegetation, and superficial drainage networks (Anderson et al., 2015).
Several authors have conducted research in an attempt to understand flow systems. Wang et al. (2017) implemented a new method for three-dimensional (3D) models to investigate nested groundwater flow systems. Jiang et al. (2018) observed that in the lowest reaches of a complex basin, the superposition of local flow systems on regional flow systems had been identified based on groundwater samples collected from wells with different depths and geophysical measurements of apparent resistivity. In a local groundwater flow system, water takes months or years to travel from the recharge to its discharge zone, and therefore has a short travel distance; in contrast to local flows, the intermediate and regional systems flows might travel for longer and deeper distances, and their recharge processes usually take place in a zone located far away from the discharge zone (Carrillo-Rivera and Cardona, 2012).
Numerical groundwater flow modelling is essential for analysing or complementing a hydrogeological conceptual model. Likewise, the significant advancements in numerical modelling make it possible to simulate different hydrogeological scenarios such as pollutant transport, prediction of the impact of water resource management plans, permanent pumping conditions, recharge, and discharge (Yang et al., 2011; Gebere et al., 2021), and is crucial for the management of continental scale aquifers (Gonçalves et al., 2020). The discharge areas must be adequately represented in the numerical models to represent local and regional processes.
The use of numerical modelling may be limited by the scale or the detail with which one intends to approach the issue, as computational limitations make it difficult to process and visualise the results (e.g. storage volume and processing time). In this regard, multi-scale modelling (Joyce et al., 2014) becomes a valuable tool for understanding groundwater flow systems both in intermediate / regional flows, and in local flow (Anderson et al., 2015). Work scales must be defined to identify groundwater flow systems; for instance, a model at the regional scale shows general flow trends and a glimpse of the mass balance in the area. However, if the goal is to represent a local phenomenon or characterise various flow systems, building more detailed models of the system's geometry which requires more field data (intermediate and local models) (Carrera-Hernández et al., 2016).
Freeze and Witherspoon (1968) built the first 3D numerical flow model for steady groundwater at the regional scale using the previous approach. They applied the model while considering local flow systems superimposed on their regional counterparts. Gebreyohannes et al. (2017) implemented a regional model of5260 km2 using MODFLOW® to understand and quantify groundwater flow systems and water availability for sustainable irrigation in northern Ethiopia. These authors conclude that the conductivity values for some layers were lower than those reported in previous studies, probably because they were considered homogeneous and most likely had less permeable intercalations. Wang et al. (2018) proposed a mesh refinement along streams and ridges for modelling groundwater in mountainous watersheds, finding that meshes that ignored low-order streams and ridges could reduce flow through shallow and short local-scale flow paths and increase flow through deep and long regional-scale flow paths.
It is worth noting that complex aquifer systems typically exhibit random behaviours in the permeable and impermeable layers; this makes their conceptual understanding difficult, making numerical modelling a labour-intensive task. A multilayer aquifer system can be identified by its complexity since it comprises several layers, each being heterogeneous due to phenomena such as ripples or dunes (Meesters et al, 2004). They are also identified as a sequence of aquifers delimited by aquitards and generally occur in sedimentary environments (Meesters et al., 2004). The various hydrostratigraphic complexes making up the layered aquifer system can be separated based on hydraulic conductivity, lithology criteria, and piezometric levels (Di Salvo et al, 2012).
Modelling at different scales arises from the need to build models in an integrated manner. Joyce et al. (2014) proposed a novel point of view for modelling groundwater flow, combining different scales and levels of detail, which has made it possible to integrate local flow phenomena within the regional systems that contain them. This point of view used three models at different scales, each with a level of detail consistent with each other in terms of hydraulic properties, water density distribution, and flow across boundaries. Using the same approach, Zhang and Benson (2008) produced a Lagrangian model of a pollution plume at the regional scale while considering the heterogeneity observed locally.
The characterisation of groundwater flow systems in a multilayer aquifer is still a challenge in hydrogeology. Additionally, few works have included the numerical analysis of layered aquifers by multi-scale modelling (e.g., Joyce et al., 2014; Wang et al, 2017). This paper presents a numerical multi-scale model (i.e., at the regional, intermediate, and local scales) to visualise flow systems in a multilayer aquifer system to explain the connection between recharge areas and groundwater flow direction. Modelling protocols were followed and managed to calibrate the model for the three scales using MODFLOW, both in steady and transit flow states, where the regional model provided the boundary conditions for the intermediate model, which in turn provided the same conditions for the local model.
Study Area
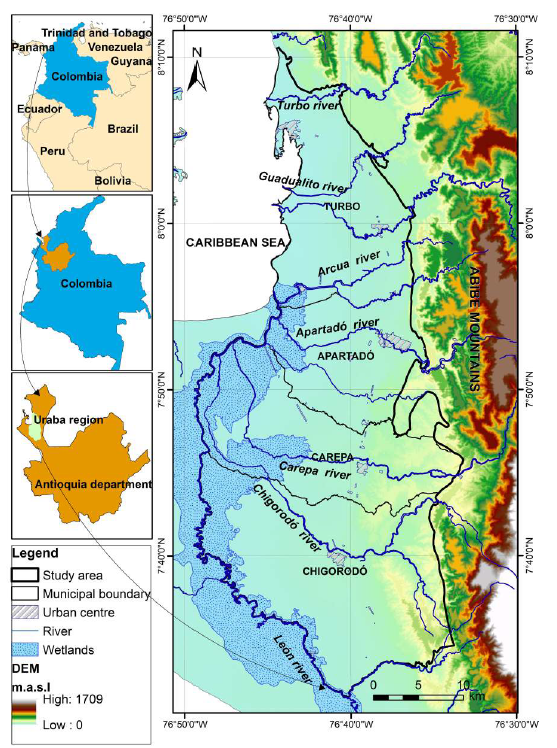
The study area is part of the Urabá region, located in northwest Colombia (Figure 1), extending over approximately 1206 km2. The area considered is bordered in the east by the Abibe mountain range, in the north by the Caribbean coast, in the west by the Gulf of Urabá, and in the southwest by the León river. The coordinates for this region are 8°10'35"N, -77°10'34"O and -77°26'47"E, 7031'27"S. The relief is flat with a slight slope towards the northwest, and its height ranges from 0 to 100 m a.s.l. The major drainages across the area belong to the León river basin and the Guadualito and Turbo rivers. These rivers flow directly into the Caribbean Sea. The study area is characterised by a high number of forested freshwater wetlands, which have decreased due to agricultural and livestock-related activities by humans colonising these territories (i.e., plantain, banana, cocoa, corn, and pasture production). The climatic features of the Urabá region are conditioned by its location-the Intertropical Convergence Zone (ITCZ)-both through its proximity to the Caribbean Sea and the Pacific air current known as Chorro del Chocó (CHOCO low-level jet). The mean annual precipitation is distributed north-south and ranges from 2100 to 3800 mm/y with an average temperature of 280C and relative humidity of 85.9%. These features are consistent with those of a tropical rainforest. The population estimated by the Colombian National Administrative Department of Statistics (DANE) that in 2018 approximately 482,609 inhabitants, 69.8% of which lived in the urban centre, while the remaining 30.2% had settled in rural areas.
Conceptual hydrogeological model In the region of Urabá, sedimentary rocks from the Neogene are found over a base of older rocks; these Neogene units are the Pavo (Ngp), Arenas Monas (Ngam), and Corpa Formations (Ngc). Alluvial, fluvio-lacustrine, luvio-marine, and marine deposits from the Quaternary (Qf and Qal) cover the surface. Regarding structural geology, the presence of fault fronts related to significant morphological changes around the Abibe mountains and the sections of hillocks and plains must be underlined (INGEOMINAS, 1995).
According to Universidad de Antioquia and CORPOURABA (2014), the hydrogeological system of the study area is a layered aquifer where random intercalation of permeable, semipermeable, and impermeable materials is observed (see Figure 2). The conceptual model was built using lithological and hydrostratigraphic data from 258 drilling records. Hydraulic conductivity and transmissivity data obtained from 158 pumping tests were also used. On the south side of the Chigorodó river, hydraulic conductivity ranges from 0.2 to 28 m/day. In the central zone between the Chigorodó and Apartadó rivers, hydraulic conductivity ranges from 0.1 to 18 m/day, and on the northern side, it ranges from 0.2 to 13 m/day. The aquifer system has thickness values ranging from 0 m around the eastern side and 300 m near the northwestern side.
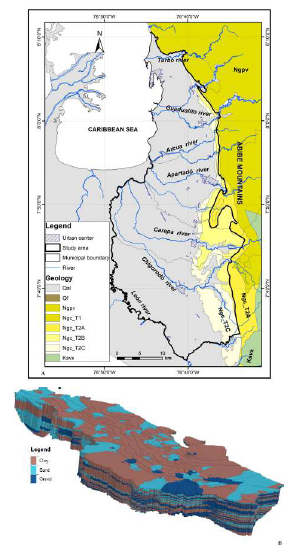
Figure 2 A. Geology of the study area. B. Geometric layered aquifer (modified from Universidad de Antioquia and CORPOURABA, 2014).
Based on the piezometric surfaces, built using the information obtained from monitoring water levels since 1998, it can be observed that water flows from east to west, towards the León river and the Gulf of Urabá (Ossa-Valencia and Betancur-Vargas, 2018) (Figure 3). The hydrogeochemical facies analysis along the flow directions defined through piezometric indicates the direction of the chemical evolution of groundwater. It identifies the direct recharge and the possible regional flow from distant recharge zones on Abibe mountain. On the other hand, the concentration of total dissolved solids (TDS) shows that waters with higher mineralisation and evolution (Na+ Cl- facies) occur in the northern zone (Ossa-Valencia and Betancur-Vargas, 2018). Following 14C data on the Uraba aquifer, there are waters with ages between 11,000 and 28,000 years (Villegas et al, 2018).
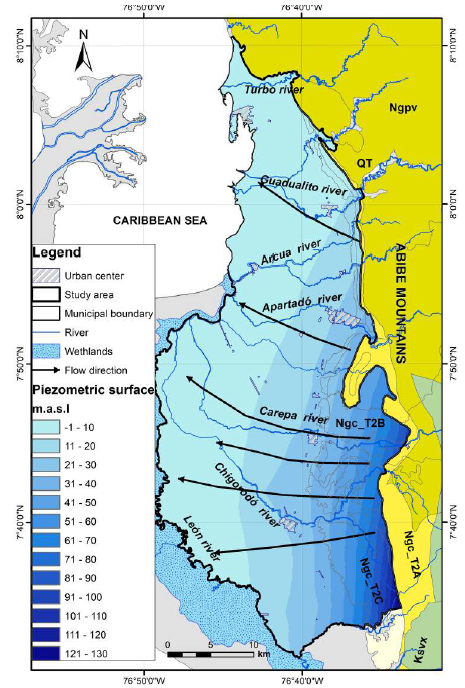
Figure 3 Piezometric surface and flow directions (modified from Ossa-Valencia and Betancur-Vargas, 2018).
Methodology
A methodology for multi-scale modelling for visualising flow systems in the studied aquifer is shown in Figure 4. Initially, a conceptual model was required to perform any numerical model. In the case of groundwater, a hydrogeological conceptual model was the starting point. Such models are generally built with basic information such as maps, geological descriptions, stratigraphic columns, hydraulic tests, piezometric levels, water budget, etc.
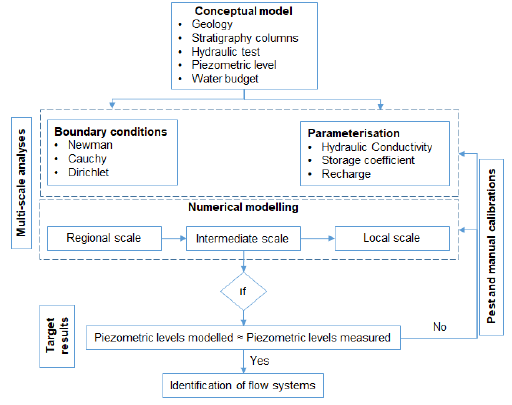
For the numerical modelling of groundwater, there are widely-used protocols (Anderson and Woessner, 1992) that serve as a guideline that must be followed to perform adequate modelling. Protocols are independent of modelling scales. They have their bases in understanding the physical behaviour of groundwater flow and its mathematical representation via empirical, analytical, or statistical equations because their usage depends on the information available. The general equation for groundwater low, which can be obtained by performing a mass balance and applying Darcy's Law on a unitary volume of the aquifer, is:
where K represents the hydraulic conductivity defined for each of the main directions x, y, and z; ∂h/∂x, ∂h/∂y, and ∂h/∂z correspond to the hydraulic gradient in the aquifer for each direction, Ss is the specific storage coefficient of the aquifer, ∂h/∂t is the piezometric head change across time, and W corresponds to the water inflow or outflow caused by elements external to the aquifer (e.g., recharge, flow across boundaries, extraction, or injection wells). Mathematically, three types of boundary conditions were defined, which can be internal or external: specified head boundary (Dirichlet conditions), specified flow boundary (Neumann conditions), and head-dependent boundary (Cauchy conditions). To build the multi-scale model, in which three models were nested (regional, intermediate, and local), the model’s design was repeated three times, taking into account the scale and detail of the information available. This defines the features of the models’ discretisation (namely, the cell size and number of layers in each of them). An adequate representation of a layered aquifer system is generally complex, and different discretisation levels must support its mathematical representation. The result is a careful exercise of (vertical) correlation and refinement of the layers (horizontal) while gradually advancing in terms of spatial escalation, progressing through the regional, intermediate, and local models. The boundaries of the model for the regional scale are grounded directly on the hydrogeological conceptual model. Its results provide the boundary conditions for the intermediate model, which, in turn, provide the necessary elements for establishing the boundary conditions of the local model.
The Groundwater Vistas® software was used for the multi-scale analyses. The USGS's modular hydrology model MODFLOW program is a graphical interface. Based on the features of the hydrogeological conceptual model for the Urabá (Colombia) (Universidad de Antioquia and CORPOURABA, 2014), the following Cauchy boundary conditions were defined: GHB (General Head Boundary) to represent water inflow and outflow through the border as well as the connection with the other models, River to simulate interactions between the major rivers, and Drain to represent the relationship with wetlands. The Neumann boundary conditions were: Recharge, for simulating distributed direct recharge and Well for representing water extraction via wells. Finally, the Dirichlet boundary condition known as CH (Constant Head) was used to simulate the constant level of the sea in the Gulf of Urabá.
A calibration process was carried out for the target results by performing an automatic approximation using the PEST calibration module built into the Groundwater Vistas® software (Environmental Simulations Incorporated, 2015). The values calibrated via PEST were the starting point for the manual calibration, whose aim was to obtain final values for hydraulic conductivity and recharge that were conceptually coherent and always proportional to the conditions of the study area.
Calibration was first carried out for the regional model, and the initial values came from the data on 158 pumping tests available in the study area. The results of this calibration were, in turn, the starting point for the calibration of the intermediate model. Finally, a new calibration was performed, and its resulting calibrated parameters became the starting point for the calibration of the local model. During this process, it was necessary to conduct a sensitivity analysis, which evaluated how and how much the piezometric levels changed as the hydraulic properties and boundary conditions in the model were modified. Likewise, the mass balance in the aquifer system under such circumstances was also estimated.
Finally, the mathematical modelling of groundwater made it possible to calculate water flow when provided with adequately calibrated initial and boundary conditions that fit a conceptual hydrogeological model. This procedure makes it possible to obtain the quantity of water flowing in the aquifer system and identify the flow directions.
Each modelling scale makes elements visible; a regional scale model represents regional flow trends, while intermediate and local-scale models show elements at higher levels of detail. Making several nested sections in each modelling scale allows for the visualization of the most important flow directions for each scale to integrate different flow systems displayed in the models.
Results
Model for the Urabá area, Colombia
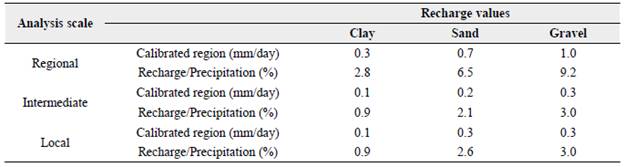
The multi-scale model comprises three modelling scales (regional, intermediate, and local) (Figure 5). The numerical models were designed with correlations of 45 hydro-stratigraphic sections in a west-east direction and 25 in a south-north direction. The regional model is the entirety of the study area, whose area is approximately 1,206 km2. Likewise, data from 258 logs from drilling were available, and the established cell size was 100 x 100 m distributed among 741 rows and 331 columns and formed by three layers (Figure 6).
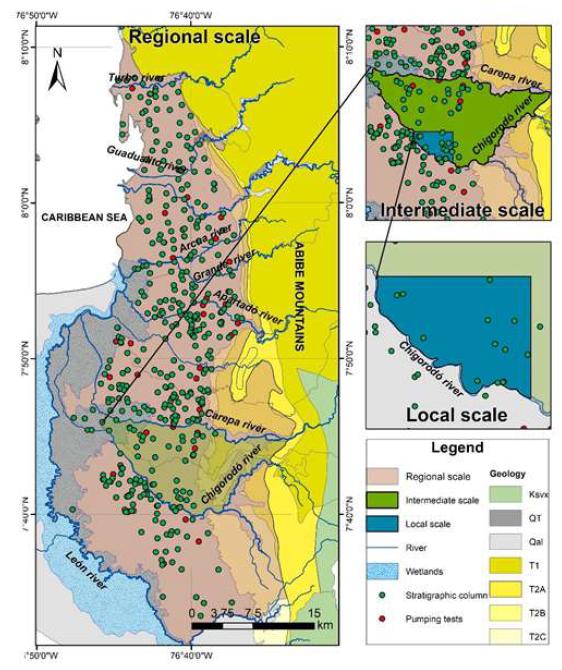
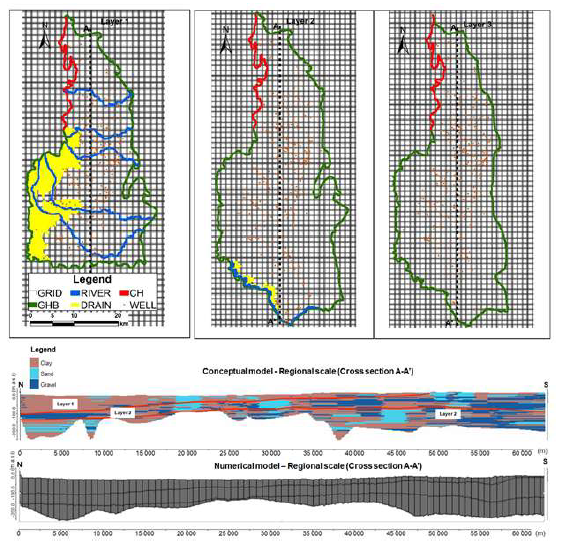
Figure 6 Boundary conditions and regional numerical model vs regional stratigraphie model. Distribution of the boundary conditions and cross section of the conceptual model together with its corresponding representation in the numerical model (regional scale).
The chosen area of interest for the intermediate model had enough hydrostratigraphic data (data from 73 logs of drilling) and essential natural borders. The defined area is bordered in the south by the Chigorodó river, north by the Carepa river, and west by the permanent wetlands of the León river. The surface of the intermediate model has an area of 138 km2, and the cells defined were 20 x 20 m, which resulted in 614 rows, 1127 columns, and five layers (Figure 7).
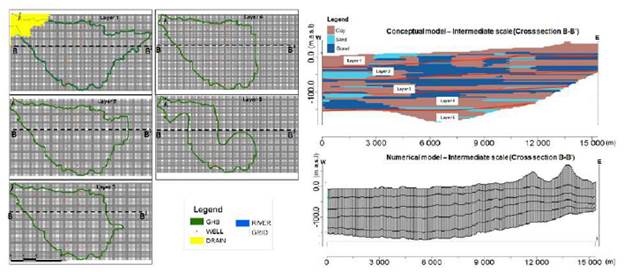
Figure 7 Boundary conditions and intermediate numerical model vs intermediate stratigraphic model. Distribution of the boundary conditions and cross section of the conceptual model together with its corresponding representation in the numerical model (intermediate scale).
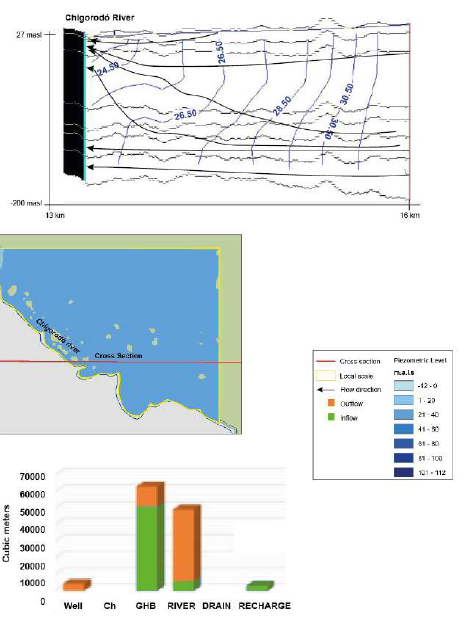
An area of approximately 25 km2 was defined inside the intermediate model for the local model. Using information from 22 logs from drilling, a cell size of 10 x 10 m was defined along with 498 rows, 554 columns, and seven layers (Figure 8). This area is bordered in the southwest by the Chigorodó river, which acts as a natural border for the system.
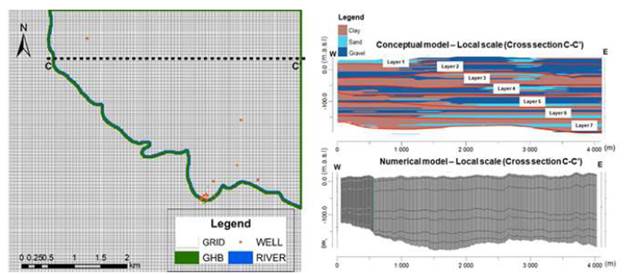
Figure 8 Boundary conditions and local numerical model vs local stratigraphie model. Distribution of the boundary conditions and cross section of the conceptual model together with its corresponding representation in the numerical model (local scale).
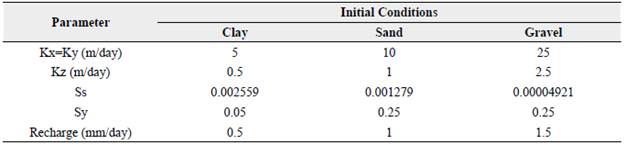
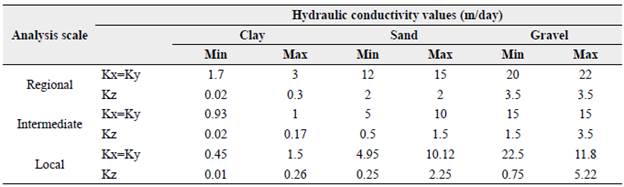
In all the models for each layer, three conductivity zones were defined related to the type of material formed: i) clay, ii) sand, and iii) coarse sand and gravel. For each of these, the following initial values were defined: hydraulic conductivity (K), specific storage (Ss) for the confined aquifer, and effective porosity (Sy) for the shallow aquifer. The aquifer was confined from the second layer for the regional and intermediate numerical models, and the third layer to the local numerical model, according to the distribution of the layer clays (aquitard) (Figure 2). Regionally, the continuity of a shallow and a confined layered aquifer is recognised, and the complexity of the layered aquifer is represented numerically with the change of scale, increasing the resolution. Moreover, initial direct recharge was only defined for the first active layer of the models, and its value depended on the material that appeared on the surface (Table 1).
Table 1 Initial properties in the multi-scale model (Universidad de Antioquia and CORPOURABA, 2014).
Calibration of field data
Information was collected from piezometric monitoring that has been regularly carried out three times a year (in March, August, and November) since 1998. This contains representative data regarding the hydro climatological periods, which characterise the region during the dry, wet, and transient seasons. Furthermore, the period from December 2010 to November 2011 was used to model the steady-state, while the transient state was split into three periods: the first one from December 2010 to March 2011, the second between April and September 2011, and the third and final period from October to November 2011.
Additionally, piezometric data from 40 wells distributed throughout the studied area were used to perform the calibration process automatically using the parameter estimation (PEST) model and fitting manually. In this process, the Pearson correlation coefficient (PCC) ranged from 85 to 94% for the steady-state (Figure 9) and between 77 and 96% for the transient state (Figure 10). For the calibration processes, the hydraulic conductivity (K) experienced changes of up to ±200% of the initial values for the conductivity zones associated with clay; for sand, this value was up to ±300%, and for gravel, it was up to ±133% (Table 2). Direct recharge was also calibrated with the water budget analysis performed by the Universidad de Antioquia and CORPOURABA (2014). The results showed that, on the regional scale, the initial recharge values decreased when compared with the calibrated values; for clay, a decrease from 0.5 to 0.3 mm/day was observed. For sand, the value decreased from 1.0 to 0.7 mm/day, and for gravel from 1.5 to 1.0 mm/day (Tables 1 and 3).
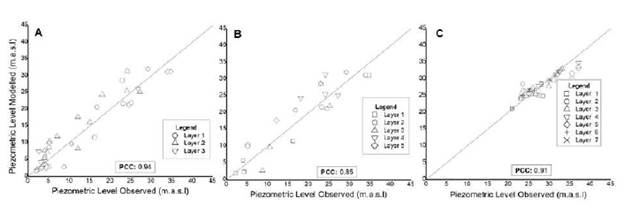
Figure 9 Results: Calibration in the steady stage. A. Regional model. B. Intermediate model. C. Local model.
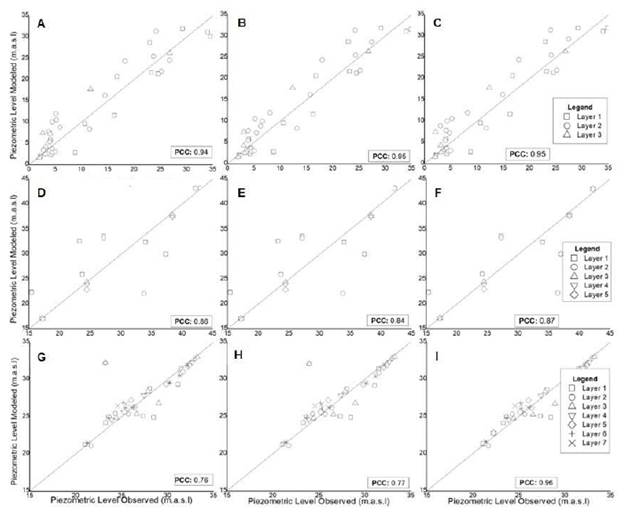
Figure 10 Results: Calibration in the transient state. A. Regional model (Dec 2010-Mar 2011). B. Regional model (Apr-Sep 2011). C. Regional model (Oct-Nov 2011). D. Intermediate model (Dec 2010-Mar 2011). E. Intermediate model (Apr-Sep 2011). F. Intermediate model (Oct-Nov 2011). G. Local model (Dec 2010-Mar 2011). H. Local model (Apr-Sep 2011). I Local model (Oct-Nov 2011).
Modelled piezometric surfaces and mass balance
The calibrated piezometric surfaces and the water balance were obtained for each modelling scale. In the regional model (Figure 11), groundwater flows from east to west, mainly from the Abibe mountain range to the Gulf of Uraba, the wetland system, and the Leon river. According to the mass balance for the regional model, approximately 45% of the water that flows in (2,013,342 m3/day) and out (2,250,568 m3/day) of the system passes through the GHB boundary condition on layers two and three. On the shallow layer, the recharge is 546,862 m3/day, and the main outflow is to the river boundary conditions (12%).
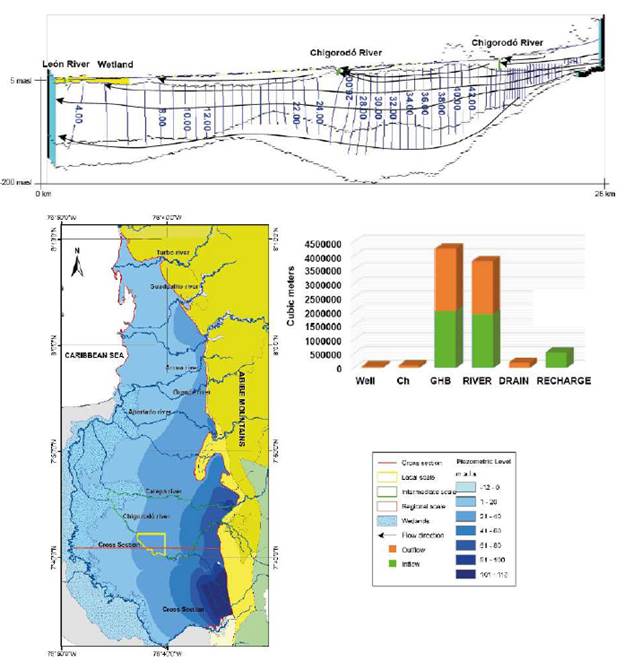
In the intermediate model (Figure 12) groundwater flows from east to west. The water flows into the system from direct recharge (on layer one) and the GHB boundary condition (west). Rivers receive groundwater (92,405 m3/day, 81%) discharged from layers one to three. The recharge is 18,559 m3/day.
In the local model (Figure 13), groundwater flows east to west on the seven layers. The rivers are the most crucial local outflow (43,568 m3/day-73%) from layers one to four. On layers, five to seven, the groundwater inflow (51,092 m3/day-85%) and outflow (11,922 m3/ day-20%) are across the GHB boundary conditions, and the recharge is 2883 m3/day, with this volume and percentage corresponding for the total flow of water in the local model.
Discussion
This work has allowed the visualisation of regional flow systems on a layered aquifer based on groundwater monitoring through lithological and hydro-stratigraphic data, soil drilling at different depths, geophysical measurements of soil resistivity, and a water budget of the study zone. Additionally, the methodology included the most relevant topographical aspects of the study area, which are fundamental for defining the water level position. Considering the main topographic features, such as streams and mountain ranges, allowing for more realistic simulations of groundwater flows (Gleeson and Manning, 2008; Wang et al, 2018). Through these measurements and a process of multi-scale numerical analysis, it was possible to visualise how groundwater flows occur in a multilayer aquifer.
Numerical modelling is crucial for representing flow behaviour in an aquifer system. Achieving this requires a hydrogeological conceptual model that enables the appropriate initial and boundary conditions representing the system. Furthermore, it is a dynamic and cyclic process that helps identify possible phenomena not recognised in the conceptual model. It also makes it possible to ask new questions, which may help us refine and better understand the system as we try to answer them.
The multi-scale analysis is a tool for visualising and understanding how subsurface water flows over large areas. It allows the nesting of information obtained at regional, intermediate, and local scales, and their results represent an important aspect of water resource management and protection. To understand the relationship between the modelling scales - local, intermediate, and regional - as well as to visualise different flow phenomena, nesting from the local model to the intermediate model and then to the regional model in the same cross-section was performed (Figure 14). Figure 14C shows a better definition of the equipotentials and flow directions obtained with the local model, where flows that gain depth and ascend to discharge into the river are visualised. Due to its low level of detail, these processes cannot be observed in the model on a regional scale (Figure 14A). This modelling strategy allows local phenomena to be represented in the model at a regional scale, with appropriate nesting and refinement and correct interpretation of the boundaries connecting the three models.
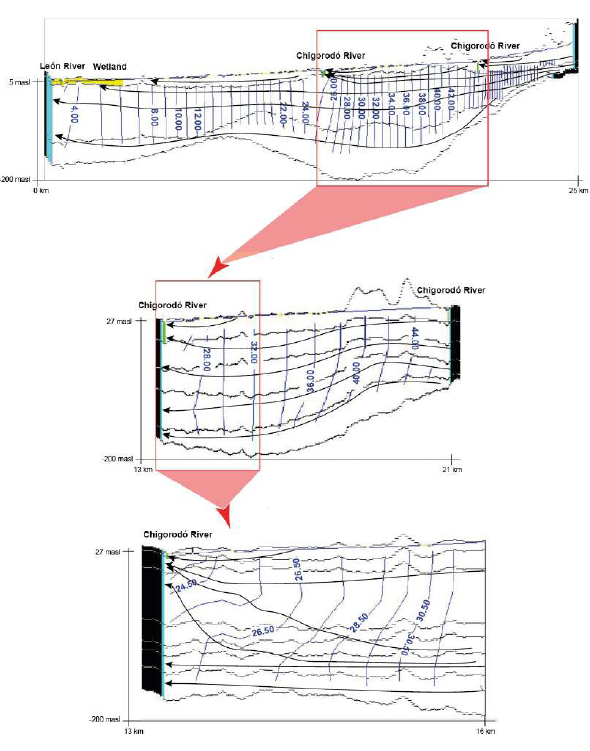
Figure 14 Flow behaviour in the multi-scale model. A. Regional model. B. Intermediate model. C. Local model.
According to the mass balance results obtained in the three models, the flow across the GHB border is, in all cases, higher than the direct recharge. For the regional model, according to the flow direction, the water entry from the GHB border mainly occurs from the eastern side towards the Abibe mountains, indicating the transfer of flow from other geological units. Similarly, the intermediate and local models can be considered transit zones in the deep levels of the aquifer since interaction with surface waters is observed in the first layers. Conversely, although no travel times were calculated during this work, the equipotentials and flow directions show that there are long paths of water moving in an east-west direction, mainly towards the deep levels of the aquifer, which is consistent with the residence times obtained by Villegas et al. (2018).
The level of detail in a model depends on the modelling scale the complexity of the hydrogeological conceptual model, and available computing power. In this regard, a better comprehension of the flow processes in complex hydrogeological systems (e.g., multilayer aquifers) may be achieved by calibrating multi-scale numerical models since their stratigraphic complexity can be more detailed during the scaling process.
In this sense, layered aquifer modelling enables approaching the identification of the above-mentioned processes via the construction of vertical and horizontal cross-sections at three different levels of detail that help better observe flow behaviour in the vertical scale and provide a first look at the flow systems, which must later be validated employing hydrogeochemical and isotope analyses.
In general terms, numerical modelling provides a structure to systematise field information, answer questions on aquifer operation, and direct the modeller's attention toward the occurrence of phenomena that have not been considered. At the same time, it helps identify areas where additional data is required and the need to fit the original conceptual model.
Regarding the study area, during the last few years, towards the eastern sector in the Abibe mountains, informal urbanisation processes have been taking place, leading to the impermeabilisation of areas that could be contributing to the regional flows towards the aquifer. In the long term this, together with the increase in groundwater exploitation, will result in decreases in piezometric levels, the alteration of river-aquifer and wetland-aquifer relations, and subsidence, among other phenomena related to the depletion of groundwater. Multi-scale analyses can undoubtedly make significant contributions to the development of land use plans, where measures could be implemented to avoid further occupation or intervention in aquifer recharge areas.
Conclusions
It is possible to consider the results of this modelling process satisfactory since the Pearson correlation coefficients ranged from 77% to 95% for the steady and transient flow states at the three modelling scales. These magnitudes are consistent with recommendations and descriptions in the literature. During the calibration tasks, the model was observed to be more sensitive to recharge since minimal changes lead to significant increases or decreases in the piezometric levels of the aquifer. Concerning the water budget in the studied area, the best recharge fittings correspond to the values fit in the model at the intermediate and local scales.
This shows a better approximation when the modelling area decreases. With information from a distributed water budget analysis conducted in the studied area, it will be possible to compare the recharge values calibrated in the model and fit them if necessary.
When calibrating hydraulic conductivity, K, the changes in the scale generate changes in its values; the reason for this is that increasing the level of detail has a refining effect on conductivity zones, and therefore the values for the hydraulic conductivity of gravel, sand, and clay in the regional model are different from those obtained with the intermediate and local models. New data obtained from hydraulic tests (e.g., pumping and slug test) will make it possible to define which modelling scale better fits.
In the case of the Urabá, Colombia, multi-scale numerical modelling made it possible to nest a local model within an intermediate one, and both within a regional model. As a result, it was possible to transcend-as resolution and detail increased- visualising the flow system and the interaction between groundwater and surface water. The numerical modelling results are consistent with the conceptual flow model and reproduce the trends validated by hydrogeochemical and isotopic techniques.
The vertical and horizontal discretisation and the boundary conditions that were calibrated for each modelling scale allowed us to accurately represent the behaviour of the aquifer system, including the external elements and relationships between each one.
Exercises such as these provide grounds for decision-making and proper management of hydrogeological systems. These tools can provide important information regarding water availability for awarding concessions, water renewal rates, and the determination of zones of influence.
The results obtained in this work are first step multi-scale modelling as a tool to recognise groundwater flow systems in an aquifer system. Further research on aquifer systems of different types is required. Such studies should assess different levels of detail for the three modelling scales. They should also use other models and assess new boundary conditions and the effects of civil works such as tunnels, bridges, buildings, and canalisations. Finally, they should seek to advance graphic representations of the results. It is worth pointing out that multilayer modelling must be backed by new data and other techniques used in hydrogeology, such as hydrogeochemistry and isotope geochemistry.
The results obtained in this work show the potential of multi-scale modelling as a tool to recognise and understand the groundwater flows in a layered aquifer system.

