


 Inglés (pdf)
 Articulo en XML
 Referencias del artículo
 Enviar articulo por email
 Citado por SciELO
  Citado por Google
  Similares en
SciELO
Similares en
SciELO  Similares en Google
 Permalink
Introducción
Lithium (Li) is an alkaline element, of a lithophilic geochemical nature, that is, it has an affinity for silicates and oxides in rocks. The physical and chemical properties of lithium and its compounds allow them to be used in various industries: glass and ceramic manufacturing, lithium ion batteries (LIBs), lubricants, air treatment, steel industry, production of pharmaceuticals and polymers, primary aluminum production, among other uses (Changes and Swiatowska, 2015). World lithium reserves are 22 million tons, of which Chile has 41%, Australia 25% and, Argentina 10% (USGS, 2022).
The crustal abundance of Li is low, the clarke in the crust is 20 ppm, and varies according to the type of rock and reservoir, the mean values of various lithologies and aquatic regimes are given as follows: basic rocks 17 ppm Li, intermediate rocks 20 ppm Li, syenites 28 ppm Li, granites 40 ppm Li, shales 66 ppm Li, sandstones 15 ppm Li, carbonate rocks 5 ppm Li, river water 3 mgL-1 Li, sea water 180 μgL-1 Li (Dill, 2010).
Lithium is found in three main types of deposits: 1) Li-rich pegmatite magmatic deposits containing spodumene (LiAlSi2O6) and rhyolitic tuffs containing Li, F and Be. 2) continental brines, and 3) hydrothermally altered clays, with hectorite (Na0.3(Mg,Li)3Si4O10(OH)2) (Webmineral, 2022) formed by hydrothermal alteration of volcanoclastic rocks (Munk et al., 2016). Other secondary sources of lithium include: salt flats, and formational waters of oil fields, (Dill, 2010; Pohl, 2011; USGS, 2022).
It was proposed to carry out the geochemical prospecting study in favorable environments to host possible lithium mineralization, in a specific sector of Ecuador. Detecting any anomaly or occurrence would be of great importance for the country, since no anomalies of economic interest have been discovered (Inguaggiato et al., 2010; Gonzaga et al., 2017). In this case, a sampling of evaporite salts was carried out in Salinas de Guaranda, Bolívar province, in which a total of 8 water samples (brines) and 8 solid samples (salts and crusts).
The study area
Location
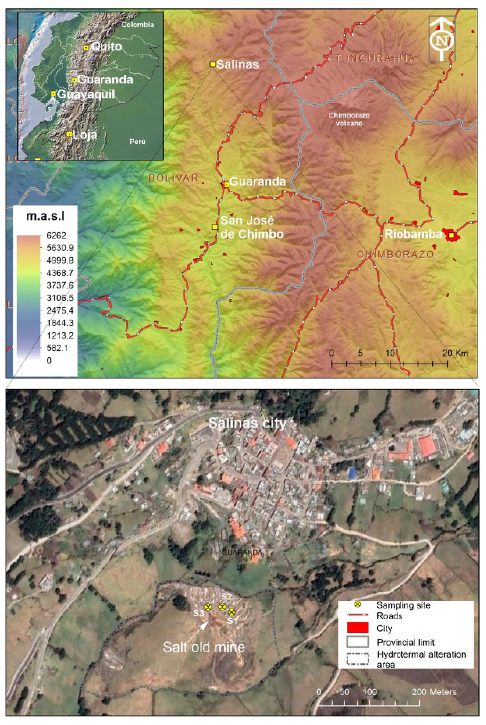
The Salinas de Guaranda sector is located in the Bolívar province, Guaranda canton, Salinas parish, northeast of the city of Guaranda (Ecuador) (Figure 1), at an altitude of 3,550 meters above sea level. It takes its name from the saltwater mines that can be found when crossing the river that runs through it and that bears the same name. Until the years 1960-1970, the exploitation of these salt mines was the main economic activity of the inhabitants of that time, complemented by agricultural work in small plots and an incipient livestock activity until the end of the 60s. Some studies have detected high Li values of 10.808 meq/L (Inguaggiato et al., 2010) to the average Li in seawater 0.18 mgL-1 (180 μgL-1, 0.026 meq/L) (Li, 1982).
Geological setting
The Salinas sector is located on the western flanks of the Western Cordillera (Figure 2), located in rocks of the Zumbagua Group, consisting of poorly classified coarse-grained sandstones and unclassified debritic breccias and matrix supported by forming layers of several meters thick, acidic to intermediate tuffs, tuff sandstones and locally, in the Salinas área horizontal gaps interpreted as laharitic units that form an elongated body oriented from north to south are also visible. The sandstones are rich in lithics and/or crystals (quartz-feldspar-amphibole); clasts in coarse sandstones, breccias, and lahars are almost exclusively volcanic material. Zircon fission trace ages of tuff and tuff sandstones indicate Middle to Late Miocene (16.8-7.9 Ma) (BGS-CODIGEM, 1997).
The source of saline water that arises in these rocks, forms calcareous and saline concretions on the surface that form a karst landscape with multiple sources no larger than 1m2, which constitute exit points (upwellings) of gas and water that carry ions and minerals through a process of dissolution (and also mechanical erosion) than can be produced by a system of interconnected underground conduits (Andreu et al., 2016).
To the west is the Arrayanes Unit (EAr) from the Late Eocene, made up of volcanic rocks and volcano sediments with andesite-basaltic lavas. This unit is superimposed on the Macuchi Unit (PcEM) from the Early to Middle Eocene, which comprises volcanic sandstones, breccias, tuffs, gabros diabases, subporphytic basalts, padded lavas and few calcarenites. The unit shows definitive characteristics of an insular arch and includes basalts to subalkaline basaltic andesites of tholeiitic affinity to chalcoalkaline with geochemical characteristics related to subduction. All these sequences are intruded by extensive plutons of medium to coarse-grained tonalites and granodiorites with ages of 35 to 10 Ma (BGS-CODIGEM, 1997).
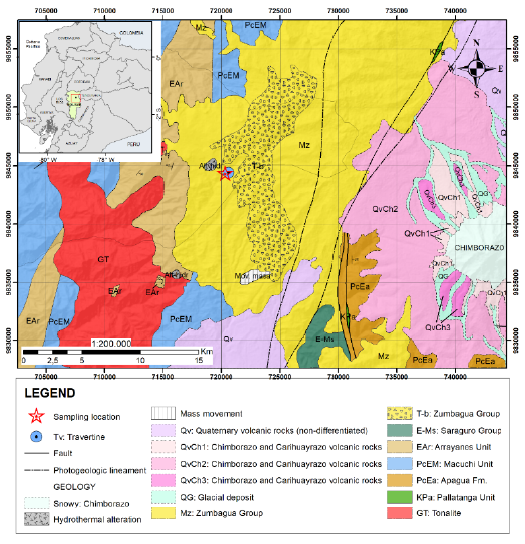
To the east, the volcanic rocks of the Chimborazo and Carihuayrazo Volcanoes (QvCh 1-3) predominate, including lavas, pyroclastic flows, lahars, debris avalanches and ash deposits. The lavas of Carihuayrazo and the oldest of Chimborazo (QvCh 1) are phyrics andesites with pyroxene; the youngest Chimborazo lavas (QvCh 2), which are confined to the southeast flanks, are pyroxene andesites and pyroxene vesicular dacites. The youngest products (QvCh 3) are found along the western flanks and include lahars, debris avalanches, lavas, and coarse-grained tuffs, pumaceous, of general andesitic to dacitic composition. Some Undifferentiated Quaternary volcanoes (QV) include tuffs, breccias, agglomerates and andesitic lavas from the Pleistocene of older volcanic centers such as Chimborazo and Carihuayrazo. Also included in this general unit are the Guaranda Volcanoes, a series of andesitic tuffs and porphyritic andesites from the Pleistocene. The youngest deposit in this unit is an unstratified, partially consolidated volcanic ash from the Late Pleistocene to Holocene Cangahua Unit (BGS-CODIGEM, 1997).
Methods
The water samples were taken from the three saline upwelling pools (hydrothermal brines) (review supplemental material for coordinates and lab results). A volume of 200 mL to 500 mL was collected per sampling point and some physicochemical parameters such as pH and, temperature were measured (in situ). Then each sample was acidified with 1.5 mL of concentrated nitric acid (HNO3) (only for the case of cation analysis) and they were refrigerated until their analysis in the laboratory. To see the complementary data, review Supplementary Table 1.
In the laboratory, the water samples were filtered by 45-micron filter paper and analyzed using Optical Emission Spectrometry with Inductive Coupling Plasma (ICP-OES) Perkin Elmer Optima 800 DV model, in the Analytical Geochemistry Laboratory of the Geosciences Department, Universidad Técnica Particular de Loja (UTPL), after calibration with certified multielement standards. In this analysis, the concentration of major, minor and trace elements was obtained: Ca, K, Mg, Na, Zn, Pb, Cd, Ba, Fe, Mn, Li, Rb, Be, and Sr. The anion analyzes (Cl-, CO3 2- , HCO3 -, SO4 2-) were carried out by titration, except for sulfate (SO4 2-) which was analyzed by UV/VIS spectrophotometry.
Solid samples were collected from the evaporation and salt crystallization around the pools (review supplemental material for coordinates and lab results), as well as from a calcareous crust that surrounds the hydrothermal brine upwelling pools (Figure 3), approximately 200 g of fresh material per sample. The samples were dried at 105oC for 24 hours in the oven, then they were cut, crushed and pulverized. The chemical analyses of two replicas were made in Actlabs, Canada, and carried out using the analytical package: Code 8- Li (Sodium Peroxide Fusion just for Li) (to see the complementary data, review Supplementary Table 2). All samples were analyzed using an XRF spectrometer Bruker S1 Turbo and, Optical Emission Spectrometry with Inductive Coupling Plasma (ICP-OES) at UTPL, detecting the following elements (with its detection limits or lower limits): Si (0.01 wt%), Al (0.01 wt%), Fe (0.01 wt%), Mg (0.01 wt%), Ca (0.01 wt%), Na (0.01 wt%), K (0.01 wt%), P (0.01 wt%), S (0.01 wt%), Ba (0.1 ppm), Be (0.1 ppm), Mn (0.1 ppm), Li (0.1 ppm), Rb (0.1 ppm) and, Sr (0.1 ppm).
X-ray diffraction (XRD) analyses were performed on pulverized rock samples using a Bruker, model D8 Advance diffractometer, in the XRD laboratory of the Department of Chemistry and Exact Sciences of UTPL, Ecuador, with the following specifications: Cu X-ray generator tube, K-Alpha1 1.5418 (Å), SSD 160 detector, with a set of 40 kV and 25 mA, with a linear count of up to 2,106 cps and step times of 0.5. The software used for the processing were: EVA Diffrac Plus and TOPAS, using the Structure D8 and COD references files (databases). Phase quantification was made using the Rietveld Method with TOPAS software.
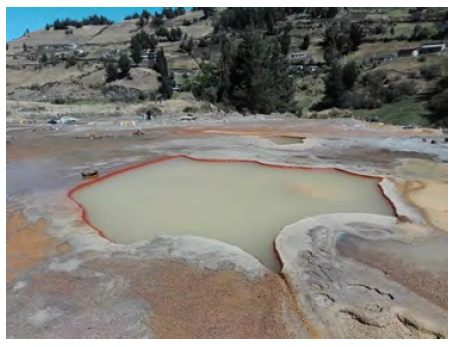
Table 1 Statistical parameters of the chemical data of the Li-bearing brines of Guaranda.
| Element | Min1 | Max | Mean | Median | S.D. |
|---|---|---|---|---|---|
| Ca (mg/L) | 747.35 | 1266.28 | 998.72 | 987.78 | 186.54 |
| K | 1977.25 | 3007.87 | 2507.97 | 2517.12 | 338.56 |
| Mg | 460.82 | 525.13 | 485.78 | 475.61 | 22.49 |
| Na | 17516.34 | 21710.01 | 19192.80 | 18912.88 | 1463.95 |
| Zn | 0.25 | 3.56 | 1.25 | 0.62 | 1.39 |
| Pb | 0.27 | 0.68 | 0.39 | 0.31 | 0.18 |
| Cd | 0.10 | 1.08 | 0.31 | 0.19 | 0.32 |
| Ba | 0.02 | 0.04 | 0.03 | 0.03 | 0.01 |
| Fe | 0.25 | 41.47 | 8.77 | 4.46 | 13.48 |
| Mn | 0.12 | 1.83 | 0.94 | 0.97 | 0.54 |
| Li | 203.25 | 268.73 | 226.38 | 222.46 | 22.80 |
| Rb | 20.92 | 31.15 | 25.02 | 24.24 | 3.50 |
| Se | 0.13 | 0.28 | 0.18 | 0.16 | 0.05 |
| Be | 0.15 | 0.17 | 0.16 | 0.16 | 0.01 |
| Sr | 4.97 | 6.03 | 5.35 | 5.28 | 0.33 |
| Cl- | 28308 | 52080 | 40891 | 41710 | 9216 |
| CO3 2- | 3 | 5 | 4 | 4 | 2 |
| HCO3 - | 478 | 781 | 549 | 494 | 119 |
| SO4 2- | 1263 | 1951 | 1663 | 1738 | 296 |
1Min, Max, Mean, Median, Standard Deviation in mg/L (ppm).
Li-bearing solids of the Guaranda
The statistical treatments of the chemical data of the Li-bearing solids of Guaranda are given in Table 2. Contents of Be, Li, and reached sub-anomalies values (median + 2 standard deviation) (Howarth, 1983), whereas sub-anomalies or anomalies of other trace elements, such as Ba, Mn, Rb and, Sr, were not detected (Table 3).
Table 2 Statistical parameters of the chemical data of the Li-bearing solids of Guaranda.
| Element | Min1 | Max | Mean | Median | S.D. |
|---|---|---|---|---|---|
| SiO2 (wt%) | 1.57 | 63.26 | 22.41 | 4.76 | 27.17 |
| Al2O3 | 0.16 | 7.20 | 2.98 | 2.80 | 2.51 |
| CaO | 0.24 | 68.50 | 30.79 | 20.82 | 26.76 |
| MgO | 0.12 | 11.30 | 1.69 | 0.25 | 3.89 |
| K2O | 0.02 | 10.49 | 3.92 | 3.72 | 3.83 |
| P2O5 | 0.74 | 2.78 | 1.72 | 1.72 | 0.57 |
| S | 0.94 | 14.43 | 2.79 | 1.16 | 4.70 |
| Na2O | 3.37 | 32.31 | 7.37 | 3.89 | 10.08 |
| Fe2O3 | 0.02 | 8.38 | 2.12 | 0.30 | 3.25 |
| Ba (ppm) | 3.9 | 33.6 | 25.7 | 29.1 | 9.5 |
| Be | 3.9 | 5.0 | 4.2 | 4.1 | 0.3 |
| Mn | 4.3 | 610.6 | 276.3 | 261.6 | 178.8 |
| Li | 128.0 | 1109.4 | 312.0 | 201.5 | 326.2 |
| Rb | 62.5 | 312.9 | 213.0 | 217.5 | 76.5 |
| Sr | 127.0 | 215.0 | 192.8 | 198.8 | 28.0 |
1Min, Max, Mean, Median, Standard Deviation in wt% (SiO2 to Fe2O3) and ppm (Ba and below).
Table 3 Geochemical anomalies of the Li-bearing solids of Guaranda.
| Element | Background | Threshold | Sub anomaly |
|---|---|---|---|
| SiO2(wt%) | 4.76 | 31.93 | 59.09 |
| Al2O3 | 2.80 | 5.31 | |
| CaO | 20.82 | 47.57 | |
| MgO | 0.25 | 4.14 | 8.03 |
| K2O | 3.72 | 7.55 | |
| P2O5 | 1.72 | 2.29 | |
| S | 1.16 | 5.86 | 10.57 |
| Na2O | 3.89 | 13.98 | 24.06 |
| Fe2O3 | 0.30 | 3.55 | 6.81 |
| Ba (ppm) | 29.1 | ||
| Be | 4.1 | 4.5 | 4.8 |
| Mn | 261.6 | 440.4 | |
| Li | 201.5 | 527.7 | 853.8 |
| Rb | 217.5 | 294.1 | |
| Sr | 198.8 |
SiO2 to Fe2O3 in wt% and ppm (Ba and below). Background was calculated with the median of data, threshold (median + stand dev) and sub anomaly (median + 2*stand dev). Anomalies were not detected.
The mineralogical analyzes carried out by X-ray diffraction (XRD) have revealed that the solids are composed predominantly of calcite (CaCO3) and halite (NaCl) (Table 4). In addition, saponite and fluorferroleakeite as lithium-bearing minerals (likely), as well as silicates, clays, sulfates, halides, borates, phosphates and nitrates have been identified.
Table 4 XRD mineralogy of the solid samples from Guaranda.
| Sample ID | Major1 | Moderate | Minor |
|---|---|---|---|
| 1 | Halite | Saponite2 | Gypsum, Sylvite |
| 2 | Calcite | --- | Mutinaite, Brushite, Halite |
| 3 | Calcite | --- | Halite |
| 4 | Quartz | Calcite, Orthoclase, Mutinaite, Sylvite | Fluor- ferroleakeite2, Halite |
| 5 | Orthoclase, Quartz | Fluor- ferroleakeite2, Halite, Calcite | Halite |
| 6 | Calcite | --- | --- |
| 7 | Calcite | Quartz, Fluor- ferroleakeite2, Orthoclase, Mutinaite, Brushite, Sylvite, | Halite |
| 8 | Gypsum | --- | Nitre |
1Major >25%; Moderate 5%-25%; Minor <5%; 2Saponite and fluor-ferroleakeite as lithium-bearing minerals (likely).
Discussion
Li-bearing hydrothermal brines of the Guaranda
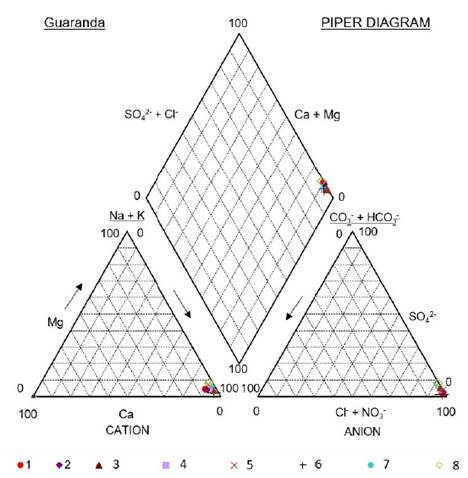
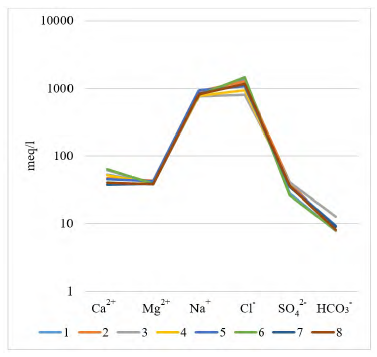
The major chemical composition of the studied brines is rather constant; brines are typically rich in Na+ and Cl−, subordinated SO4 2−, and relatively poor in Ca2+, Mg2+ and HCO3 - + CO3 2−. Another fact is that in the Guaranda brines the concentrations of K+ are 4 to 6 times higher than those of Mg2+.
The low Ca2+ concentrations observed at Guaranda (median 987.78 mg/L, Table 1) may be determined by contributions from freshwater (meteoric) (Inguaggiato et al., 2010) with depleted Ca2+ concentrations and/or the precipitation of calcite, may be the result of the local geochemical processes that cause it., which is one of the main mineral phases identified in the crusts around the upwelling pools, which is reported as travertine (BGS- CODIGEM, 1997). Lower concentrations of dissolved carbon (HCO3 - + CO3 2−) have been measured in these hot springs and the presence of travertine deposits in this region is evident, which could be since that carbon is eliminated by kinetic fractionation, through precipitation of carbonate.
This chemical composition is controlled by limited concentrations of carbonate and Ca2+ resulting in relatively richer sulfate, chloride and sodium content at increasing stages of evaporation, which is typical of mature brine in equilibrium with water halite (NaCl) and mirabilite (Na2SO4) (Hardie and Eugster, 1970), although the latter was not detected in the present study.
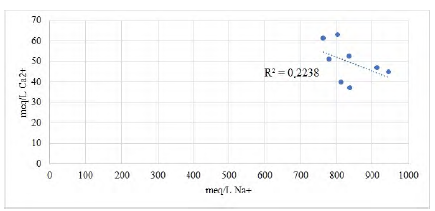
The ratio Na+:Cl− (1:0.7) indicates the precipitation of halite. The negative trend between Ca2+:Cl− (Figure 6) indicates the precipitation of calcite before halite, due to the difference in the solubilities of these mineral phases. In addition, the Ca negative deviation represents the local removal of cations by adsorption or ion exchange (Schijf, 2007).
The Li+ concentration in brines ranges from 203.25 to 268.73 mg/L in Guaranda. The Li:Mg median ratios are 0.82, while the mean Li:K median ratios is 0.51, in Guaranda brines. This may also suggest a common supply for most of these ions and similar geochemical behavior.
Li preferentially exists in solution and concentrates in clays (saponites) after long cycles of water evaporation and precipitation of soluble, non-Li salts (eg, halite or calcite). This is supported by the lack of correlation between Li and major ions such as Cl− and Na+ (López- Steinmetz et al., 2020).
Li-bearing salts and crust of the Guaranda
Mineralogical analysis by XRD, determined that most of the samples contain calcite, except for of sample 1 which is composed mainly of halite and saponite, and sample 8 which is composed mainly of gypsum and niter. Clay from the hectorite group, saponite, was detected in sample 1, which contains the highest concentration of Li in the study. In three samples, fluoroferroleakeite was detected, which is a sodium amphibole with Li on structure lattice (Na3Fe2+ 2Fe3+ 2Li(Si8O22)F2), which can be found in mildly peralkaline porphyry (Hawthorne et al., 2001). Additionally other mineral phases were identified as quartz, orthoclase, sylvite, brushite and mutinaite, in general silicates, chlorides and phosphates.
With the data on the chemical composition of the Guaranda solids, a multivariate statistical analysis was made. In the principal component analysis (Figure 7), it is shown that Li is associated with Be and Na, which indicates a geochemical association between elements in clays (saponite) and in halite, where Li+ and Be2+ can replace Mg2+ (Misra, 2012), mainly in saponite, since the replacement of Li+ for Na+ in halite may be more limited, due to differences in ionic radius While Mg, Ca, S, P, Ba and Sr, can be associated, which corresponds to, calcite, gypsum and brushite, in which trace elements such as Ba and Sr can be in the lattice structures of these mineral phases, for if the similarity in ionic potential with major and minor elements such as Ca and Mg. Another specific geochemical association is that of Si, K, Al, Fe, Mn, and Rb, which indicates the silicate and clay phases, in which Rb+ for example could replace K+.
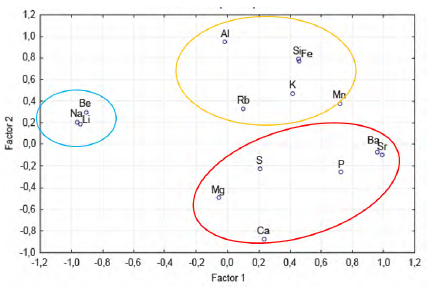
These geochemical associations are also shown in the factor analysis (Table 5). Na (-0.964), Be (-0.908) and Li (-0.945) are grouped into factor 1, indicating a similar geochemical behavior of these elements, and on the other hand P (0.724), Ba (0.957), Sr (0.985), related to phosphates, carbonates and sulfates. In factor 2, Si (0.799), Al (0.955), and Fe (0.778) are grouped, which would correspond to silicates and aluminosilicates, in addition to that factor, Ca shows an inverse behavior (-0.868), associated with carbonates, sulfates and phosphates with Mg, P, S, Ba and Sr.
Table 5 Factor loadings (unrotated) of chemical compositions Guaranda´s solids.
| Variable | Factor 1 | Factor 2 |
|---|---|---|
| Si | 0.455124 | 0.799416 |
| Al | -0.015973 | 0.955667 |
| Ca | 0.231243 | -0.868765 |
| Mg | -0.055467 | -0.483292 |
| K | 0.415438 | 0.475070 |
| P | 0.724530 | -0.249845 |
| S | 0.203776 | -0.218279 |
| Na | -0.964237 | 0.211874 |
| Fe | 0.459412 | 0.778542 |
| Ba | 0.957046 | -0.065785 |
| Be | -0.908349 | 0.296302 |
| Mn | 0.714529 | 0.381151 |
| Li | -0.945980 | 0.194031 |
| Rb | 0.102327 | 0.336380 |
| Sr | 0.985293 | -0.092183 |
Lithium also constitutes part of the lattice structure in the clays (hectorites) of the Clayton Valley (230 ppm Li), USA, for example, which host the lithium brines in what is now a shuttered brine plant (Davis et al., 1986; Warren, 2014). In the mineralogical analyzes, the saponite (Ca0.1Na0.1Mg2.25Fe2+ 0.75Si3AlO10(OH)2•4(H2O)) clay was identified in sample 1, which presents the highest concentration of Li detected in the study, 1109.4 ppm. This mineral phase belongs to the group of hectorite (smectite group), which is a clay of hydrothermal/ volcanic origin in whose lattice structure Li+ (0.60 Å) can replace Mg2+ (0.65 Å) (Railsback, 2003).
The high Li content (average 201.5 ppm) in Guaranda solids may be of interest, as economical deposits of lithium carbonate and borate salts tend to form in nonmarine environments and are common in high-altitude depressions, especially in subduction-related orogenic belts and other fault zones in the Earth’s continental crust (Ozol, 1978; Garrett, 2004; Warren, 2014). The hydrothermal brine upwelling pools are located at 3550 m a.s.l. altitude, in a volcanic geological terrain, constituted by the Zumbagua Group, in the subduction zone of the Nazca plate with the South American plate, resembling other Li-bearing brine deposits mentioned by Warren (2014).
Probably higher altitude, active tectonism/continental vulcanism, hydrothermal fluids and cooler climate are significant factors that are controlling the mobility and geochemical concentration of Li occurrences in the brines of Guaranda, Ecuador.
Conclusions
Brines sampled in the Salinas de Guaranda sector are of the sodium chloride type, which produces the precipitation of halite by evaporation.
The geochemical composition of the sampled hydrothermal fluids is the result of strong water-rock interactions associated with active hydrothermal volcanic fluids and/or surface water recharge, resulting in mineral dissolution.
Sub-anomalies values of Li (222.46 mgL-1 median) in brines and Li in Guaranda solids (201.5 mgL-1 median), can be comparable to exploitable Li deposits worldwide, which is interesting for its possible economic use.
Based on the multivariate statistical analysis, the chemical and mineralogical results, Li is associated with Be, Na, in the solids analyzed, this is evidenced in the detection of saponite and fluoro-ferroleakeite.
A second geochemical association was determined in the study with Ca, Mg, S, P, Ba and, Sr, related to carbonates (calcite or travertine), sulphates (gypsum) and phosphates (brushite). Finally, a third geochemical association with silicates and aluminosilicates containing: Si, Al, K, Fe, Mn and, Rb.

