


Services on Demand
Journal
Article
 English (pdf)
 Article in xml format
 Article references
 Send this article by e-mail
Indicators
-
 Cited by SciELO
 -
 Access statistics
Related links
-
 Cited by Google
 -
 Similars in
SciELO
Similars in
SciELO -
 Similars in Google
Share

 Permalink
Revista Colombiana de Entomología
Print version ISSN 0120-0488
Rev. Colomb. Entomol. vol.40 no.2 Bogotá July/Dec. 2014
ARTÍCULOS DE INVESTIGACIÓN / RESEARCH PAPERS
Aleurocanthus woglumi (Hemiptera: Aleyrodidae) geostatistics analysis in agroforestry and monoculture systems in Oriental Amazon
Análisis geoestadístico de la Aleurocanthus woglumi (Hemiptera: Aleyrodidae) en la agrosilvicultura y el monocultivo en la Amazonía Oriental
Anderson Gonçalves da SilvaI; Paulo Roberto S. FariasI; Diego Silva SiqueiraII, III; And Arlindo L. Boiça JuniorII, IV
IInstitute of Agrarian Science - Universidade Federal Rural da Amazônia - UFRA, Av. Presidente Tancredo Neves, 2501, 660077-530, Belém, PA, Brasil. Ph. D. and professor agroanderson.silva@yahoo.com.br. Correspondence author, Ph. D. and professor paulo.farias@ufra.edu.br
IISoil and Fertilizers Department - Universidade Estadual Paulista Júlio de Mesquita Filho (FCAV/UNESP), Via Acesso Prof. Paulo Donatto Castellane,s/n - CEP: 14870-000, Jaboticabal-SP, Brasil
IIIPh. D. silvasiqueira@yahoo.com.br
IVPhytosanity Department - Ph. D. and professor aboicajr@fcav.unesp.com.br
ABSTRACT
This work aimed to analyze the spatial and temporal distribution of citrus blackfly (Aleurocanthus woglumi) infestation in citrus farms in agroforestry and monoculture systems using geostatistics methodology to help the sampling optimization. The experimental area is located in Capitão Poço, Pará State, Brazil, where twelve samplings were taken from September 2008 to October 2009, evaluating the presence or absence of the pest in orange trees in both production systems. The citrus blackfly spatial distribution showed a grouping pattern, clustered in a spatial dependence described as spherical model, forming spots from 8.5 to 34 meters (model's reach) to both planting systems adopted. The citrus blackfly showed a strong tendency to infest the neighbor plant, forming spots that grow through the planting line. Based on the semivariogram reach parameter, the average number of suggested evaluations along the year for the agroforestry system would be 17 evaluations ha-1 and for the monoculture system seven evaluations ha-1. In the monoculture system, during the dry (from August to November) and the wet (from January to May) seasons the number of evaluations should not vary and seven evaluations ha-1 are recommend. However, in the agroforestry system it is suggested 12 evaluations ha-1 during the wet season and 23 evaluations ha-1 during the dry season.
Key words: Aleyrodidae; Citrus blackfly; Citrus sinensis; Tectona grandis; Variability; Sampling optimization.
RESUMEN
El objetivo de este estudio fue analizar la distribución temporo-espacial de la infestación de mosca negra de los cítricos (Aleurocanthus woglumi) en huertos de cítricos en sistemas agroforestales y monocultivos para ayudar en la optimización del muestreo. El área experimental se encuentra en el municipio de Capitán Poço, Pará, Brasil, donde fueron tomadas 12 muestras entre septiembre del 2008 a octubre del 2009. Se evalúo la presencia o ausencia la plaga en los naranjos en ambos sistemas de producción. La distribución espacial de la mosca negra se produce predominantemente en grupos con dependencia espacial descrita por el modelo esférico, formando focos de 8,5 a 34 m (alcance del modelo) para ambos sistemas, con una fuerte tendencia de infestar la planta vecina, formando agregados o focos de estos, cuyo crecimiento se encuentra principalmente en la línea del cultivo. Sobre la base del alcance del semivariograma, el promedio de las evaluaciones sugeridas a lo largo del año para el sistema agroforestal fue de 17 evaluaciones/ ha y los monocultivos fue de siete evaluaciones/ ha. En la temporada seca del sistema de monocultivo (agosto, septiembre, octubre y noviembre) y lluviosa (enero, febrero, marzo, abril y mayo) en esta región, no hay diferencia en el número de evaluaciones, manteniéndose 7 evaluaciones/ha. Sin embargo, en un sistema agroforestal en la temporada de lluvias, se sugieren 12 evaluaciones/ ha, mientras que 23 en la estación seca.
Palabras clave: Aleyrodidae; Mosca negra de los cítricos; Citrus sinensis; Tectona grandis; Variabilidad; Optimización de muestreo.
Introduction
Natural and agricultural ecosystems behavior depend on several factors that when integrated create a complex net of events and possibilities. When agricultural systems are explored, mapping variables linked to the phytosanitary aspects can improve management and planning towards sustainability, optimizing biological control as well as rationalizing the use of phytosanitary products. In the last decades, Brazil had important advances related to Integrated Pest Management (IPM), however, intense research is still needed in order to obtain better scientific-based action thresholds. One of the tools available and currently used in association with IPM is the geostatistics (Dinardo-Miranda 2007; Dal Prá et al. 2011).
The main applications of geostatistics in the agriculture field, specifically in the phytosanity field, have started in the 90s with Webster (1973). Information about spatial dynamics of variables is used to describe and understand pests and diseases development (Turechek and Madde 2000; Xu and Ridout 2001; Blackshaw and Vernon 2006; Farias et al. 2008). Okumura (2007) used geostatistics to improve pest control in citriculture. In that study Okumura (2007) compared the use of phytosanitary products based on the conventional sampling methodology (that takes into account the average value of all field studied) with a method based on kriging maps. The results indicated that there were great benefits to the agricultural sector when the decision was taken based on kriping maps. This kind of technology is much more interesting in sensitive regions, such as Amazon, a region that demands a minimal environmental impact.
In the Amazon region the Agroforestry Systems (AS's) are an important way of production, providing a lower environmental impact. Among several agroforestry models used in Amazon area, the citrus (Citrus sinensis [L.] Osb.) and teak (Tectona grandis L. F.) ones deserve to be highlighted due their economical and social importance. However, studies about efficiency of agroforestry systems involving the orange tree culture are few. Studies about integrated pest management in those systems in this region, focused on sampling criteria, control practical, among others are even fewer.
The pest that deserves attention in this kind of system in this region is the citrus blackfly (Aleurocanthus woglumi Ashby). Besides causing direct and indirect damages to citric plants, the citrus blackfly is a present quaternary pest or an A2 level pest, a maximum alert level, limiting citrus commercialization in regions without the insect (MAPA 2011). In the Amazon Region this pest finds its optimum developmantal conditions, hence presenting a very fast evolutional cycle, and having up to 5 to 6 generations per year. Each female lays fromtwo to three eggs spirals during its life, which varyies from 10 to 14 days. Each egg batch has about 35 to 50 eggs (Pena and Silva 2007; Silva et al. 2011a). The temporal variability linked to the pest's biological cycle, which is directly related to environmental factors such as temperature and humidity, hinders the development of a sampling plan.
Some control plans adopted in Amazon region are sampling systems developed to places where the environmental conditions are different, making the sampling unrepresentative. Another issue is the seasonality. Few sampling systems were developed to represent the pest evolution distribution or dynamics throughout a specific period. In the blackfly's case it gets worse, because without appropriate control measures the pest along with the sooty mould (Capnodium Citri Berk & Desm.) fungus can cause severe losses to the citriculture, reducing yield in about 80%. When the severe attack is in young plants as well as in seedlings, plants can even die (Parkinson and Seales 2000).
Therefore, this work aimed to analyze the citrus blackfly spatial and temporal distribution in citrus orchards in agroforestry and monoculture systems, using geostatistics methodology to help sampling optimization.
Material and methods
Study site. The experimental area is located in Oriental Amazon, Capitão Poço, Pará State, Brazil. This city is the most important citrus producer in the region (IBGE 2013). Its geographical coordinates are: 01º45'S 47º07'W (Fig. 1).
The soil was classified as Oxisol (alic, Yellow Latosol) (EMBRAPA 2006) and the clime as Ami, according to the Köppen classification, with the wet season extending from January to March and the dry season from August to November (Köppen 1948).
The Agroforestry Planting System (APS) experimental field is represented by a seven year-old "Pêra Rio" (C. sinensis) variety orchard rootstock of rangpur lime (Citrus limonia Osbeck), growth in a 5 x 7 m spacing, distributed in 32 lines, with 52 plants each, totalizing 1664 plants (58240 m2) and 89.9 % of the total APS. In this area, the teak plants are distributed between every three citrus planting lines, totalizing 11 teak lines, 187 plants, and 10.1 % of the total APS (Fig. 1).
The Monoculture Planting System (MPS) experimental field is represented by the same age, variety, rootstock, and spacing as the AMS, but with 44 plants in each growth line, totalizing 1408 plants (49.280 m2). Both planting systems had the same plant density, 285 plants per hectare (10.000 m2) (Fig. 1).
Both fields (APS and MPS) were fertilized according to the soil analysis, considering the citrus nutritional demand. The weed control was done using a mower between lines and using herbicide in the planting lines. No insecticide was applied during A. woglumi sampling period.
Sampling design. The population survey was done under field conditions in all plants (1664 plants in the APS and 1408 plants in the MPS), evaluating the presence or absence of A. woglumi nymphs and adults, according to the characteristics presented by Nguyen et al. (2007), which was based on the insect morphological aspects.
The evaluations were done in the canopy north, south, east, and west quadrants, according to Dowell and Cherry (1981), observing mainly the new sprouts (place where the adults are usually found), and also the abaxial surface of the leaves, through detailed watching of each plant, from the bottom to the top of the plants, looking for all the immature phases of the pest, writing down (1) if it is present and (0) if it is absence. The live nymph evaluation was done in the field, using a magnifier. More detailed information can be found in Silva et al. (2011b).
From September 2008 to October 2009, 12 samplings were taken, in these specific dates: Sep/18/08, Oct/20/08, Nov/17/08, Dec/13/08, Jan/17/09, Feb/06/09, Mar/25/09, Apr/22/09, May/19/09, Jun/26/09, Jul/24/09, and Aug/16/09.
The Capitão Poço, PA, monthly average climatic data, such as precipitation (mm) and minimal, average, and maximum temperature (K) were obtained in the CITROPAR (Citros do Pará Company) meteorological station due its proximity to the experiment field (Silva et al. 2011b).
Data analysis. The spatial dependence analysis was done by geostatistics, following the methodology adopted by Farias et al. (2003). This methodology is based on the supposition that the closer the measures, the more similar they are, when compared to the farther measures.
Under the intrinsic hypothesis about stationary, the semivariance was calculated by the following equation:
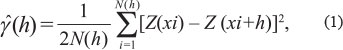
where:
N(h) is the number of pairs of measured values Z(xi) and Z(xi + h), separated by a vector h, which is the distance defined by the coordinates Z(xi) and Z(xi + h).
The ŷ(h) graphic is called experimental semivariogram.
From a mathematic model adjusted of the experimental semivariogram, the theoretical model variables estimative were obtained to the semivariogram (pure nugget effect, C0, baseline, C0+C1, and the reach, α).
All semivariogram results were obtained in the GS+ program (Robertson 1998). If there were doubt about the model used to the same semivariogram, the best R2 (coefficient of variation) was considered.
After modeling the experimental semivariogram, the infestation intensity values were estimated in non-sampled spots inside the field using as kriging interpolator (Equation 2). It is a weighted average of the neighbors that are inside the spatial dependence (a-reach) captured in the semivariogram modeling (Vieira et al. 1983).
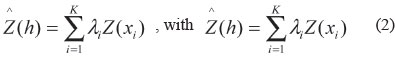
where:
Z(h) is the estimated value of the attribute Z;
λi are the xi position optimized neighbor point weights, based on the adjusted semivariogram parameters;
Z(xi) is the attribute Z in the position xi absolute value.
The kriging maps, or spatial distribution, were done using the program SURFER v.8. (Surfer 2009). The number of required evaluations of each month was calculated based on the coefficient of variation, using the formula described by Cline (1944) and based on the adjusted experimental semivariogram reach parameter.
Results and discussion
In the MPS the infestation intensity coefficient of variation (CV) of February and March were classified as moderate (12 % ≤ CV ≤ 24 %) according to Warrick and Nielsen (1980). In both systems evaluated all other months were classified as low (CV < 12 %). The CV statistic can be used to identify homogeneous places as well as to help in the sampling planning. The touted in the literature is that the number of samples has a positive relationship with CV (Table 1). However, the CV must be used only to infer the spatial variability due its lack of concrete data about the variance structure regarding the distance, that is, the relationship between two sampling points separated by an unspecific distance.
In the MPS, except for February, which the linear modelfitted the data, for all the other evaluations data of both systems, d the spherical and exponential models had a good fit. Soto et al. (2002) working with the aleyrodidae Aleurothrixus floccosus (Maskell), Dialeurodes citri (Ashmead) and Parabemisia myricae (Kuwana) spatial distribution, also founded the same model. Argov et al. (1999) studying the D. citri dispersion in citrus orchard in Israel observed that the pest spatial distribution was aggregated in all developing phases.
The adjusted model is important because from it it can be inferred the spatial continuity. The spherical model generally is associated with variables which distribution along the landscape is abrupt, while the exponential model is related with slight distributions, i.e., the transitions between different fields are not abrupt.
The spherical model was the one that better described the increase of number of plants infested with blackflies from September to November for both systems adopted (APS and MPS), indicating that the pest presents strong tendency to disseminate among the neighbor plants forming aggregations or patches (Table 1).
It can be noticed that the parameter C0, that is the sum of errors and includes the ideal number of samples, was low in the wet months, especially in March. The opposite happened in the dry season months, when Octuber presented the higher C0 values. It indicates that the pest spatial distribution models adjust error is higher in the dry season; therefore, sampling and model adjustment during this season requires more attention.
Except for February, November, and December, all other samplings in both systems presented the Spatial Dependence Grade (SDG) moderate, according to Cambardella et al. (1994) (Table 1). This result shows that in those months the control management should not be done, assuming an average infestation value for the whole area. The reach parameter confirms this result because the smaller reaches are related to the higher SDG values. The higher reach the smaller the variability and the more homogeneous the area is. Thus, the SDG provides an average to estimate how random samplings are. It was observed in the sampling dates that the values vary from 0.08 to 0.78 in the MPS (Table 1) and from 0.43 to 0.75 in the APS (Table 2), indicating a maximum variation of 78% in the blackfly survey, considering both systems. These results are in accordance to the ones recommended by Journel and Huijbregts (1978), affirming that values higher than 0.80 indicate that the studied phenomenon tends to randomness and that there is dependence among the samples.
The APS presented an average reach of 17 m through the total evaluation period, 14m in the rain season and 23m in the dry season. The MPS presented an average reach of 21m through the total evaluation period, 22m in the rain season and 22m to the dry season. It shows that during the dry season both systems present similar spatial variation. The reach parameter is used effectively to point out the sampling spacing. It shows that the ideal sampling system is the one that take into account the different seasons, and thatduring the dry season in both systems the spacing suggested based on the reach is about 22m (Table 1).
Based on the semivariogram reach parameter the suggested evaluations average throughout the year to the APS was 17 evaluations ha-1 and to the MPS seven evaluations ha-1. During the dry (from August to November) and wet (from January to May) seasons in MPS there is no difference in the number of evaluations, and seven evaluations ha-1 are enough. However in the APS during the wet season 12 evaluations ha-1 are enough, while 23 evaluations ha-1 are needed in the dry season (Table 2).
The figure 2 presents the citrus blackfly spatial distribution semivariogram in the MPS and APS, respectively. The coefficient of determination (R2) shows the theoretical to the experimental semivariogram model adjust quality. Values near to 1 mean that the adjustment is good. This fact can be observed in this work, where the amplitude ranges from 0.70 to 0.99 in the MPS and from 0.84 to 0.99 in the APS (Fig. 2).
In the Figures 3, 4, 5, and 6 the maps of citrus blackfly spatial distribution are presented. In September, the first evaluation date (Fig. 3), a higher infestation was observed in the APS, where 37% of the plants had citrus blackfly, against only 7% of infestation in the MPS, where only small patches were observed (Table 2 and Fig. 3).
Increasing infestations were observed in both planting systems from October to November, with peak of infested plants in the APS registered in November, 53%. The MPS presented a lower infestation, 43% (Table 2 and Fig. 3).
During the September, October, and November observations, a slight growth of the pest population was observed, as presented in the Kriging maps (Fig. 3). This increasing was probably due the low pluviometric index in those months - 26, 51, and 46 mm (Table 2), allied to the fact that no chemical control was used. A similar infestation growth pattern and low pluviometric precipitation were observed by Silva et al. (2011b) when they studied the citrus blackfly distribution, without chemical control.
In December, differently from the previous months, there was a reduction in the citrus blackfly presence in plants from both systems adopted, with 25% of the plants infested in the ASP and 29% in the MSP. December, April, and May were the months that MPS had higher number of plants with A. woglumi comparing to the APS. The Kriging map of December (Fig. 4) shows clearly the patches, justifying the spherical model presented to the citrus blackfly distribution in both systems.
In January a new increasing was presented in both fields, especially in the APS, where 50% of plants had citrus blackfly, this represents a 25% increase comparing to the anterior month (in December 25% of plants were with A. woglumi). The MPS the increase was only of 3% (in December 29% of plants had A. woglumi).
During the dry season (from September to December) in the Amazon Region the teak plants show wilting and high foliar senescence, this is probably associated with high citrus blackfly infestation in the APS in this period. The kriging map (Fig. 4) shows that the increasing number of plants with the pest in the MPS was mainly in the planting line, while to the APS was mainly in the 25th planting line, where the Teak plants were. Teak plants have high diameter andcanopy, what increases the shading and reduces the wind, possibly favoring a higher aggregation of the pest, which facilitates the maintenance and the increase of citrus blackfly in this field. This fact corroborates Rathore and Fellow (1995) and Rao et al. (2000).
A drastic decrease was observed in February, when 2% of plants had citrus blackfly in the MPS and 6% in the APS. This reduced number did not allow spatial dependence detection, occurring hence the phenomenon called pure nugget effect (Table 2 and Fig. 4), i.e., the pest was distributed in a randomized way in both systems (Table 1). The kriging was not done in February because there was not a spatial dependence characterized in the variographic analysis, because it was not detected a spatial continuity that justified the geostatistics application of the referred estimation.
The citrus blackfly spatial distribution visualization in February can be better seen through the Figure 4, where the red dots represent the places (plants) infested by the insect. Only 2% or 28 plants were infested in the MPS and 6% (100 plants) in the APS. This reduction of infestation is associated probably to a high pluviometric precipitation in January and February, which were 228 and 348 mm respectively. Flanders (1969) observed that strong winds along with heavy rains were able to remove and kill the adults of the pest. Medeiros et al. (2009) related that the A. woglumi population is highly reduced when heavy rains occur (high pluviometric precipitations).
March, despite being the higher precipitation month, 447 mm, it had a higher infestation index compared to February, when 12% and 3% of the plants were infested in the APS and in the MPS, respectively (Table 2). This increase allowed to detect the spatial dependence in both systems evaluated when the spherical model showed a better adjust (Table 2) as well as to detect the presence of small aggregations as can be seen in the Figure 5.
February and March presented a lower infested plant index when compared to the twelve evaluations done on both systems adopted. During this period a reduced nymph number was observed and the main factor responsible for the blackfly observation was the adults.
April and May characteristic was to have a high index of infested plants, just after a rainy period (from January to March). This increasing is related to a higher vegetative growth of the plants in this period in the Brazilian north region. Thus, the spherical model is justified in those months; where the plant grows intensively, and the pest develops in patches, in plants of citrus that offer better nutritional conditions to the citrus blackfly feeding, reproduction and oviposition.
There was a citrus blackfly reduction in the experimental fields in June and July, and APS always showed a higher infestation than the MPS (Fig. 6). In those months the MPS presented spatial-exponential distribution model, mainly due to the low population of the pest as well as due to the insect dissemination patternthat occured mainly in the first line plants.
The kriging maps of August (Fig. 6) presented a new infestation increase at both systems; the APS had 27% of plants infested while the MPS had 21%. Observing those data, it can be inferred that the pest population found again favorable development conditions.
In this study the kriging maps helped to assess that the pest has a strong tendency to infest the neighbor plant, forming patches that grow mainly in the planting line.
It is important to note that for this experimental field the APS presented a higher incidence of citrus blackfly than the MPS. The temperature influenced citrus blackfly population regulation. The number of infested plants by A. woglumi was reduced due to the high pluviometric precipitations, corroborating Silva et al. (2011b) study.
The citrus blackfly spatial distribution occurs mainly in groups with spatial dependence described by the spherical model, forming patches from 8.5 to 34 m (model detection) to both evaluated systems.
The pest presents strong tendency to infest the neighboring plants, forming aggregations or patches that expand mainly in the planting line for both evaluated systems.
In the Agroforestry Planting System the sampling spacing must have from 14 to 23 meters and the evaluations per hectare must range from 23 to 12, for wet and dry seasons, respectively. In the Monoculture Planting System the sampling spacing must have 22 meters, with 7 evaluations per hectare.
Acknowledgements
The authors are grateful to Conselho Nacional de Ciência e Tecnologia - CNPq by the Master of Science scholarship to the first author and for the productivity scholarship given to the second and fourth authors. We are also grateful to the Santana Farm owners situated in Capitão Poço, Pará State, Brazil for providing the experimental field to carry out this work.
Literature cited
ARGOV, Y.; ROSSLER, Y.; VOET, D. 1999. The biology and phenology of the citrus whitefly Dialeuredes citri, on citrus in the coastal plain of Israel. Entomologia Experimemtalis et Applicata 4 (1): 305-318. [ Links ]
BLACKSHAW, R. P.; VERNON, R. S. 2006. Spatio temporal stability of two beetle populations in non-farmed habitats in an agricultural landscape. Journal of Applied Ecology 43 (4): 680-689. [ Links ]
CAMBARDELLA, C. A.; MOORMAN, T. B.; NOVAK, J. M.; PARKIN, T. B.; KARLEN, D. L.; TURCO, R. F. KONOPKA, A. E. 1994. Field scale variability of soil properties in Central Iowa soils. Soil Science Society of America Journal 58 (4): 1501-1511. [ Links ]
CLINE, M. G. 1944. Principles of soil sampling. Soil Science 58 (4): 275-288. [ Links ]
DAL PRÁ, E.; GUEDES, J. V. C.; CHERMAN, M. A.; JUNG, A. H.; SILVA, S. J. P.; RIBAS, G. G. 2011. Uso da geoestatística para caracterização da distribuição espacial de larvas de Diloboderus abderus. Ciência Rural 41 (10): 1689-1694. [ Links ]
DINARDO-MIRANDA, L. L.; VASCONCELOS, A. C. M.; VIEIRA, S. R.; FRACASSO, J. V.; GREGO, C. R. 2007. Uso da geoestatística na avaliação da distribuição espacial de Mahanarva fimbriolata em cana-de-açúcar. Bragantia 66 (3): 449-455. [ Links ]
DOWELL, R. V.; CHERRY, R. H. 1981. Detection of, and sampling procedures for, the citrus blackfly in urban Southern Florida. Researches on Population Ecology 23 (1): 19-26. [ Links ]
EMBRAPA. 2006. Empresa Brasileira de Pesquisa Agropecuária. Centro Nacional de Pesquisa de Solos. Sistema Brasileiro de Classificação de Solos. Rio de Janeiro: Embrapa CNPS. 2006. 306 p. [ Links ]
FARIAS, P. R. S.; NOCITI, L. A. S.; BARBOSA, J. C.; PERECIN, D. 2003. Agricultura de precisão: mapeamento da produtividade em pomares de cítricos usando geoestatística. Revista Brasileira de Fruticultura 25 (2): 235-241. [ Links ]
FARIAS, P. R. S; BARBOSA, J. C.; BUSOLI, A. C.; OVERAL, W. L.; MIRANDA, V. S.; RIBEIRO, S. M. 2008. Spatial analysis of the distribution of Spodoptera frugiperda (Lepidoptera: Noctuidae) and losses in maize crop productivity using geostatistics. Neotropical Entomology 37 (3): 321-327. [ Links ]
FLANDERS, S. E. 1969. Observations on citrus blackfly parasites in India and Mexico and correlated circunstances. Canadian Entomologist 101: 467-480. [ Links ]
IBGE. 2013. Instituto Brasileiro de Geografia e Estatística. Estados, lavoura permanente. Available in: www.ibge.gov.br/estadosat/temas.php?sigla=pa&tema=lavourapermanente 2012. (Review date: 17 January 2013). [ Links ]
JOURNEL, A. G.; HUIJBREBTS, C. J. 1978. Mining geostatistics. London: Academic Press, London. 600 p. [ Links ]
KÖPPEN, W. 1948. Climatologia: con un estudio de lós climas de la tierra. México: Fundo de Cultura Econômica, 478 p. [ Links ]
MAPA, 2011. Ministério da Agricultura, Pecuária e Abastecimento. Lista de pragas quarentenárias presentes - (A2). (Ministério da Agricultura, Pecuária e Abastecimento. Lista de pragas quarentenárias presentes - (A2). Available in: http://www.agricultura.gov.br/legislacao/sislegis. (Review date: 23 December 2013). [ Links ]
Medeiros, F. R.; Lemos, R. N. S.; Ottati, A. L. T.; Araújo, J. R. G.; Machado, K. K.; Rodrigues, A. A. C. 2009. Dinâmica Populacional De Mosca-negra-dos-citros Aleurocanthus Woglumi Ashby (hemiptera: Aleyrodidae) Em Citrus Spp. No Município De São Luíz - Ma. Revista Brasileira De Fruticultura 31 (4): 1016-1021. [ Links ]
NGUYEN, R.; HAMON, A. B.; FASULO, T. R. 2007. Citrus blackfly, Aleurocanthus woglumi Ashby (Insecta: Hemiptera: Aleyrodidae). Gainsville: Institute of Food and Agricultural Sciences, University of Florida. p. 1-5. Available in: www.edis.ifas.ufl.edu. (Review date: 16 October 2010). [ Links ]
OKUMURA, M. 2007. Uso de geoestatística para aprimorar o controle de pragas na citricultura. Dissertação de Mestrado, Escola Politécnica, Universidade de São Paulo, São Paulo. 65 p. [ Links ]
PARKINSON, K.; SEALES, J. 2000. Citrus blackfly, its presence and management in Trinidad and Tobago. Procaribe News, Network. 11 p. [ Links ]
PENA, M. R.; SILVA, N. M. 2007. Sugadora negra. Revista Cultivar 7 (41): 16-18. [ Links ]
RAO, M.; SINGH, M.; DAY, R. 2000. Insect pest problems in tropical agroforestry systems: Contributory factors and strategies for management. Agroforestry Systems 50 (3): 243-277. [ Links ]
RATHORE, M. P.; FELLOW, S. V. 1995. Insect pests in agroforestry. Working Paper nº 70 report of a GTZ. [ Links ]
ROBERTSON, G. P. 1998. GS+ geostatistics for the environmental sciences: GS+ user's guide. Plainwell: Gamma Design Software, 1998. 152 p. [ Links ]
SILVA, A. G.; BOIÇA JUNIOR, A. L.; FARIAS, P. R. S.; RODRIGUES, N. E. L.; MONTEIRO, B. S.; SANTOS, N. A. 2011a. Influência de fatores abióticos na infestação de mosca-negra-dos-citros (Aleurocanthus woglumi Ashby) em plantio de citros em sistema agroflorestal no estado do Pará. EntomoBrasilis 4 (1): 01-06. [ Links ]
SILVA, A. G.; BOIÇA JUNIOR, A. L.; FARIAS, P. R. S.; BARBOSA, J. C. 2011b. Infestação da mosca-negra-dos-citros em pomares de citros em sistema de plantio convencional e agroflorestal. Revista Brasileira de Fruticultura 33 (1): 53-60. [ Links ]
SOTO, A.; OHLENSCHLÄEGER, F.; GARCÍA-MARÍ, F. 2002. Distribution and sampling of the whiteflies Aleurothrixus floccosus, Dialeurodes citri, and Parabemisia myricae (Homoptera: Aleyrodidae) in Citrus in Spain. Journal of Economic Entomology 95: (1) 167-173. [ Links ]
SURFER. 2009. Version 8.0. Apostila do curso básico de Surfer - versão 8.0. Surface Mapping System Copyright©, Golden Software. Available in: www.goldensoftware.com. (Review date: 08 November 2010). [ Links ]
TURECHEK, W. W.; MADDEN, L. V. 2000. Analysis of the association between the incidence of two spatially aggregated foliar diseases of strawberry. Phytopathology 90 (2): 157-170. [ Links ]
VIEIRA, S. R.; HATFIELD, T. L.; NIELSEN, D. R.; BIGGAR, J. W. 1983. Geostatistical theory and application to variability of some agronomical properties. Hilgardia 51 (3): 1-75. [ Links ]
WARRICK, A. W.; NIELSEN, D. R. 1980. Spatial variability of soil physical properties in the field. pp. 319-344. In: Hillel, D. (Ed.). Applications of soil physics. New York: Academic. [ Links ]
WEBSTER, R. 1973. Automatic soil-boundary location from transect data. Mathematical Geology 5 (1): 27-37. [ Links ]
XU, X. M.; RIDOUT, M. S. 2001. Effects of prevailing wind direction on spatial statitistics of plant disease epidemics. Journal Phytopathology 149 (2): 155-166. [ Links ]
Received: 8-May-2013
Accepted: 10-Aug-2014
