


Services on Demand
Journal
Article
 English (pdf)
 Article in xml format
 Article references
 Send this article by e-mail
Indicators
-
 Cited by SciELO
 -
 Access statistics
Related links
-
 Cited by Google
 -
 Similars in
SciELO
Similars in
SciELO -
 Similars in Google
Share

 Permalink
Revista Latinoamericana de Psicología
Print version ISSN 0120-0534
rev.latinoam.psicol. vol.41 no.2 Bogotá July/Dec. 2009
EFFECT OF SAMPLING FREQUENCY ON AUTOMATICALLY-GENERATED ACTIVITY AND FREEZING SCORES IN A PAVLOVIAN FEAR-CONDITIONING PREPARATION
EFECTO DE LA FRECUENCIA DE MUESTREO SOBRE LOS ÍNDICES AUTOMÁTICOS DE ACTIVIDAD Y CONGELAMIENTO EN UN PROCEDIMIENTO DE CONDICIONAMIENTO PAVLOVIANO DEL MIEDO.
Cristina Vargas-Irwin
Fundación Universitaria Konrad Lorenz, Bogotá, Colombia
Jaime R. Robles
Universidad Católica Andrés Bello, Caracas, Venezuela
Correspondencia: Cristina Vargas-Irwin cvargas@fukl.edu Fundación Universitaria Konrad Lorenz. Carrera 9ª bis No. 62-43. Bogotá, Colombia
Acknowledgements: This research was supported by a grant from the A.D. Williams foundation to the first autho
Abstract
Conditioned freezing has long held conceptual importance in behavior analysis, being pivotal in the explanation of anxiety-like behavior. Although initially measured indirectly, through its disruptive effect on operant behavior (conditioned suppression), and later by direct observation, automated techniques of measuring movement have recently become available, which also enable the measurement of conditioned freezing. These video processing techniques allow for the direct and virtually continuous measurement of activity, as compared to the traditional interval sampling approach of direct observation. We examined whether automatically generated freezing and movement scores were equally sensitive to traditional Pavlovian conditioning manipulations, and how this sensitivity was affected by the sampling frequency of the data. Extinction data for 42 mice were collected at a rate of 30 Hz, transformed via re-sampling and analyzed by a generalized linear model to determine the effect size for the presence of the conditioned stimulus for each individual time series under four conditions: high and low resolution raw activity scores and high and low resolution dichotomous freezing scores.The resolution of the data proved to be the most important dimension in estimating local changes in the level of the individual time-series, with activity and freezing scores presenting comparable effect sizes. In contrast with the above, only high-resolution activity measurements proved to be effective in detecting local changes in trends.
Key words: indexes, fear conditioning, freezing, generalized linear models, time series.
Resumen
La respuesta condicionada de congelamiento tiene importancia conceptual de larga data para el Análisis Conductual, siendo clave en la explicación de las conductas de ansiedad. Aún cuando inicialmente fue medida de forma indirecta, mediante sus efectos sobre la conducta operante (como en el arreglo de supresión condicionada) y más tarde mediante la observación directa, recientemente se han hecho disponibles alternativas para la medición automática del movimiento que permiten también la medición del congelamiento condicionado. Estas nuevas técnicas de video permiten la medición directa y virtualmente constante de la actividad del organismo, por contraposición a las técnicas tradicionales de muestreo de tiempo características del registro observacional. En el presente artículo se compara el efecto de manipulaciones pavlovianas tradicionales sobre la sensibilidad de los de los índices automatizados de congelamiento y actividad, así como el posible efecto de la densidad de muestreo sobre dicha sensibilidad. Para ello se analizan datos provenientes de sesiones de extinción pavloviana de 42 ratones, recogidos con una frecuencia 30 Hz y transformados mediante una técnica de remuestreo, para luego ser analizado mediante un modelo lineal generalizado, a fin de determinar la magnitud del efecto de la presencia del estímulo condicionado en cada una de cuatro condiciones: puntajes brutos de actividad de alta y baja resolución y puntajes dicotómicos de congelamiento de alta y baja resolución. La resolución de los datos mostró ser la dimensión más relevante para la estimación de cambios locales de nivel en las series temporales individuales, siendo dichos cambios igualmente fáciles de detectar en los índices de congelamiento y de actividad. A diferencia de lo anterior, sólo las medidas de actividad de alta resolución permitieron la detección de cambios locales de tendencia.
Palabras clave: ejecución motora, índices de movimiento, condicionamiento aversivo, congelamiento, modelos lineales generalizados, series temporales.
Fear conditioning has long been used as a model preparation both of anxiety related responses and of associative learning (Estes & Skinner, 1941; Fanselow & Poulos, 2005; Lifshitz, Witgen & Grady, 2007; Mineka & Oehlberg, 2008). In the typical fear conditioning procedure, an initially neutral stimulus (a conditioned stimulus, CS), is paired with an aversive stimulus, generally an electric shock; the response elicited by the CS is then considered to reflect conditioned fear. Immobility, a type of escape activity (Levin, 1997), is one of the conditioned responses commonly observed in rodents under these conditions, and is thought to reduce the chance to be detected by predators (Kiltie & Laine, 1992). Advances in our knowledge of the neural circuits involved in fear conditioning as well as its link to several psychopathological conditions such as phobias and posttraumatic stress disorder, have lead to a marked increase in the use of this experimental preparation: according to the Science Citation Index, the number of papers using this procedure has increased from an average of 3 per year in 1980-1982, to more than 228 per year in 2005-2007.
Traditionally, immobility (that is, the freezing response), has been measured by direct observation, where the absence of movement except that involved in breathing is taken as an instance of conditioned fear. This form of measurement is not only costly, but is also discontinuous, since it involves sampling the stream of behavior, usually in 5 to 10 s intervals. This procedure is prone to observational sampling error and has the inherent inaccuracy of assigning one of two states to the response outcome during the sample segments observed. An alternative way to measure the freezing response has been through conditioned suppression, that is, through the interruption of operant responding brought about by the presentation of the CS (Estes & Skinner, 1941). This alternative can provide a continuous indicator of conditioned freezing, yet some sort of discrete suppression ratio is generally calculated, where response rate during the CS is compared to the response rate in the absence of the CS. Although freezing is sufficient to bring about conditioned suppression, it is not necessary for its occurrence: under certain conditions, such as lesions to the periaqueductal gray (Amorapanth, Nader & LeDoux, 1999), conditioned suppression can occur in the absence of freezing. Nevertheless, the correlation of conditioned suppression and freezing is large enough in intact animals to infer considerable overlap between both processes (Bouton & Bolles, 1980; Mast, Blanchard & Blanchard, 1982). Recently, a third alternative for measuring freezing behavior has become commercially available: computer automated recording of activity. FreezeFrame©, by Coulbourn Instruments and VideoFreeze©, by Med Associates, constitute two of the most widely used systems to automatically record freezing behavior, but several noncommercial adaptations are also reported in the literature. All these systems combine video input with filtering algorithms to control for analogue noise, and produce and index which measures the animal's activity in arbitrary units (AU). Activity indexes falling below a predetermined threshold are taken to be indicative of freezing. The resulting measurements have proved to be highly correlated to those produced by human observers (Anagnostaras, Josselyn, Frankland & Silva, 2000; Kopec et al., 2007; Marchand, Luck & DiScala, 2003; Richmond et al., 1998), with computer-rater reliability R2s ranging from 0.92 to 0.99. These automated methods not only measure activity directly (as opposed to indirectly, through the suppression of on-going operant behavior), but they also measure behavior at sampling rates that for practical purposes are equivalent to a continuous-time measurement, with resolutions as high as 30 Hz. Beyond their high reliability indexes, the wide availability of these automated methods brings along a complex set of methodological and technical questions, two of which we intend to address in the present paper. First, we seek to assess the sensitivity of the raw activity index to theoretically relevant experimental manipulations, as compared to the traditional percent of freezing. We also seek to evaluate the effect of the sampling density on the sensitivity of activity and freezing indexes to local changes in the level and trend of behavior (Glass, Gottman & Willson, 1975).
Regarding the first of these questions (Are a raw activity indexes as sensitive to experimental manipulation as the traditionally used percent of freezing?), the use of an interval/ratio scale, such as that of the activity indexes, should result (in principle) in more statistical power than a dichotomous measure, such as the freezing response (Donner & Eliasziw, 1994). Nonetheless, automatically derived activity scores have shown to be less sensitive to manipulations of shock intensity than automated measurements of freezing in a context-conditioning preparation (Anagnostaras et al., 2000). This inferior sensitivity was interpreted by Anagnostaras and his collaborators not as a lack of reliability, but rather as a deficit in the validity of the activity index as a measurement of fear, resulting from a high degree of variability in baseline activity. We therefore sought to examine the sensitivity of the activity index in a within-subject manner, that is, in such a way as to derive estimations of effect size of experimental manipulations for each animal. Data derived from fear-conditioning experiments are rarely stationary and there is no reason to assume autocorrelation between the data points remains stable: therefore, according to recent advances in measurement theory, no pre-determined relationship exists between intraindividual variation and inter-individual variation (Molenaar, 2007; Molenaar, Sinclair, Rovine, Ram & Corneal, 2009). Two generalized linear models were thus fitted for the data generated by each mouse during an extinction session, using a dummy variable representing the presence/absence of the CS as an independent variable and either an automatically generated activity index or freezing index as a dependent variable (quantitative details are provided below. Extinction sessions provide a more impartial scenario in which to compare activity and freezing measurements than that of a conditioning session (since freezing is rarely observed during conditioning trials), while allowing the evaluation the most basic datum of conditioned responding: the difference between the presence and the absence of the CS.
As to our second question (How are differences between activity and freezing scores, if any, affected by sampling density?), we carried out the aforementioned analysis on data collected under the highest resolution allowed by the conditioning system (30 Hz, resulting in 57600 data points per subject) and also on a lower resolution sample of this data (closer to that used in direct observation studies), of one observation every 5 s. (that is, 0.2 Hz). Effect sizes (Rosenthal, Rubin & Rosnow, 2000) for these four conditions (high vs. low density sampling, freezing vs. activity indexes) were compared.
Method
Subjects
Subjects were 42 male naive ICR mice, 8 weeks old upon their arrival at the Virginia Commonwealth University vivarium. Mice were housed in groups of three or four and had ad-libitum access to food and water. Animals were allowed to acclimate to the VCU facilities for one week before the beginning of the experiment. Experimental sessions were conducted Monday-Friday during the light phase of a 12-h/12-h light/dark cycle (lights on at 0700 hours to 1900 hours). All procedures were carried out according to the "Guide for the Care and Use of Laboratory Animals" (Institute of Laboratory Animal Resources (U.S.) & NetLibrary Inc., 1996), and approved by the IACUC of Virginia Commonwealth University.
Apparatus
Seven identical fear-conditioning systems (Med Associates, Albany, VT) were used throughout the experiment. Each conditioning boxes was 24 à 30.5 à 29 cm, with a Plexiglas front, aluminum side walls (with a speaker mounted at the top and center of the left wall), and a white vinyl back wall. A grid floor was used during the fear conditioning session and a white, smooth Plexiglas floor was used during the extinction session. During extinction, a black A-shaped plastic frame was used to change the shape of the chamber. Conditioning boxes were housed within sound-attenuated chambers, where a near-infrared camera was mounted on the front side. The chambers were illuminated by near-infrared lights throughout all sessions and by a white light during the extinction session. Grid floors were washed with soap and water between animals and the walls of the conditioning chambers were cleaned with disinfectant wipes (Fresh Scented® for conditioning sessions, Lemon Scented® for extinction sessions). All sessions were recorded and movement indexes were automatically calculated by the Video-Freeze© (Med Associates, Albany, VT) software in real time, at a rate of 30 frames/data points per second.
Procedure
Animals were brought into the laboratory in groups of 7, were weighed and allowed to acclimate for 40 min. to the lab setting before the beginning of each session. Conditioning sessions lasted 7 minutes, and consisted of a 120 s. baseline, followed by 3 CS-US pairings, with an inter-trial interval (ITI) of 90 s. The CS was a 20 s 80 dB white noise (as measured at floor level from the center of the conditioning box). The US, which co-terminated with the CS, was a 2 s. 0.7 mA scrambled foot-shock, delivered through the grid floor. 24 hrs after the conditioning session, each animal received one extinction session, which consisted of a 120 s. baseline followed by 20 CS presentations, with a 10 s. ITI. No stimulus changes were programmed for the following 9.5 min, which were then followed by an additional train of 20 CS. Data presented here correspond to the extinction session.
Data management and analysis
The high resolution measure was a quantitative activity index, automatically generated by the VideoFreeze© software at a rate of 30 Hz, and constitutes the base measurement from which the three remaining indexes were generated.
A second quantitative measure of the response was obtained by resampling (applying a convolution filter) the high resolution measure, lowering the resolution to a rate of 0.2 Hz (1 observation each 5 seconds), resulting in the low resolution activity index measure. To mimic the observational procedure which is often used to obtain a binary measurement of the freezing response via direct observation, a linear filter was applied to both high and low resolution activity index series, producing high and low resolution binary freezing estimate, respectively.
The linear filter to transform the activity index into a binary freezing classification may be expressed as:
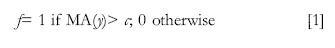
Where fb is the freezing estimate for bin b (from time t to t+k), y is the activity index, MA is the moving average operator, and c is the threshold to establish absence of significant movement. The MA moving window was set to 1 second, and the threshold c was set to an arbitrary value that generated two distinctive images in the digital video file.
The filter described in Equation [1] intends to produce results similar to those generated by traditional observational procedures, in which movement is observed at discrete intervals and classified as presence or absence of freezing by an observer. In non-quantitative terms, the linear filter classifies an observation as an instance of freezing if the movement index falls below a certain measure and does so for a predetermined length of time, in this case, of at least one second. Both the re-sampling at lower resolution and the linear filter may be considered smoothing operations of the high-resolution continuous activity index series (the base measurement).
The analysis of a high-resolution time series of the activity index may be accomplished by several models, including frequency domain models, multivariate autoregressive models, error-correction regression models, nonlinear time series, and oscillator neural networks, among others. However, our purpose was to find a common metric in which to compare the quantitative measure of movement with results from the analysis of the binary classification of the freezing response. In consequence, the priority in choosing the data analysis procedure was the comparability of the continuous measure and binary results, even at different resolutions. On the other hand, the chosen strategy, Interrupted Time Series analysis (ITS) via segmented or discontinued regression is a well known and tested analysis framework in behavioral research (Huitema, 1998; Vargas-Irwin, 1999).
To compare the four different indexes, we estimated the effect of the presence of the CS over the response using ITS, estimating the parameters using Generalized Linear Model (GLM) (McCullagh & Nelder, 1989).
For each freezing measure, an ITS segmented regression model was fitted with the following model specification:
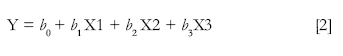
Where Y is the response measure from t0 to tn, t0 being the beginning of the session and tn the final time point of the session. Parameter b0 is the intercept, X1 is a dummy variable indicating the presence of the CS, with value 1 when the CS is present and 0 otherwise, X2 is assigned a linear polynomial value proportional to the value of time when the CS is present, and 0 otherwise. X3 is a linear polynomial increasing from t0 to tn. Given this specification, b1 is the parameter estimate for the average effect of the CS on the level of the series, b2 indicates the average local change in trend associated with the presence of the CS and b3 represents the global trend, from the beginning to the end of the session. Equation [2] corresponds to a standard ITS specification.
In terms of GLM parameter estimation, the response is represented by g(Y), where g is a function involving an exponential family distribution and a link function. This representation allows the treatment of both kinds of measures (activity index and binary freezing classification) within the same modeling framework. For the activity index, a gaussian reference distribution with identity link function was used; and a binomial distribution with log link function was used for the binary freezing classification.
Using GLM representation, test statistics for b1, b2, and b3 were obtained for the four measures of the response. To obtain a more standard and comparable measure of the effect across the different models, an effect size measure was estimated from the GLM results.
All effect size measures were computed as standardized mean differences d, to ensure a common metric and comparability (Cohen, 1988). To estimate d from regression effects, we used the following expression:
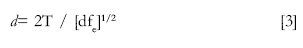
Where T is the test statistic associated with the regression effect (GLM parameter estimate), and dfe are the degrees of freedom of the error mean square. The value of d is in standard deviation units, which means that a d=1 indicates an effect producing a difference of 1 standard deviation in the outcome. In this case, d is interpreted as a within-subject effect-size measure (Parker & Hagan-Burke, 2007).
For each within-session series (corresponding to each animal), a model was fitted for the 4 alternative response measures, giving a grand total of 168 (42x4) GLM results. Given that each subject generated 30 data points per second, each time series of 32 min consisted of 57600 data points. Recording and preprocessing the 42 withinsubject series, applying the filters and fitting the 168 GLMITS equations, involved complex computer-intensive procedures, required specialized software for data management and computational processing. A set of computational software tools developed by the authors in C, Java and Python programming languages were employed, based upon previous computational software components (Robles, 1996, 2005).
Results
Average results for the high resolution measurements are presented in Figure 1. Both the activity index (panel A) and the binary freezing index (panel B) were able to discriminate between the presence and absence on the CS on a local level, that is, between the average performance in each presentation on the CS and the intertrial interval.
Figure 1 (A) shows how the activity index peaks at the beginning of the session, and exhibits a decreasing trend throughout the baseline period. On the other hand, the freezing index (Fig. 1 B) shows no discernible trend. The introduction of the CS produced a sharp drop in the level of the activity index series, which is also reflected in the peaking of the freezing index: both types of data showed a sharp contrast between the baseline and the fist train of extinction trials. Within this first extinction phase the presence of the CS and the inter-trial intervals are clearly differentiated by both indexes, hence the saw-tooth pattern of both series. For the activity index, an upward trend is present throughout this phase of the session, which is mirrored by a decreasing trend in the activity scores. This slow increase in activity and decrease in freezing reflects the progressive extinction of the CS. Between the two trains of extinction trials both the activity index and the freezing scores exhibit clear changes in the level of the series, corresponding respectively to an increase in activity and almost a complete lack of freezing. Nonetheless, as was the case with the baseline and the fist trend of extinction trials, only the activity index exhibits a reversal in the trend: while the first train of extinction trials showed and ascending trend, this inter-train phase shows a decreasing trend. The same pattern is observed when extinction trials are re-started, since both indexes show clear changes in the level of the series, but only the activity index exhibits a reversal in the trend. For both indexes, though, higher levels of conditioned responding are evident during the second train of extinction trials in comparison to the first one, which may be interpreted as within-session spontaneous recovery.
These results illustrate how activity and freezing indexes are differentially sensitive to dynamic changes in 2.2e-16 for the AI, and t (1,41)= 9.86, p = 2.194e-12 for the binary freezing index. As to the description of local trends within each presentation of the CS and ITI, only the AI resulted in non-negligible average effect sizes, which were significantly greater (in absolute value) than those for the freezing index, both for the high resolution (t (1,41)= 2.92, p = 0.005) and low resolution conditions (t (1,41)= 5.11, p = 7.81e-06). For the AI, effect sizes under high resolution sampling were also significantly greater than those of the low resolution condition (t = 5.15(1,41), p-value = 6.937e-06).
Discussion
The present results show how computer-generated scores obtained by automated video processing can constitute valid dependent variables in fear-conditioning preparations. Although evidence in this respect has been accumulating in recent years (Anagnostaras et al., 2000; Kopec et al., 2007; Marchand et al., 2003), this constitutes, to our knowledge, the first test of the sensitivity of these measurements to within-subject data analysis.
When controlling for the global properties of each individual time series, both the interval/ratio measure of activity and the binary measurement of freezing proved to be equally effective in detecting changes in level brought about by the presence of the CS. In assessing individual changes in the level of responding, the most important dimension is therefore not whether the index used is dichotomous or not, but rather the density of the observations: the more frequent the observations, the greater the effect sizes observed. Since the effect size measures correct for differences in sample size (Rosenthal et al., 2000), this differential sensitivity cannot be regarded as a statistical artifact. Non-automated observational recording of the freezing response usually entails low frequency measures such as the one used here. Therefore, non-automated recording will likely result in smaller effect sizes than high-frequency automatic recording.
These results contrast with those reported by Anaganostaras et al. (2000), who found the dichotomous freezing index to be more sensitive than the activity measure in the detection of the magnitude of shock used during conditioning. Several factors may contribute to this difference. On one hand, Anagnostaras' results constitute a between subject comparison, which makes them more vulnerable to individual differences in baseline activity. Furthermore, unlike the time-series GLM modeling carried out here, Anagnostaras' analysis didn't take into account the global trend and level of the series. Finally, our independent variables were different: while we assessed the effect of the presence/absence of the CS, they evaluated the sensitivity to the magnitude of the unconditioned stimulus.
Even though the continuous/dichotomous distinction was not relevant when determining the level of the time series, it did result in differential sensitivity when assessing trends. Visual inspection of the data series averaged for the 42 subjects (Figure 1), shows how the activity index reveals within-series trends that are absent in the freezing index data: activity is at its maximum at the beginning of the session, decreasing sharply during the initial stimulusfree baseline. The introduction of the first CS train brings about an abrupt decrease in the level of the series, but most importantly, a reversal of the trend, with an increase in activity with the successive presentations of the CS. Since decreased activity signals the conditioned fear response, its increase, in the present setting, accurately depicts the extinction of conditioned responding (Rescorla, 2001); this reversal in the trend can also be observed for the second train of CSs. In contrast with this, the decrease in the freezing index is much less conspicuous. On a smaller scale, that is, when analyzing within-CS and ITI trends, only the continuous, highresolution measure proved to be sensitive enough to detect dynamic changes.
In general, binary measures analyzed via GLM with binomial and log-link function tend to evaluate drastic, long lasting changes, while the subtleties of local variations which characterize the dynamic of the organism activity usually go undetected. In this sense, binary measures and their quantitative modeling may produce an artificially "clean" pattern, and when accompanied by low resolution sampling, tend to favor "neat" or "average" patterns instead of local variations.
The main finding of this research was that binary, low-resolution measures of freezing can differ drastically from continuous high-resolution measures of activity, both in their global parameters (level) and in the more complex dynamic properties such as local trends. Effect size differences can follow a less than predictable pattern when binary, low resolution measure are used, thus requiring increased caution for the interpretation of traditional timesampled data.
The increased resolution brought about by the automated scoring of behavior under fear conditioning preparations is due to impact our conception of this phenomenon, as theoretical and technological aspects of a scientific discipline are in constant reciprocal interaction or co-evolution (Lattal, 2008). The availability of a continuous measure of activity allows for the analysis of experimental settings where the freezing response is rarely observed, such as fear-conditioning acquisition sessions. Furthermore, high-resolution measures of conditioned responding will now permit a more stringent evaluation of time-based (as opposed to trial-based) models of pavlovian conditioning (Church, 1997; Larrauri & Schmajuk, 2008; Wagner, 2008).
References
Amorapanth, P., Nader, K., & LeDoux, J. E. (1999). Lesions of periaqueductal gray dissociateconditioned freezing from conditioned suppression behavior in rats. Learning & Memory, 6(5), 491-499. [ Links ] [ Links ]
Bouton, M. E., & Bolles, R. C. (1980). Conditioned fear assessed by freezing and by the suppression of 3 different baselines. Animal Learning & Behavior, 8(3), 429-434. [ Links ]
Church, R. M. (1997). Quantitative models of animal learning and cognition. Journal of Experimental Psychology-Animal Behavior Processes, 23(4), 379-389. [ Links ]
Cohen, J. (1988). Statistical power analysis for the behavioral sciences (2nd ed.). Hillsdale, N.J.: L. Erlbaum Associates. [ Links ]
Donner, A. & Eliasziw, M. (1994). Statistical implications of the choice between a dichotomous or continuous trait in studies of interobserver agreement. [note]. Biometrics, 50(2), 550-555. [ Links ]
Estes, W. K. & Skinner, B. F. (1941). Some quantitative properties of anxiety. Journal of Experimental Psychology, 29, 10. [ Links ]
Fanselow, M. S. & Poulos, A. M. (2005). The neuroscience of mammalian associative learning. Annual Review of Psychology, 56, 207-234. [ Links ]
Glass, G. V., Gottman, J. M. & Willson, V. L. (1975). Design and analysis of time-series experiments. Boulder: Colorado Associated University Press. [ Links ]
Huitema, B. E. (1998). Autocorrelation in least-square intervention models. Psychological Methods, 3, 104- 116. [ Links ] [ Links ]
Kiltie, R. A., & Laine, A. F. (1992). Visual textures, machine vision and animal camouflage. Trends in Ecology & Evolution, 7(5), 163-167. [ Links ]
Kopec, C. D., Kessels, H., Bush, D. E. A., Cain, C. K., LeDoux, J. E. & Malinow, R. (2007). A robust automated method to analyze rodent motion during fear conditioning. [Article]. Neuropharmacology, 52(1), 228-233. [ Links ]
Larrauri, J. A., & Schmajuk, N. A. (2008). Attentional, associative, and configural mechanisms in extinction. Psychological Review, 115(3), 640-676. [ Links ]
Lattal, K. A. (2008). JEAB at 50: Coevolution of research and technology. [Editorial Material]. Journal of the Experimental Analysis of Behavior, 89(1), 129-135. [ Links ]
Levin, L. E. (1997). Kinetic dialogs in predator-prey recognition. Behavioural Processes, 40(2), 113-120. [ Links ]
Lifshitz, J., Witgen, B. M. & Grady, M. S. (2007). Acute cognitive impairment after lateral fluid percussion brain injury recovers by 1 month: Evaluation by conditioned fear response. Behavioural Brain Research, 177(2), 347-357. [ Links ]
Marchand, A. R., Luck, D. & DiScala, G. (2003). Evaluation of an improved automated analysis of freezing behaviour in rats and its use in trace fear conditioning. [Article]. Journal of Neuroscience Methods, 126(2), 145-153. [ Links ]
Mast, M., Blanchard, R. J. & Blanchard, D. C. (1982). The relationship of freezing and response suppression in a cer situation. Psychological Record, 32(2), 151-167. [ Links ]
McCullagh, P. & Nelder, J. A. (1989). Generalized linear models (2nd ed.). London ; New York: Chapman and Hall. [ Links ]
Mineka, S. & Oehlberg, K. (2008). The relevance of recent developments in classical conditioning to understanding the etiology and maintenance of anxiety disorders. Acta Psychologica, 127(3), 567-580. [ Links ]
Molenaar, P. (2007). Psychological methodology will change profoundly due to the necessity to focus on intra-individual variation. Integr Psychol Behav Sci, 41(1), 35-40; discussion 75-82. [ Links ]
Molenaar, P., Sinclair, K., Rovine, M., Ram, N. & Corneal, S. (2009). Analyzing developmental processes on an individual level using nonstationary time series modeling. Dev Psychol, 45(1), 260-271. [ Links ]
Parker, R. & Hagan-Burke, S. (2007). Useful effect size interpretations for single case research. Behav Ther, 38(1), 95-105. [ Links ]
Rescorla, R. A. (2001). Are associative changes in acquisition and extinction negatively accelerated? Journal of Experimental Psychology-Animal Behavior Processes, 27(4), 307-315. [ Links ]
Richmond, M. A., Murphy, C. A., Pouzet, B., Schmid, P., Rawlins, J. N. P. & Feldon, J. (1998). A computer controlled analysis of freezing behaviour. [Article]. Journal of Neuroscience Methods, 86(1), 91-99. [ Links ]
Robles, J. (1996). PRS: Polytomous response simulator - Polytomous item generation according to the common factor model. Applied Psychological Measurement, 20(2), 140. [ Links ]
Robles, J. (2005). EVO-LD: A Model Discovery strategy for linkage disequilibrium studies with large databases. American Journal Of Medical Genetics Part B Neuropsychiatric Genetics, 138B(1), 143. [ Links ]
Rosenthal, R., Rubin, D. B. & Rosnow, R. L. (2000). Contrasts and effect sizes in behavioral research : a correlational approach. Cambridge, U.K. ; New York, EE.UU.: Cambridge University Press. [ Links ]
Vargas-Irwin, C. (1999). Consideraciones sobre el análisis estadístico en los diseños conductuales. In A. L. Rangel, L. M. Sánchez, M. Lozada & C. Silva (Eds.), Contribuciones a la Psicología en Venezuela (Vol. III): Facultad de Humanidades y Educación - UCV. [ Links ]
Wagner, A. R. (2008). Evolution of an elemental theory of Pavlovian conditioning. Learning & Behavior, 36(3), 253-265. [ Links ]
Recibido: febrero de 2009.
Aceptado: junio de 2009

