


Services on Demand
Journal
Article
 English (pdf)
 Article in xml format
 Article references
 Send this article by e-mail
Indicators
-
 Cited by SciELO
 -
 Access statistics
Related links
-
 Cited by Google
 -
 Similars in
SciELO
Similars in
SciELO -
 Similars in Google
Share

 Permalink
Revista Latinoamericana de Psicología
Print version ISSN 0120-0534
rev.latinoam.psicol. vol.43 no.1 Bogotá Jan. 2011
EL MUNDO DE LA PSICOLOGÍA
Software for Computing the Tetrachoric Correlation Coefficient
Software para el Cómputo del Coeficiente de Correlación Tetracórico
Rubén Daniel Ledesma
CONICET/Universidad Nacional de Mar del Plata; Argentina
Guillermo Macbeth
CONICET-Universidad del Salvador, Argentina
Pedro Valero-Mora
Universidad de Valencia, España
Correspondencia:rdledesma@gmail.com; guimacbeth@hotmail.com; valerop@uv.es
Nota: Este trabajo fue realizado con el apoyo de CONICET, Universidad Nacional de Mar del Plata y la Universidad de Valencia
Abstract
Tetrachoric correlation is a special case of analysis of the statistical covariation between two variables measured on a dichotomous scale, but assuming an underlying bivariate normal distribution. Computation of tetrachoric correlation is not straightforward and is usually not available in standard statistical packages. This paper introduces ViSta-Tetrachor, a plug-in for the statistical package ViSta that computes the tetrachoric correlation using an approximation that has shown to be both accurate and simpler to compute than the original algorithm. Additionally, ViSta-Tetrachor provides point and interval estimates for this statistic. Such feature is very uncommonly found in standard statistical packages. ViSta-Tetrachor also allows for computing tetrachoric correlation matrices that can subsequently be analyzed with the ViSta's Factor Analysis module. A brief description of the software is presented with several worked examples.
Key words: statistical software; tetrachoric correlation; approximation; point estimate; interval estimate
Resumen
Despite the growing number of people in Spain who organize their lives to prepare and participate in marathons, being compelled to make many sacrifices, there are no specific studies in Spanish on the reasons that lead them to do so. The purpose of this instrumental paper was to validate in Spanish language and with a Spanish population the Motivations of Marathoners Scales (MOMS). To this end, we conducted two independent studies. The aim of the first was to present the first preliminary psychometric data (pilot sample of 174 marathon runners). Once completed the process of translation, adaptation and content validity of items, we conducted statistical analyses to explore the dimensional structure and determine the reliability of the instrument. The aim of the second study (sample of 975 marathon runners), was to analyze the internal structure of the instrument with confirmatory procedures. The Spanish version of the MOMS showed acceptable levels of internal consistency, temporal stability, and correlations between the subscales, confirming the construct validity. We observed differences based on gender and age. These findings support the use of the Spanish version of the MOMS to assess individual differences in motivation to run.
Palabras clave: programa estadístico; ViSta; correlación tetracórica; método de aproximación; estimación puntual; estimación por intervalos
The tetrachoric correlation coefficient (Pearson, 1900) estimates the relationship between two dichotomous variables assuming an underlying bivariate normal distribution. An example of such variables is a pair of True/False test items in an achievement test. The tetrachoric coefficient is potentially applicable to many situations and plays a key role in some important analysis, such as the Factor Analysis of binary items or the inter-rater agreement measurement.
Because of its usefulness, tetrachoric correlation is often discussed in introductory Psychometric handbooks but, however, as mentioned by Bonett and Price (2005), most of them treat it rather superficially, presenting it merely as a descriptive statistic and neglecting its inferential aspects. Indeed, a reason for this inattention probably stems from the computational complexity of the algorithm that makes rather difficult calculating it manually and the limitations of the standard statistical programs in relation with it.
Among the few software packages that include the tetrachoric correlation, there are some that are not very student-friendly (e.g., functions in R), or others that perform inefficient computations. Thus, Stata gives their users a function based on a work by Edwards and Edwards (1984), that is basically "a very rough approximation" and is consequently unsuitable for many applications (Uebersax, 2006). SPSS does not include an option for estimating the tetrachoric correlation, but Enzmann (2007) developed a macro (r_tetra) that estimates the coefficient and its statistical significance. The previous programs share the disadvantage of its high price, which can be an important deterrent for being used in educational contexts, but they have the advantage to provide many more analysis and techniques apart from tetrachoric correlation. Free programs for tetrachoric correlation do exist, but they tend to be stand alone programs such as TetMat and Tcorr (Uebersax, 2006), something that can be a very important limitation in practice at the classroom.
This paper introduces and describes the ViSta-Tetrachor software, a tool for computing the tetrachoric correlation coefficient in an easy and efficient way. Among the different computation methods that have been put forward for estimating the tetrachoric correlation coefficient, our program implements the one proposed by Bonett & Price (2005). These authors introduced an accurate and computationally simple approximation for deriving the standard error, confidence intervals and sample size planning. A brief description of the approximation to point and interval estimates is presented in Appendixes A and B and further technical details can be found in Bonett & Price (2005). The present contribution focuses only on the software implementation of the statistic because this coefficient has been thoroughly described in many textbooks (e.g. Sheskin, 2007).
The paper has two sections. In the first section we briefly describe the main features of our software. In the second, we provide several examples that illustrate how the software works with different types of data. The last example shows a more advanced application in Psychology: performing a factor analysis of a matrix of tetrachoric correlations. We close the paper with some concluding remarks.
The ViSta-Tetrachor plug-in
ViSta-Tetrachor was developed as a plug-in for ViSta "The Visual Statistics System" (Young, 1996). ViSta is a free and expandable statistical system for data analysis and visualization created by Professor Forrest W. Young at the L. L. Thurstone Psychometric Laboratory (University of North Carolina, at Chapel Hill). ViSta was designed for students and novice users and is the result of many years of experience in the teaching of quantitative methods for psychology. A detailed exposition of this statistical system may be found in Young, Valero-Mora & Friendly (2006).
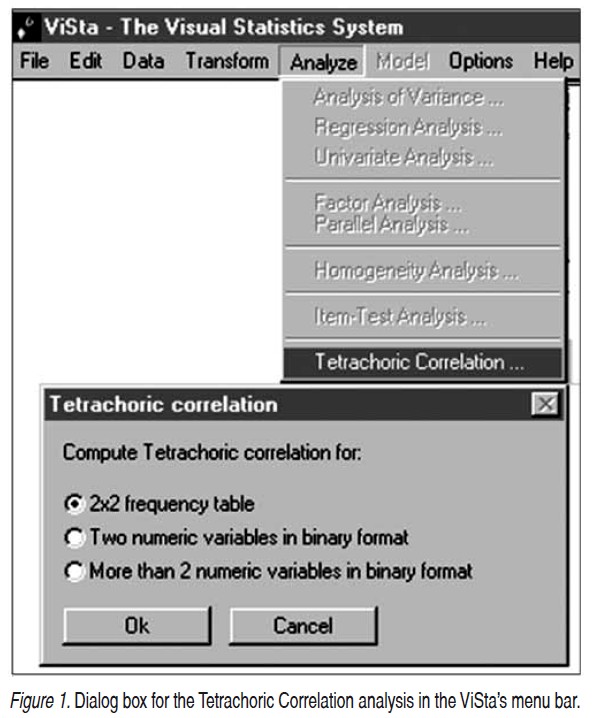
The ViSta-Tetrachor program requires ViSta 6.4 is available at: http://forrest.psych.unc.edu/. Once ViSta is installed, the user can add the "Tetrachoric Correlation" option by running the 'ViSta-Tetrachor.exe' file, which is also freely available at: http://www.mdp.edu.ar/psicologia/vista/vista.htm. After installation, a new analysis option should appear in the ViSta's menu bar (Figure 1). If a suitable data file is opened, the new "Tetrachoric Correlation" item is highlighted and ready to use.
Examples and Application Screenshots
The tetrachoric correlation in ViSta can be applied in different ways. We can compute it from: i) a 2x2 frequency table; ii) a raw data-set and; iii) a specific function built up by the user. In the third case the command-line interface of ViSta is used to assign frequency values as arguments.
The tetrachoric correlation in ViSta can be applied in different ways. We can compute it from: i) a 2x2 frequency table; ii) a raw data-set and; iii) a specific function built up by the user. In the third case the command-line interface of ViSta is used to assign frequency values as arguments.
Example 1. 2x2 frequency table
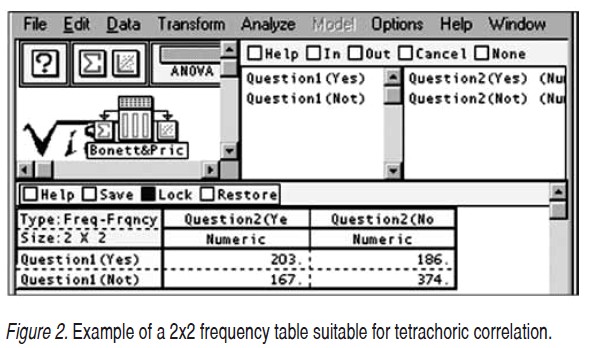
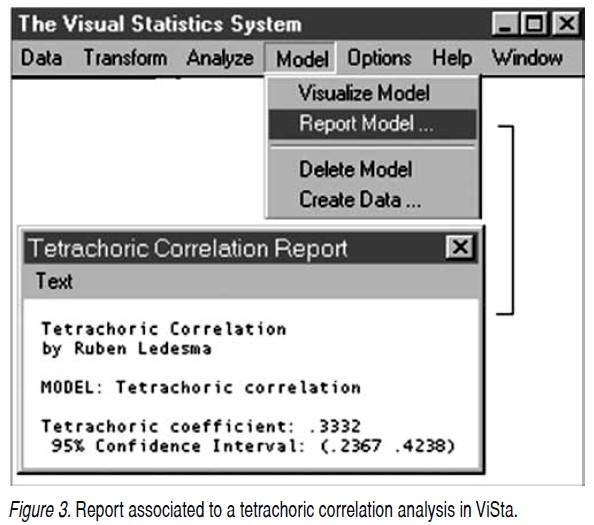
The data file named 'Data1.lsp' contains a 2x2 table with the first example presented by Bonett & Price (2005). These data are taken from Guilford and Fruchter (1973), who reported a 2x2 table for two questions in a personality inventory in which respondents answered either Yes or No to each question (Figure 2). This is a scenario where application of the tetrachoric correlation coefficient is usually recommended. The analysis can be performed by clicking on the corresponding item in the 'Analyze' menu, and then selecting the option "2x2 Frequency Data" (Figure 1). To see the result of the analysis, the user might go to the 'Model' menu bar item and click on the 'Report Model' option with the result of a statistical report as displayed in Figure 3. The reported tetrachoric correlation coefficient for the example data is .333 (95% CI: .237, .424), which indicates a low positive correlation between both items.
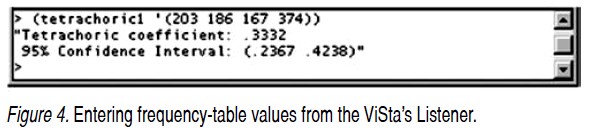
The tetrachoric correlation coefficient can also be calculated from the ViSta's listener by directly typing the frequency values of a given table. For the previous example, we would write: (tetrachoric1 '(203 186 167 374)). Figure 4 shows this expression and the result generated in the ViSta's Listener-window.
Example 2. Bivariate Raw Data
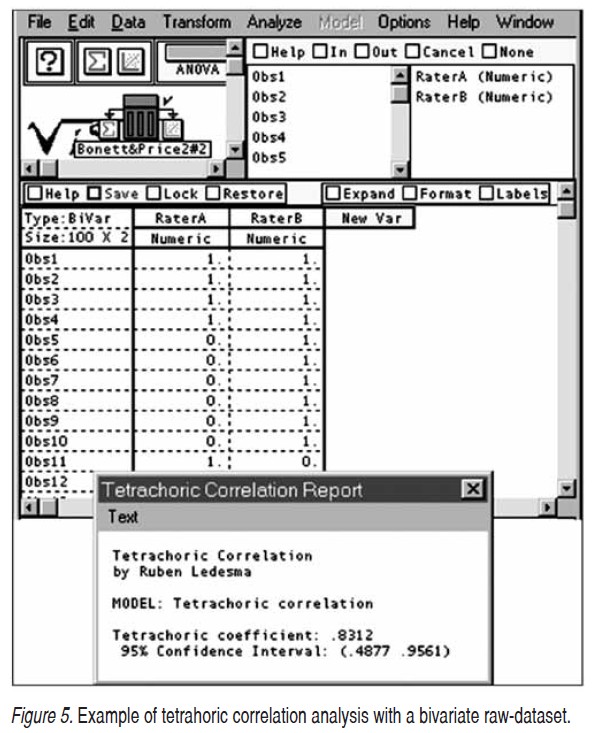
The tetrachoric correlation coefficient can also be used as a measure of inter-rater agreement, for the situation when there are two raters that classify subjects in two categories (Bonett & Price, 2005; Uebersax, 2006). Notice that Cohen's kappa is often associated to that scenario even though there are sufficient reasons (e.g., Cicchetti & Feinstein, 1990; Feinstein & Cicchetti, 1990) for using the tetrachoric correlation instead (e.g., Bonett & Price, 2005; Hutchinson, 1993).
The second example by Bonett & Price (2005) illustrates the use of the Tetrachoric correlation coefficient as a measure of inter-rater agreement. The File named 'Data2. lsp' contains the example in 'raw data' format (Figure 5). These data were obtained from Fleiss (1981, p. 213) and contain an example where 100 patients were classified into Neurosis (1) or Other (0) disorders categories by two raters. Computing the tetrachoric correlation is performed as in the previous example, but selecting the option named "Two Numeric Variables in Binary Format" instead (see Figure 1). Bonett and Price (2005, p. 22) noted that "SPSS gives an estimate of kappa equal to .50 (95%CI: .184, .816), which is much too wide to be of any value". Use of the tetrachoric correlation outputs .831 (95% CI: .488, .956), "which is not nearly as wide as the confidence interval for kappa" (Bonett & Price, 2005, p. 22).
Example 3. A Multivariate Raw Dataset
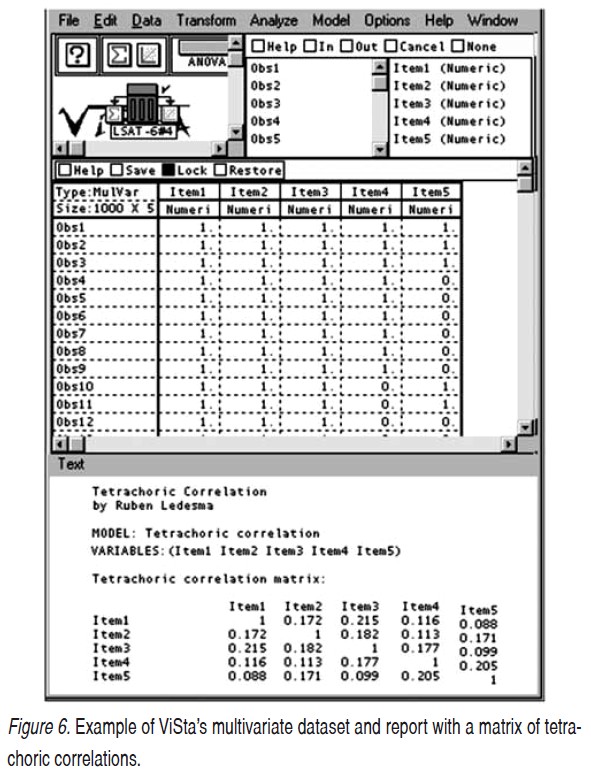
Given several variables, ViSta-Tetrachor may output all tetrachoric pairwise correlations and report them as a matrix. This requires a ViSta's multivariate data file (i.e., more than two binary variables in numeric format) as input. The file named 'Data3.lsp', which contains the LSAT-6 data provided by Bock and Lieberman (1970), is an example of a dataset of this type (see Figure 6). Responses from 1000 examinees to five items of the LSAT (Law School Admission Test), where 1 indicates a correct answer, and 0 represents an incorrect response, are the column variables. Obtaining the matrix of tetrachoric correlations is attained choosing "More than two numeric variables in binary format" Figure 1) and clicking "OK". ViSta will produce a Report as shown in see Figure 6.
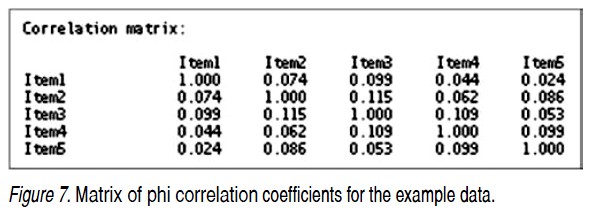
Notice that this matrix is very different than the Pearson's correlations matrix displayed in Figure 8 (equivalent to the Phi coefficients). As stated by several authors, tetrachoric correlation is better at this case because it does not depend on the table margins or the pattern of difficultness of the items (see for example Kubinger, 2003).
Example 4. Factorizing a matrix of tetrachoric correlations
Besides the three previous cases presented above, there is still a fourth way of applying the tetrachoric correlation analysis in ViSta. Thus, inside the Exploratory Factor Analysis module of ViSta the user may opt between using a Pearson correlations matrix or a tetrachoric correlations matrix as input for the analysis. As using tetrachoric correlations option is often recommended for analyzing the dimensionality of binary data (Lord & Novick, 1968), it is certainly hard to believe that commercial programs like SPSS do not offer this option as, in practice, EFA may produce substantially different results (e.g., Kubinger, 2003). As a demonstration, Table 1 shows the factorial loadings of two EFAs for the dataset in example 3 with very different results in each case.
ViSta allows carrying out the factor analysis in an easy way. Figure 8 shows the user interface, an example of numerical output and a partial visual representation of a Factor Analysis obtained from a tetrachoric correlations matrix. This example illustrates the user-friendliness of the ViSta-Tetrachor software and its educational applicability in teaching statistics.
Conclusions
Although tetrachoric correlation analysis is considered a fundamental topic in several statistical courses, many textbooks discuss it only partially. This occurs because: i) it is difficult to compute manually and, ii) there are not many statistical programs available for computing this method efficiently. As pointed by Bonett and Price (2005), the use of the tetrachoric correlation analysis might increase if students and researchers had the opportunity of applying it in practice instead of only reading the discussion of it as provided in textbooks.
Tetrachoric coefficient is a better alternative than others used for the case of binary data. It provides a more realistic estimation than phi coefficient if applied to 2x2 tables (Bonett & Price (2005), and its value is generally larger. Hence, its use should be more frequent than it is in current practice. Besides, it has been suggested as a better choice than Cohen's kappa when agreement between raters is analyzed (Bonett & Price, 2005; Uebersax, 2006). Moreover, factorial analysis using tetrachoric correlations may be more appropriate than using Pearson's r or Phi if the variables analyzed are binary, (e.g., Muthén, 1989; Ferrando-Piera, 1996; Richard, 2005) and when the assumption of bivariate normality is shown to be plausible (Muthén & Hofacker, 1988).
The ViSta-Tetrachor software here presented performs the computations needed to obtain the point and interval estimates of the tetrachoric correlation. The main advantage of this free available program is that it applies the Bonett & Price (2005) approximation, which is easier to teach and compute and more accurate than other methods implemented in some frequently used packages (e.g., Stata). It is also friendlier than the R functions and SPSS macros needed to estimate the tetrachoric correlation. Additionally, ViSta-Tetrachor is integrated in a broad statistical system with many other related functions and is freely available (Young, 1996).
It is worth to mention that ViSta-Tetrachor calculates and reports the confidence intervals for the tetrachoric correlation coefficient, as described in Appendix B. Additionally; ViSta-Tetrachor can be applied in the context of factor analysis with psychometric purposes. In summary, we believe that this software constitutes a useful tool that simplifies the computation of an otherwise complex to calculate coefficient.
Referencias
1. Bonett, D & Price, R. (2005) Inferential Methods for the Tetrachoric Correlation Coefficient. Journal of Educational and Behavioral Statistics, 30, 2, 213-225. [ Links ]
2. Bock, R. D., & Lieberman M. (1970). Fitting a response model for n dichotomously scored items. Psychometrika, 35, 179-197. [ Links ]
3. Cicchetti, D. V., & Feinstein, A. R. (1990). High agreement but low kappa: II. Resolving paradoxes. Journal of Clinical Epidemiology, 43, 551-558. [ Links ]
4. Enzmann, D. (2007) Statistical Software. Available at: http://www2.jura.uni-hamburg.de/instkrim/kriminologie/Mitarbeiter/Enzmann/Software/Enzmann_Software.html Accessed June 5, 2010. [ Links ]
5. Ferrando-Piera, P. J. (1996). Evaluación de la unidimensionalidad de los ítems mediante análisis factorial. Psicothema, 8, 2, 397-410. [ Links ]
6. Fleiss, J. L. (1981). Statistical methods for rates and proportions (2nd ed.). New York: Wiley. [ Links ]
7. Feinstein, A. R., & Cicchetti, D. V. (1990). High agreement but low kappa: I. The problem of two paradoxes. Journal of Clinical Epidemiology, 43, 543-549. [ Links ]
8. Guilford, J.P. & Fruchter, B. (1973). Fundamental statistics in psychology and education (5th ed.). New York: McGraw- Hill. [ Links ]
9. Hutchinson, T. P. (1993). Focus on psychometrics. Kappa muddles together two sources of disagreement: Tetrachoric correlation is preferable. Research in Nursing & Health, 16, 313-316. [ Links ]
10. Kubinger, K.D. (2003) On artificial results due to using factor analysis for dichotomous variables. Psychology Science, 45, 1, 106-110. [ Links ]
11. Lord, F.M. & Novick, M.R. (1968). Statistical theories of mental test scores. Reading, MA: Addison Wesley. [ Links ]
12. Muthén, B. (1989). Dichotomous factor analysis of symptom data. In Eaton, & Bohrnstedt (Eds.), Latent Variable Models for Dichotomous Outcomes: Analysis of Data from the Epidemiological Catchment Area Program (pp. 19-65), a special issue of Sociological Methods & Research, 18, 19-65. [ Links ]
13. Muthén, B., & Hofacker, C. (1988). Testing the assumptions underlying tetrachoric correlations. Psychometrika, 53, 563-578. [ Links ]
14. Pearson, E. (1900). Mathematical contribution to the theory of evolution. VII. On the correlation of characters not quantitatively measurable. Philosophical Transactions for the Royal Society of London, 195A, 1-47. [ Links ]
15. Richard, M.C. (2005). Desarrollos del análisis factorial para el estudio de ítem dicotómicos y ordinales. Interdisciplinaria, 22, 2, 237-251. [ Links ]
16. Sheskin, D. (2007). Handbook of Parametric and Nonparametric Statistical Procedures. 4th ed , Boca Raton, FL: Taylor & Francis Group. [ Links ]
17. Uebersax J.S. (2006). The tetrachoric and polychoric correlation coefficients. Statistical Methods for Rater Agreement web site. Available at: http://john-uebersax.com/stat/tetra.htm. Accessed June 5, 2010. [ Links ]
18. Young, F.W. (1996). ViSta: The Visual Statistics System. UNC L.L. Thurstone Psychometric Laboratory, Research Memorandum 94-1. [ Links ]
19. Young, F. W., Valero-Mora, P. M. & Friendly, M. (2006). Visual Statistic: Seeing Data With Dynamic Interactive Graphics. Hoboken, NJ: John Wiley & Sons. [ Links ]

