


Services on Demand
Journal
Article
 English (pdf)
 Article in xml format
 Article references
 Send this article by e-mail
Indicators
-
 Cited by SciELO
 -
 Access statistics
Related links
-
 Cited by Google
 -
 Similars in
SciELO
Similars in
SciELO -
 Similars in Google
Share

 Permalink
Revista Latinoamericana de Psicología
Print version ISSN 0120-0534
rev.latinoam.psicol. vol.44 no.3 Bogotá Sept./Dec. 2012
The Flynn effect in Brazil: Examining generational changes in the Draw-a-Person and in the Raven's Coloured Progressive Matrices
El efecto Flynn en Brasil: Examinando los cambios generacionales en los tests Dibujo de la figura humana y Matrices de Colores Progresivas de Raven
Denise R. Bandeira,
Angelo Costa
Universidade Federal do Rio Grande do Sul (UFRGS), Brazil
Adriane Arteche
Winnicott Research Unit, University of Reading, United Kingdom
Address correspondence to: Dr. Denise R. Bandeira, Programa de Pós Graduação em Psicologia, Universidade Federal do Rio Grande do Sul, Ramiro Barcelos, 2600, sala 120, CEP 90035-003 Porto Alegre, RS, Brasil.Email: dr.bandeira@terra.com.br. Financial Support: CNPq, Brasil
Recibido: Julio de 2010 Revisado: Febrero de 2012 Aceptado: Marzo de 2012
Abstract
Studies have shown an increase in intelligence test scores across decades – the "Flynn effect". Nevertheless, the fact that this effect has not been consistently observed when different sources of cognitive ability are used is one of the main topics of discussion. Thus, the present research aimed to shed some light on this issue. Two studies using different cognitive ability measures were designed in order to control for potential measure effects. Children were Brazilian, aged between 6-12 years. The first study had the Draw-a-Person test as a measure of intelligence; 294 children were assessed during 1980 decade, whilst 203 were assessed during the 2000 decade. The second study used the Raven's Coloured Progressive Matrices. A total of 562 children were assessed during 1990 decade, and 243 in 2000 decade. Results showed no significant generation effects regardless of the measure used. Educational and social aspects are considered in order to explain these results.
Key words: Flynn effect; cognitive ability; intelligence; Draw-a-Person; Raven.
Resumen
Diferentes estudios han mostrado un aumento en las puntuaciones de los tests de inteligencia a lo largo de las últimas décadas - el "efecto Flynn". Sin embargo, el hecho de que este efecto no se haya observado consistentemente cuando las fuentes de habilidad cognitiva son utilizadas, hace que éste sea uno de los principales temas de discusión. Por tanto, la presente investigación tuvo como objetivo arrojar algo de luz sobre esta cuestión. Dos estudios que utilizaron diferentes medidas de habilidad cognitiva fueron diseñados con el fin de controlar los efectos de medición potencial. En el estudio participaron niños brasileños con edades comprendidas entre 6-12 años. El primer estudio tenía la prueba Dibujo de la figura humana como medida de la inteligencia; 294 niños fueron evaluados durante la década de 1980, mientras que 203 fueron evaluados durante la década del 2000. El segundo estudio utilizo las matrices de colores progresivas de Raven. Un total de 562 niños fueron evaluados durante la década de 1990, y 243 en la década del 2000. Los resultados no mostraron efectos significativos de generación, independientemente de la medida utilizada. Los aspectos educativos y sociales son considerados para explicar estos resultados.
Palabras clave: Efecto Flynn; habilidad cognitiva; inteligencia; dibujo de la figura humana; Raven.
Since James Flynn published his first study (1984), a substantial body of research has demonstrated the rise in psychometric IQ scores from one generation to another. Evidence of the 'Flynn Effect'- as the phenomenon is known, it was originally found in American samples studied along five decades of the last century (1932 to 1978, Flynn, 1984). Flynn (1984) suggested that the intensity of this effect can be estimated in an increase of around 3-5 IQ points per decade. The result was later replicated by himself in other developed countries in Europe, North America, and Asia (Flynn, 1987; Flynn, 2007) and, more recently, by several other researchers worldwide (Daley, Whaley, Sigman, Espinosa, & Neumann, 2003; Khaleefa, Sulman, & Lynn, 2008; Nettelbeck & Wilson, 2004; teNijenhuis & van der Flier, 2007).
Despite the bulk of research that has provided evidence for the Flynn effect, several limitations have been raised about both its validity and generalizability. The fact that the Flynn effect has not been consistently observed when different sources of cognitive ability are used notably adds difficulty in understanding the phenomenon. Research has shown that the Flynn effect has been more easily observed when measures of the so called fluid Intelligence, as the Raven's Progressive Matrices, are used (Flynn, 2009). The gains per generation in studies which used this kind of test are up to 18 IQ points. In tests of specific abilities and in those nearer of the crystallized intelligence, such as verbal, vocabulary, and Wechsler subscales, the gains are slighter (Wichertset al., 2004). For example, in the Mill Hill Vocabulary Scale, British subjects gained just 6 IQ points over 45 years against 27 points in the Raven's test (Flynn, 2006). This finding has raised concern about whether the Flynn effect can be understood as a general phenomenon or whether it is restricted to a specific ability (Nettelbeck & Wilson, 2004). It has also led researchers to question if IQ gains reflect a genuine change in real life abilities, or if they are a merely a function of increased familiarity with the measures used (Kanaya, Ceci, &Scullin, 2003; te Nijenhuis & van der Flier, 2007; Raven & Raven, 2008; Rodgers, 1999).
More recently, the generalizability of the Flynn effect has also been discussed as research has failed to confirm the rise in IQ scores in data collected after the 1980s (Teasdale & Owen, 2005). In addition, reports of different countries have suggested that the Flynn effect, and its timing, varies across cultures (Khaleefa, Sulman, & Lynn, 2008).Whilst in some countries IQ gains seem to be driven by the lower ability group – with a steady drop in the frequency of lower scores (Teasdale & Owen, 2008; Truscott & Frank, 2001), in other countries, rises in intelligence scores are equally distributed across cognitive ability levels (Flynn, 1998). Moreover, some countries have observed a constant trajectory in IQ rises, whereas others have reported peaks of gains, followed by an apparent stagnation. Sundet, Barlaug and Torjussen (2004), for example, in a study with the Norwegian army, showed a cessation of the intelligence scores gains between 1990 and 2000. The authors demonstrated that until the beginning of the 1970s there were significant rises in intelligence scores. Nevertheless, after the 1990s the scores remained stable. Teasdale and Owen (2005), in a study with Scandinavians, even observed a decrease in the intelligence levels when comparing the decades of 1990s and 2000s. The authors based their discussion in the reduction of schooling years in the Danish educational system. These results were recently replicated by the same authors (Teasdale & Owen, 2008). Similarly, Beaujean and Osterlind (2008) showed a negligible increase in IQ scores when comparing American cohorts from the 90s and the early 21th century. Some authors suggest that this lowering of IQ scores might be or is probably due to the rising proportion of immigrants in the studied countries (te Nijenhuis& van der Flier, 2001; te Nijenhuis et al, 2004).
Flynn (2006) suggested an association between the rise in IQ scores and industrialization. This could explain the fact that developed countries, such as countries from the Scandinavia, started the increase in intelligence scores before most of the other developed nations. Thus, it is plausible that they could foretell the future, and that the IQ increases come to an end in the developed countries. This might elucidate why recent replications of the Flynn effect have been unsuccessful in developed countries, but significant findings are still being reported in developing countries. However, data from lesser-developed countries is more difficult to acquire (Rodgers, 1999) and few studies have been able to explore the Flynn effect in these populations. Daley et al (2003), studied children from a rural region of Kenya and showed that between 1984 and 1998 there was an expressive gain in intelligence levels – about 4 IQ points in Raven's test. The authors' explanation lay in social factors, such as better instruction level of the parents, structural improvement of families, and better nutrition and health care access of the children (see Khaleefaet al., 2009, for similar results in Sudan with the Wechsler scales and Khaleefa et al., 2008, for similar results with the Draw-a-Person test).
Although Brazil is considered a developed country, the Brazilian Human Development Index (HDI) is considered high - 0.813 (UNDP, 2009). Because of its huge size, there are large differences within the country. For instance, the state of Rio Grande do Sul (RS) located in South Brazil has an HDI of 0.832, whilst Alagoasstate situated in North Brazil has a much lower HDI(i.e. 0.677;UNDP, 2005). Furthermore, data suggest that even within each state and even within big cities (such as Porto Alegre city, where this study is conducted) there are large regional and interurban inequalities regarding to the HDI (Bassani, 2005). These inequalities are also prevalent in schools. A study comparing students from state and private institutions in the state of RS showed that the difference between scores obtained in standardized cognitive ability tests by these two groups of students can reach up to 30 IQ points (DalVesco, Mattos, Benincá, Tarasconi, & Mattos, 1998; Figueiredo, 1996).
Regarding Flynn studies in South America, even though there has been previous evidence of the presence of the generational gains in cognitive ability test scores (Flynn, 1998; Flores-Mendoza, Abad, & Lele, 2005), there is only one recent study about the Flynn Effect, and it used the Draw-a-Person Test (DAP) to assess cognitive ability (Colom, Flores-Mendoza, & Abad, 2007). The study compared three samples of children from Minas Gerais, a Brazilian state: a sample assessed on the 1930s, an equivalent sample assessed in 2002, and a sample from a rural region, assessed in 2004. The DAP was scored according to the Goodenough system (1926/1964). The results indicated a difference of 17 IQ points in IQ scores between the urban area samples of 1930 and 2002. The difference between the urban area sample of 1930 and the rural region sample of 2004 was of 10 IQ points, while the difference between the urban area sample of 2002 and the rural region sample of 2004 was 30 IQ points. However, the generational gap is massive, and therefore it is not possible to identify whether the trend of stagnation after 80s observed in developed countries is similar in a lesser developed country.
Because of the lack of databases and those striking regional differences, it is not an easy task to set up a study of the Flynn effect in Brazil with a representative sample. By studying the Flynn effect in one specific main city of Brazil (Porto Alegre, RS state) and using two different cognitive ability measures, this research aim to overcome those difficulties and to reduce uncertainty about (a) whether the changes in cognitive ability scores are related to the measure used in the study and (b) whether the Flynn effect is still present in the specific assessed region of Brazil (e.g. South) when recent data is compared (late 80s and 2000).
Method
Study 1 The Draw-a-Person test
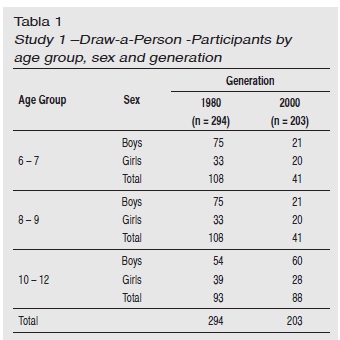
Data Sources. Four hundred and ninety seven human figure drawings belonging to the Psychological Assessment Laboratory of the Psychology Institute of the Federal University of Rio Grande do Sul, Brazil, were used as data sources. Participants were part of two research projects about the validity of the Draw-a-Person test. Children from Porto Alegre, Brazil, of low or middle-low social economic status (i.e. children enrolled in state schools and from working class families) aged between 6 and 12 years old were conveniently recruited from state schools into the two studies. From these two projects, two samples were set up by the year of data collection: 1980 (1986-1988) and 2000 (2004-2006) and into three age groups (6-7, 8-9, and 10-12 years old) (see Table 1).
Instruments
Draw-a-Person: The DAP test is a well-known valid measure of cognitive ability (Abell, Horkheimer, & Nguyen, 1998; Bandeira, Arteche, & Costa, 2008; Barret& Eames, 1996), more specifically of visual-motor ability. Although different DAP scoring systems have been developed, significant correlations between the DAP and other cognitive ability measures have been widely reported regardless of the scoring system used (Abellet al., 1998; Aikman, Belter, & Finch, 1992; Harris, 1963).
In the current study the drawings were scored according to the Wechsler DAP Scale (Wechsler, 2003) by two blind judges trained for drawing evaluation. The Wechsler Scale is a Brazilian Draw-a-Person system designed based on the Naglieri (1988), the Goodenough (1926/1964) and the Koppitz' (1984) purposes. In this system, the child is asked to draw a person and then another picture of the opposite sex. The scale is based on a binary system, whereby each item is scored as present/absent. A total score is computed by summing up all present items of the two drawings. The maximum score that a child can obtain is 120. A correlation of r=.50 between the Wechsler DAP system and the Raven's Coloured Progressive Matrices test has been reported (Bandeira, et al., 2007).
Procedures
Drawings of each generational group were collected by PhD students and research assistants. Given inclusion criteria for research projects, head teachers were contacted and requested to indicate children that: (a) were in the appropriate grade for their age, (b) showed no behavior or cognitive ability problems at school, (c) showed no history of developmental disability or cognitive delay and (d) were not in psychological or pedagogical treatment at the time of assessment. Parents were informed about the research and given the right to withdraw. None of the parents opted to drop out.
Results
Inter-judges reliability of each DAP item was investigated and results showed 91.5% to 100.0% of agreement. Internal consistency (Kuder-Richardson) was calculated for each generation (i.e. 1980 and 2000) and evidence of acceptable reliability was found (KR20 = .88 for both).
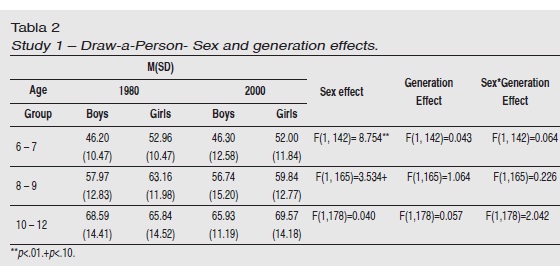
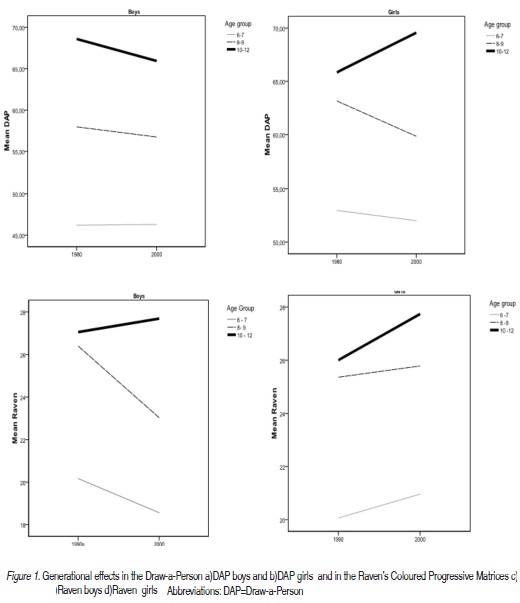
Variable distribution was examined for generation and total DAP score met criteria for normality. Inspection of scale range and means corroborated the absence of ceiling effects. In order to investigate the generational effect, a t-Test was performed. Data showed no significant difference between means of 1980 (M=58.00) and 2000 (M=60.32; t=-1.669, gl=486, p=.096). As the distribution of group age was different across generations (see Table 1), with a higher number of younger children, and because sex differences were observed in the total sample (M=60.93 for girls and M=57.78 for boys; t=-2.224, gl=486, p=.027), a series of two-way analysis of variance were performed. First, variable distribution was examined for each sex and age group. In all cases total DAP score met criteria for normality. In all examined groups participants' scores were well distributed along the DAP scale range, and even in the older age group there was no evidence that average scores were close to the possible maximum score in the DAP. Next, for each age group, main effects of sex and generation were examined. Data showed significant sex differences in the 6-7 years-old age group (F(1,142)=8.754; p<.004) with girls performing better than boys. Results showed no generational or sex by generation interaction effect (see Table 2 & Figure 1a, 1b).
Study 2. The Raven's Coloured Matrices
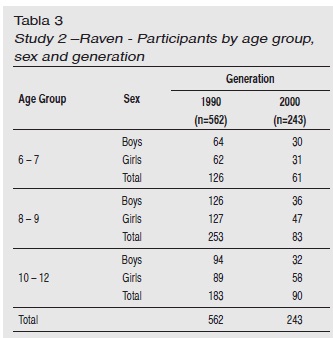
Data Source. Eight hundred and five Raven protocols belonging to the Psychological Assessment Laboratory of the Psychology Institute of the Federal University of Rio Grande do Sul, Brazil, were used as data sources. A total of 562 participants were originally recruited for a national study designed to update the Raven's Coloured Progressive Matrices norms conducted in Porto Alegre, Brazil. These protocols composed the 1990 sample (1994-1998).
The 243 protocols that composed the 2000 sample (2006-2008) were recruited from a study that focused primarily on the validity of the DAP. This sample was conveniently recruited in state schools and comprised children from low or middle-low social economic status, aged 6-12 years old. They were divided into three groups by age range (6-7, 8-9, and 10-12 years old) (see Table 3 for sample details).
Method
Instrument
Raven's Coloured Progressive Matrices (Raven, Court, & Raven, 1995). This is a well-known measure of abstract reasoning and it is broadly recognized as one of the most reliable tests of cognitive ability (Costenbader & Ngari, 2001; Pind, Gunnarsdóttir, & Jóhannesson, 2003). In Brazil, the complete version was published in 1991 (Angelini, Alves, Custódio & Duarte, 1999) and evidence of reliability has been widely reported (Angelini et al., 1999; Bandeira, Alves, Giacomel, & Lorenzatto, 2004). Children are presented with three sets (A, Ab and B) of 12 items displaying abstract pattern of shapes organized according to logical rules in a 3X3 matrix where one of the cells is empty. In each item, participants must identify the implicit rule and choose the correct item to complete the pattern. Items difficulty increases progressively.
Procedures
Data from the 90s were collected was part of the Raven's normalization study (Bandeira, et al., 2004). Twenty-seven schools (24 primary schools and 11 pre-schools) were randomly selected in Porto Alegre city. The proportion of state and independent schools was respected. Nevertheless, none of the independent schools agreed to take part in the study and, therefore, the final sample comprised 14 state schools. In line with school policies, head teachers provided consent on parents' behalf and an informed consent was also obtained from the child. In primary schools, data collection took part in groups of a maximum of eight children. Children from preschool were tested individually, according to test instructions.
Data from the 2000 generation were collected in State Schools of Porto Alegre, Brazil by a PhD student and two research assistants in line with Study 1 procedures. Children were assessed in groups of five to 30 participants according their age (Raven, et al., 1995).
Results
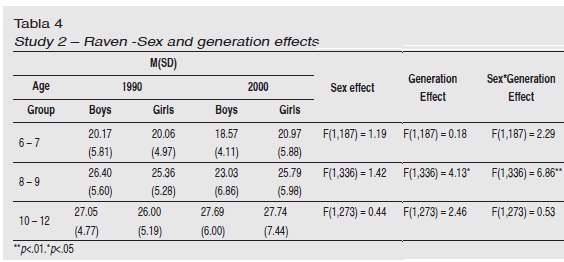
Similarly to the DAP analysis, the total sample was first investigated. Results revealed no significant difference between means of 90s (M=24.76) and 2000 (M=24.69; t=-0.496, gl=373.17, p=.620). In order to match procedures followed in the DAP study, we then included sex and age group in the analysis. Thus, variable distribution was examined for each sex, age group and generation an in all cases total raw scores met normality criteria. Likewise, inspection of scale range and mean did not support a ceiling effect hypothesis. Raven's raw scores were compared using two-way analysis of variance. For each age group, sex and generation were entered as the independent variables. Data showed no significant differences between age groups or generations in the 6-7 and the10-12 groups. Conversely, a significant generation effect (F(1,336) = 4.133; p = .043) and a sex by generation interaction effect (F(1,336) = 6.865; p = .009) was observed in the 8 - 9 years group (see Figures 1c, 1d). As shown in Table 4, at 8-9 years there was a decrease in Raven's average scores from 1990 to 2000. In particular, boys of 8-9 years showed the most significant drop in mean test result.
Discussion
This study showed that in the last two decades there were no gains in cognitive test performance in the examined Porto Alegre samples. This pattern was identical when different measures (i.e. Draw-a-Person and Raven) were examined, suggesting that both abstract reasoning and viso-motor abilities are following a very similar trajectory. Arguably, the association between the two measures used in the present study has been previously reported as significant (Bandeira, et al. 2008), even though moderate. Thus, it is possible that the results in the Draw-a-Person test and in the Raven were comparable because – at least at some extent – the same latent construct is being assessed in both instruments.
Revision of the research on the Flynn effect in Brazil revealed that in the study conducted by Colomet al. (2007), the difference between studied generations is 70 years. This represents a significant gap which prevents to reliably identify whether IQ gains are stable across generations and, most importantly, if there were gains or stagnation in recent generations. In another study conducted in Brazil, where some indication generational gain was found (Flores-Mendoza et al, 2005), the samples were from two different States. As discussed above, this is a large bias in Brazil.
As Brazil is a developed country, generational gains in IQ would be expected (Daleyet al., 2003; Flynn, 2006; Khaleef et al., 2008; Khaleef et al., 2009). There may be several explanations for this absence. One would be related to the high development level (HDI) of Porto Alegre(i.e. 0.865; UNDP, 2000). This hypotesys is in line with recent research that has reported a cessation in IQ gains when data after the 80s is analysed in developed countries (Beaujean & Osterlind, 2008; Sundet et al., 2004; Teasdale & Owen, 2005).
In the past two decades indicators of health quality in Porto Alegre have still shown a gradual, albeita less sharp growth curves (Ministério da Saúde, 2007). Thus, one might expect no significant differences, but a tendency of steady increase when cognitive ability scores of closer generations are examined. In order to achieve gains in the same magnitude as those observed in the past decades, a greater generational gap might therefore be necessary. Nevertheless, data in this study do not provide support for this theory, if any tendency can be inferred, that would suggest a decrease in test performance.
A more plausible hypothesis for these results emerges from the examination of social and educational aspects of Porto Alegre in the past 30 years. As mentioned above, in the last 20 years Porto Alegre has observed a steady increase in its nutrition and general health indices (IBGE, 2004). However, as opposed to what has happened in other developing countries such as Sudan (Khaleefa et al, 2008; Khaleefa et al, 2009), no pronounced changes were noticed. Conversely, similarly to what has been observed in the Danish population (Teasdale & Owen, 2008), the Brazilian educational system faced several modifications over the last two decades. The management of primary state schools is now responsibility of local councils, rather than of the state education department. As a result, primary schools suffered a decline in its budget, in the number of admitted students and an augmentation ofdisapprovals.(MEC & INEP, 2003; MEC & INEP, 2006). This is associated with poorer overall quality of primary education which could in turn be related to the stagnation and potential pattern of decrease in IQ scores.
Interestingly and contrary to previous studies (Teasdale& Owen, 2005, 2008) this data does not suggest that the somewhat stagnation in rise of cognitive ability test scores is due to ceiling effects. These results showed that for both boys and girls, in all group ages and across generations average scores were not close to the maximum potential test score. It is assumed that given that the school levels are low and that we do not found ceiling effect, there may be a future growth in IQ scores. In the latest study of the Programme for International Student Assessment, OECD (2007), Brazil occupies the 53th position in math (among 57 countries) and the 48th in reading (among 56 countries).
Despite the novel findings with regards to the Flynn effect in Porto Alegre, the present study has a few limitations that should be addressed. Though several variables such as the equivalence between the schools that took part in the study were controlled, participants' socioeconomic levels and the region of Porto Alegre, a few sample limitations should be addressed. Firstly, all samples were conveniently recruitedIn addition, our sample selection for the Draw-a-Person was biased by not including children with observed (as reported by the teacher) developmental delays. Thus, this study could have missed the bottom of the scale, where some researchers have suggested that most of the IQ gains occur. Finally, timing of data collection was not exactly the same for the two measures.
Despite these limitations, the present study is one of the few attempts to investigate generational gains in cognitive ability in South America and specifically in Brazil using large databases. Finally, future research with larger sample sizes and a wider representation of the Brazilian population are needed.
Referencies
Abell, S., Horkheimer, R., & Nguyen, S. (1998). Intellectual evaluations of adolescents via Human Figure Drawings: An empirical comparison of two methods. Journal of Clinical Psychology, 54(6), 811-815. [ Links ]
Angelini, A.L., Alves, I.C.B., Custódio, E.M.; Duarte, W.F., & Duarte, J.L.M. (1999). Matrizes Progressivas Coloridas de Raven: Escala Especial. Manual. São Paulo: CETEPP. [ Links ]
Aikman, K. G., Belter, R. W., & Finch, A. J.(1992) Human Figure Drawings: Validity in assessing intellectual level and academic achievement. Journal of Clinical Psychology 48, 114-120. [ Links ]
Bandeira, D. R., Alves, I. B., Giacomel, A., & Lorenzatto, L. (2004). Matrizes Progressivas Coloridas de Raven - Escala Especial: Normas Para Porto Alegre, RS. Psicologia em Estudo, Maringá, 9, 497-486. [ Links ]
Bandeira, D. R., Arteche, A. X., & Costa, A. B. (2008). Estudo de validade do DFH como medida de desenvolvimento cognitivo infantil. Psicologia:Reflexão e Crítica, 21, 332-337. [ Links ]
Barret, M., & Eames. (1996). Sequential development in children's human figure drawing. British Journal of Developmental Psychology, 14, 219-226. [ Links ]
Bassani, V.S. (2005) Porto Alegre Desigual: Os Vários Retratos De Uma Metrópole. Observatorio da cidade de Porto Alegre, Porto Alegre. [ Links ]
Beaujean, A. A., & Osterlind, S.J. (2008). Using Item Response Theory to assess the Flynn Effect in the National Longitudinal Study of Youth 79 Children and Young Adults data. Intelligence, 36, 455-463. [ Links ]
Colom, R., Flores-Mendoza, C. E., & Abad, F. J. (2007). Generational Changes on the Draw-a-Man test: A comparison of Brazilian urban and rural children tested in 1930, 2002 and 2004. Journal of Biosocial Science, 39, 79-89. [ Links ]
Costenbader, V., & Ngari, S. M. (2001). A Kenya standardization of the Raven's Coloured Progressive Matrices. School Psychology International, 22, 258-268. [ Links ]
Daley, T. C., Whaley, S. E., Sigman, M. D., Espinosa, M. P., & Neumann, C. (2003). IQ on the rise: The Flynn Effect in Rural Kenyan Children. Psychological Science,14, 215-129. [ Links ]
Dal Vesco, Á.; Mattos, D.; Benincá, C., & Tarasconi, C. (1998). Correlação entre WISC e rendimento escolar na escola pública e na escola particular. Psicologia Reflexão e Crítica, 11(3), 481-495. [ Links ]
Figueiredo, V. (1996). A influência do tipo de escola dos resultados dos subtestes verbais do Teste WISC. Psico, 27, 111-115. [ Links ]
Flores-Mendonza, C., Abad, F., & Lele, A. (2005). Análise de itens do desenho da figura humana: aplicação de TRI. Psicologia: Teoria e Pesquisa, 21, 13-22. [ Links ]
Flynn, J. R. (2009). Requiem for nutrition as the cause of IQ gains: Raven's gains in Britain 1938-2008. Economics and Human Biology, 7, 18-27. [ Links ]
Flynn, J. R. (2007). What is intelligence? Beyond the Flynn Effect. New York: Cambridge University Press. [ Links ]
Flynn, J. R. (2006). O efeito Flynn: repensando a inteligência e aquilo que a afeta. In C. Flores-Mendoz, R. Colom, A. Andrés-Pueyo, R. J. Haier, & S. A. Petrill. Introdução à Psicologia das diferenças individuais (pp.387-411). Porto Alegre: ArtMed. [ Links ]
Flynn, J.R. (1998). IQ gains over time: Toward findings the causes. In: U. Neisser (Ed.), The rising curve. Long term gains in IQ and related measures (pp.25-66). Washington, DC: American Psychological Association. [ Links ]
Flynn, J. R. (1987). Massive IQ gains in 14 nations: What IQ tests really measure. Psychological Bulletin, 101, 171-191. [ Links ]
Flynn, J. R. (1984). The Mean IQ of Americans-massive gains 1932 to 1978. Psychological Bulletin, 95, 29-51. [ Links ]
Goodenough, F. (1926/1964) Teste de inteligencia Infantil por medio del dibujo de la figura humana. Buenos. Aires: Paidós. [ Links ]
Harris, D. B. (1963). Children's Drawing as a Measures of Intellectual Maturity. New York: Harcourt, Brace & World. [ Links ]
IBGE (2004). Pesquisa de orçamentos familiares 2002-2003. Retrieved from http://www.ibge.gov.br/home/presidencia/noticias/noticia_impressao.php?id_noticia=171. [ Links ]
Kanaya, T., Ceci, S., & Scullin, M. (2003). The rise and fall of IQ in special ed: Historical trends and their implications. Journal of School Psychology, 41, 453-465. [ Links ]
Khaleefa, O., Sulman, A., & Lynn, R. (2008). The increase of intelligence in Sudan, 1964-2006.Personality and Individual Differences, 46, 412-413. [ Links ]
Khaleefa, O., Sulman, A., & Lynn, R. (2009).An increase of intelligence in Sudan, 1987-2007. Journal of Biosocial Science, 41, 279-283. [ Links ]
Koppitz, E. M. (1984). El dibujo de la Figura Humana em los niños. Buenos Aires: Guadalupe. [ Links ]
MEC & INEP. (2003). Desempenho do sistema educacional brasileiro: 1991-1993. Brasília. Retrieved from http://www.inep.gov.br/download/catalogo_dinamico/estatisticas/mioloSinopse1.991-1995.pdf. [ Links ]
MEC & INEP. (2006). Censo escolar 2006. Brasília. Retrieved from http://www.inep.gov.br/download/censo/2006/resultados_censo_escolar2006.zip. [ Links ]
Ministério da Saúde. (2007). DataSUS: Indicadores e Dados Básicos. Brasília. Retrieved from: http://tabnet.datasus.gov.br/cgi/idb2007/matriz.htm. [ Links ]
Naglieri, J. (1988). DAP: Draw a person: A quantitative scoring system. San Diego: The Psychological Corporation. [ Links ]
Nettelbeck, T., & Wilson, C. (2004). The Flynn effect: Smarter not faster. Intelligence, 32, 85-93. [ Links ]
OECD. (2007). PISA 2006: Science Competencies for Tomorrow's World. Retrieved from http://www.oecd.org/dataoecd/16/28/39722597.pdf. [ Links ]
Pind, J., Gunnarsdóttir, E. K., & Jóhannesson, H.S. (2003). Raven's Standard Progress-386. [ Links ]
Raven, J. C., Court, J. H., & Raven, J. (1995). Coloured Progressive Matrice Manual. London: Lewis. [ Links ]
Raven, J., & Raven, J. (2008). Uses and abuses of intelligence: Studies advancing Spearman and Raven's quest for non-arbitrary metrics. New York: Royal Fireworks. [ Links ]
Rodgers, J. (1999). A critique of the Flynn effect: Massive IQ gains, methodological artifacts, or both? Intelligence, 26, 337-356. [ Links ]
Sundet, J. M., Barlaug, D. G, & Torjussen, T. M. (2004). The end of the Flynn effect? A study of secular trends in mean intelligence test scores of Norwegian conscripts during half a century. Intelligence, 32, 349-362. [ Links ]
Teasdale T. W., & Owen, D. R. (2005). A long-term rise and recent decline in intelligence test performance: The Flynn Effect in reverse. Personality and Individual Differences, 39, 837-843. [ Links ]
Teasdale, T. W., & Owen, D. R. (2008). Secular declines in cognitive test scores: A reversal of the Flynn Effect. Intelligence, 36,121-126. [ Links ]
Te Nijenhuis, J., de Jong, M., Evers, A., van der Flier, H. (2004). Are cognitive differences between immigrant and majority groups diminishing? European Journal of Personality, 18, 405-434. [ Links ]
Te Nijenhuis, J., & van der Flier, H. (2001). Group Differences in Mean Intelligence for the Dutch and Third World Immigrants. Journal of Biosocial Science, 33, 469-475. [ Links ]
Te Nijenhuis, J., & van der Flier, H. (2007).The secular rise in IQs in the Netherlands: Is the Flynn effect on g? Personality and Individual Differences, 43, 1259-1265. [ Links ]
Truscott, S., & Frank, A. (2001). Does the Flynn effect affect IQ scores of students classified as LD? Journal of School Psychology, 59, 319-334. [ Links ]
UNDP. (2000). Índice de Desenvolvimento Humano - Municipal, 1991 e 2000. Retrieved from: http://www.pnud.org.br/atlas/ranking/IDH-M%2091%2000%20Ranking%20decrescente%20(pelos%20dados%20de%202000).htm. [ Links ]
UNDP. (2005). Ranking do IDH dos estados do Brasilem 2005. Retrieved from: http://www.pnud.org.br/pobreza_desigualdade/reportagens/index.php?id01=3039&lay=pde. [ Links ]
UNDP. (2009). Human Development Report. Retrieved from http://hdrstats.undp.org/en/countries/country_fact_sheets/cty_fs_BRA.html. [ Links ]
Wechsler, S. (2003). DFH III: O Desenho da Figura Humana: Avaliação do desenvolvimento cognitivo de crianças brasileiras. Campinas: LAMP/PUC. [ Links ]
Wicherts, J. M., Dolan, C. V., Hessen, D. J., Oosterveld, P., van Baal, G. C. M., Boomsma, D. I., & Span, M. M. (2004). Are intelligence tests measurement invariant over time? Investigating the nature of Flynn effect. Intelligence, 32, 509-537. [ Links ]
