


 English (pdf)
 Article in xml format
 Article references
 Send this article by e-mail
 Cited by SciELO
  Cited by Google
  Similars in
SciELO
Similars in
SciELO  Similars in Google
 Permalink
Having perceived benefits of the male condom increase the likelihood of its use, while perceived harm reduces use; the former is the more likely perception (Prat, Planes, Gras & Sullman, 2016). This model has been applied to a broad range of health behaviors (Prochaska et al., 1994). In addition to the male condom, the use of which prevents sexually transmitted infections/AIDS and unwanted pregnancies, there are other different methods suitable to prevent unwanted pregnancies, such as the contraceptive pill and the morning-after pill (emergency contraception). This paper studies globally and by sex young people's evaluation of the possible benefits associated with three widely used methods (condoms, the contraceptive pill, and the morning-after pill), in order to analyse if their evaluation of different pros and cons supports the available data, which indicate a preferential use of the condom.
The data collected are then analysed as compositional tables (Egozcue, Pawlowsky-Glahn, Templ & Hron, 2015). We found very few psychology studies based on compositional methods, although there are studies on problems with the statistical analysis of ipsative data (e.g. Calderón Carvajal & Ximénez Gómez, 2014). One of these contributions refers to the use of compositional biplots (Cortés-Rodríguez & Sánchez-Barba, 2013); a second deals with both biplots and coordinate representation of compositions (Batista-Foguet, Ferrer-Rosell, Serlavós, Coenders, & Boyatzis, 2015); and a third contribution is a preliminary study of the data we use in this paper (Pawlowsky-Glahn, Egozcue, & Planes-Pedra, 2017). Compositional tables have been further developed and applied in social sciences (Hron, Templ, & Filzmoser, 2013; Fâcevicová, Hron, Todorov, & Templ, 2016; Ortego & Egozcue, 2016). Other compositional tools, such as variation matrices (Aitchison, 1986) and compositional principal component analysis (Aitchison, 1983), have been extensively used in other fields (see for instance Pawlowsky-Glahn & Buccianti, 2011).
Framework
Assumptions and Principles
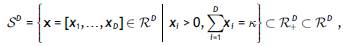
Our approach is based on the premises that compositional data (Aitchison, 1986; Barceló-Vidal & Martín-Fernández, 2016) are vectors with strictly positive, real, components,  , that carry relative information, that is, in the ratios between components. Therefore, a rescaling has no effect on the information carried by the data. Proportional vectors of positive components are equivalent, that is, compositions are equivalence classes (Barceló-Vidal, Martín-Fernández, & Pawlowsky-Glahn, 2001). The usual representative of the sample space is the simplex (k =constant),
which is obtained using the closure operator,
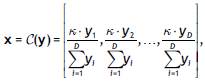
by just dividing each component by the sum of all components and multiplying by k. This definition includes parts of a whole, such as e.g. parts per one, percentages, ppm, molar concentrations, and relative frequencies (Pawlowsky-Glahn, Egozcue, & Tolosana-Delgado, 2015). However, the representation in the simplex is not essential to assume that an array of positive numbers is a composition. Instead, it is enough to assume the underlying principles of compositional data analysis, which are:
Scale invariance: scaling factors do not alter the analysis; the relevant entities are the ratios of components.
Subcompositional coherence: analysis of a subcomposition is compatible with that of the whole composition, i.e. subcompositional scale invariance and distance dominance hold, and ratios of common parts are preserved.
This allows for a table of positive scores to be considered as a composition. In the present case, we use a survey in which each row scores the effectiveness of the methods C (condom), P (contraceptive pill), and M (morning-after pill) with respect to 10 different situations. The individual's complete answer to the survey consists of a table (10 rows, 3 columns). We assume that the two mentioned principles hold, and each table is a composition.
Aitchison geometry of the simplex
The approach presented in this paper benefits from the particular algebraic-geometric structure of the CoDa sample space. Each equivalence class can be represented in the simplex. The simplex is endowed with the Aitchison geometry (Pawlowsky-Glahn et al., 2015; Pawlowsky-Glahn & Egozcue, 2001), which corresponds to a Euclidean type vector space structure for its operations (perturbation and powering) and a metric defined on the simplex (inner product, norm and distance).
When compositions are arranged as an (I, J) table, it is necessary to redefine these geometric elements that are adapted to tables, which are specified in Egozcue et al. (2015). The perturbation of tables X and Y is the multiplication componentwise up to closure, i.e. the (ij)-th entry is  , the latter being the X and Y entries, respectively. For a real number α, and up to closure, the powering of X has the (ij)-th entry
  .
.
The centered log-ratio (clr) representation of an (I, J) table, X, is also an (I, J) table with entries
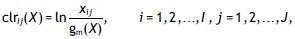
where gm(x)=
 . The sum of all elements of matrix clr(X) is null. From clr(X), the closed table X is readily recovered as X = Cexp(clr(X)). The clr representation provides a simple expression of the metric elements for tables. The inner product can be computed as

where the subscript a stands for Aitchison geometry and the subscript e for ordinary Euclidean geometry, interpreting the matrices as simple vectors. The geometric elements characterizing the sample space allow basic statistical elements to be defined. For a sample of compositional tables, the center or compositional mean is defined as
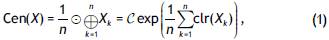
where X denotes an n-sample of compositional tables Xk. The sample total variance of X is (Egozcue et al., 2015)
For a more detailed description of the Aitchison geometry, we recommend Pawlowsky-Glahn et al. (2015) and its references.
Independent and interaction compositional tables
The main contribution of Egozcue et al. (2015) is that any (I, J) compositional table uniquely decomposes into an independent and an interaction table, and that this decomposition is orthogonal in the sense of the Aitchison geometry. It can be written as

or, alternatively, in terms of the respective clr's,
clr(X) = clr(Xind) + clr(Xint).
The entries of the independent part Xind are obtained as the product of the corresponding elements of the geometric marginals of X. In an analysis that tries to relate methods (columns) and situations (rows), the independent part is non-informative, as it only reflects marginal characteristics. Removing the independent part  gives the interaction table or its clr, clr(X) - clr(X
ind) = clr(X
int). It is remarkable that the removal of the independent table is equivalent to a double compositional centering of X or a standard double centering of log(X). The interaction table X
int satisfies that its geometric marginals are uniform and that all rows and columns of clr(X
int) add to zero.
gives the interaction table or its clr, clr(X) - clr(X
ind) = clr(X
int). It is remarkable that the removal of the independent table is equivalent to a double compositional centering of X or a standard double centering of log(X). The interaction table X
int satisfies that its geometric marginals are uniform and that all rows and columns of clr(X
int) add to zero.
In order to analyse a sample of compositional tables, which are identified with the collection of responses to the mentioned survey, the first step could be the computation of the sample center given in (1). Then, attention could be paid to the analysis of the interaction table at the center, which is equal to Cen(X int). The interpretation of interactions between methods and situations is easier when based on clr(Cen(X int)). The properties of such a matrix are the reason for it: (a) their entries add to zero; (b) the squares of the entries add up to the mean simplicial deviance (Egozcue et al., 2015), which is a measure of cross information between methods and situations; (c) positive (negative) entries point out cells in which the score is larger (less) than predicted by the independent table. The reason for this is that the sum of those entries is zero in the rows and columns, any positive entry should be compensated for by negative entries in the same row and column.
Survey data as samples of a compositional table
Preliminaries
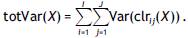
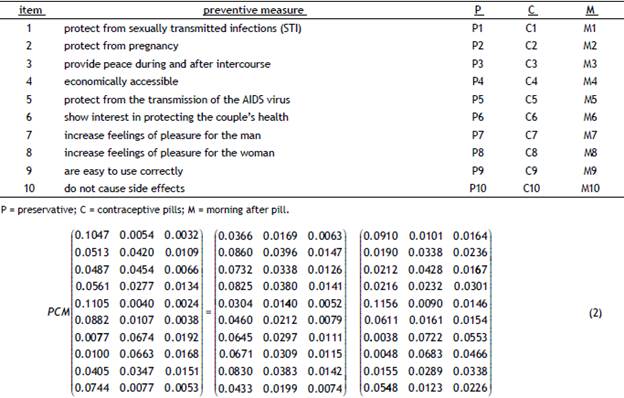
A group of 145 undergraduate students (76% females, 24% males) was asked to evaluate three protective measures, giving a value between 1 and 99 to each in 10 different situations (Grimley, Prochaska, Velicer, & Prochaska, 1995; Prat, Planes, Gras, & Sullman, 2012, 2016; Gómez, Planes, & Gras, 2018); the results are summarised in Table 1. Each student's answer is considered as a sample of a compositional table. Each answer was forced to add to 100 along the three protective measures. When closed to 1, each answer can be considered as the probability that the student gives each protective method satisfying the situation described in the question. Thus, available data constitute a sample of size n = 145 of (I, J) = (10,3) compositional tables. The global compositional mean or center of this data set is proportional to the compositional table, such as the one shown in Equation (2). The center or mean table is on the left, and its decomposition in independent (middle) and interaction (right) tables as in Equation (1). A compositional table can be orthogonally decomposed into an independent table, which is the closest independent table in the Aitchison sense, and an interaction table, which reflects the deviations from independence (Egozcue et al., 2015). In terms of probabilities, the interaction table can be interpreted as reflecting a lack (excess) of probability when the value is smaller (larger) than the corresponding value in the independent table.
Table 1 Survey data presented in the form of a compositional table.
A bootstrap test can be conducted to check the hypothesis that the interaction X int is neutral, that is, that all entries are equal. This is rejected at a p-value less than 10-4, which means that X int is significantly non-neutral and deserves further analysis.
Interactions between items and protective methods
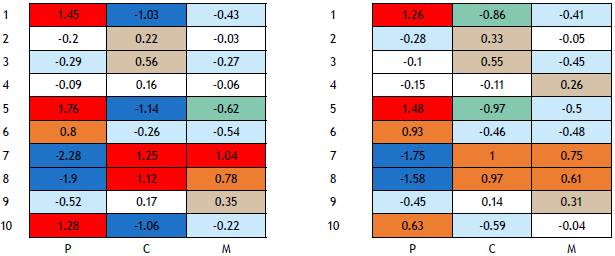
The interaction table in (2) is not straightforward to interpret in its raw form; however, its clr (Figure 1) representation gives a much better insight into the relations between items and protective methods. In fact, a negative value reflects a lack of probability while a positive value reflects the opposite.
The results presented in Figure 1 show that condoms (P) are, overall, very positively valued as protection against sexually transmitted infections/AIDS (items 1 and 5), as the entries in the clr-interaction table are the highest positive values. At the same time, they are considered an obstacle to pleasure during intercourse, as the entries corresponding to items 7 and 8 in the clr-interaction table are the highest negative values. The opposite can be seen with the two types of pill (C and M), which are poorly valued as protective against infections, but positively valued regarding pleasure (items 7, 8). There are other less expected results that also deserve to be commented upon. For example, the positive evaluation of the condom in relation to "showing interest in protecting the couple's sexual health" (item 6), highlights an altruistic motivation that is far from selfish and only oriented towards one's own health, pleasure or economy. Despite the negative evaluations of the prophylactic with respect to male pleasure, previous research has shown that this is not a factor that predicts their use (Prat et al., 2016). It is surprising that the morning-after pill is negatively associated with protection from pregnancy (item 2), even though there is no interaction with the other two methods.
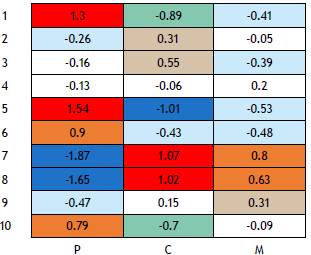
Figure 1 Overall interaction table (clr). Colors enhance the importance of the interaction (I). Red: strong positive I. Ocre: medium positive I. Grey: low positive I. White: no I. Pale blue: low negative I. Aquamarine: medium negative I. Dark blue: strong negative I.
Students were also asked for additional information such as sex and age. Age did not show any pattern related to the evaluation of the different protective measures and is, therefore, not included in this paper. The reason for the low predictive value of age is that all individuals are graduate students and so the span of ages is small. The clr-interaction tables for males and females are presented in Figure 2 for the purposes of comparison. As can be observed, the clr-interaction tables for both sexes are very similar, although it is evident that women have less extreme opinions than men. Item 6, "interest in protecting the couple's sexual health", is an exception to this rule as females have a better feeling about using the condom than males. Similarly, it is interesting that more males than females believe that the contraceptive and the morning after pills increase women's feelings of pleasure.
Associations between different perceptions of protective methods' effectiveness for different items
Two parts of a composition are linearly associated if their values across the sample are proportional. A variation matrix is useful to understand the associations in a survey (Egozcue, Lovell, & Pawlowsky-Glahn, 2013; Lovell, Pawlowsky-Glahn, Egozcue, Marguerat, & Báhler, 2015; Egozcue, Pawlowsky-Glahn, & Gloor, 2018). Association is measured as being inversely proportional to the variance of the corresponding log-ratios, i.e. for some pairs of cells X ij , X ki . If

then the association between cells X ij and X kl could be strong. The degree of linear association for the cells in the 30 x 30 table is visualised in Figure 3. It shows, as expected, strong associations of P1 (protects against STI) with P2 (protects against pregnancies), P5 (protects against AIDS) and P6 (evidence of interest in protecting partner's health). The same happens with C7 (increases male pleasure) and C8 (increases female pleasure).
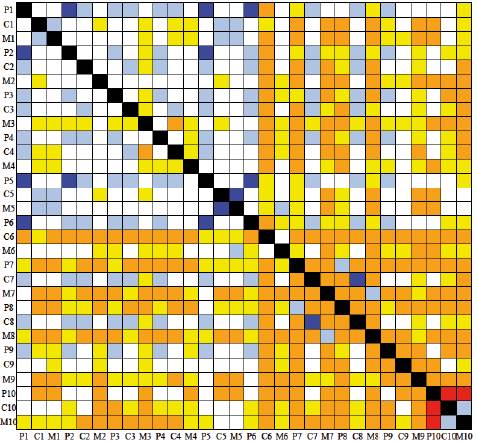
Figure 3 Heatmap of variation matrix. Colors describe importance of association (A). Red: No A. Orange: negligible A. Yellow: very low A. White: low A. Pale blue: weak A. Dark blue: strong A.
There are also strong associations between P2 (protects against pregnancies) and P5 (protects against AIDS), as well as between P6 (evidence of interest in protecting partner's health) and P5 (protects against AIDS), which also appear to be associated in the Figure 3 heatmap. This does contradict the results in Figure 1, where interactions have the opposite sign. The interaction points out that a prophylactic's protective value against AIDS is better perceived than against pregnancy, and the association between P2 and P6 indicates there is a good/weak perception of both protective measures which is coupled. Therefore, a possible interpretation is that the score assigned to P2 and P6 measures the perception of "protection'', independently of what it is protecting against. Another intense correspondence can be observed in the evaluation of the contraceptive pill (C5) and the morning after pill (M5), with respect to their low protection against AIDS/STIs.
College students, in general, coincide in their positive evaluation of the condom essentially as protection against STIs/AIDS and unwanted pregnancy, not only for their own benefit, but also for their partner's.
Visualization: CoDa-biplot
A biplot is a two-dimensional projection of the variables and data points of a data set. When used with compositional data, the data set is first clr-transformed and then centered so that clr-variables are jointly represented with the data points (Aitchison, 1983; Aitchison & Greenacre, 2002). In this paper, the mean table obtained in the survey is taken as a compositional data set, where the three methods P, C, M are the compositional parts and the situations in which they are evaluated are realizations of the composition. The form biplots shown in Figures 4 and 5 are designed to show the Aitchison distances between situations. In our case, Aitchison distances are exactly represented in two dimensions as the (P,C,M) compositions are in a 3-part simplex. Moreover, the size of the red rays, which corresponds to the centered clr-variables, represents how well they are incorporated in the biplot. In this 2-dimensional case, the clr (P,C,M) are equally and exactly projected in the biplots. Comparing the biplot in Figure 4 with the clr-interactions in Figure 1 and the associations in Figure 3, we can observe that, following the arrow corresponding to P, items (points) 1 and 5 are close together, as are items 7 and 8 at the other end, which means we can visualise the sign of the interaction and the degree of association. The biplot shows that there is essentially a one-dimensional axis that classifies the items as the first principal axis explains 96.5% of the total variance. This can be identified with the balance 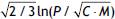 , which is parallel to it. Prophylactics (P) are positively perceived as the items are placed on the negative values of the principal axis, whilst items 7 and 8 (increase feelings of pleasure in males and females) are negatively perceived. The second principal axes is essentially dominated by the balance
  , but it has a small variability (3.51%).
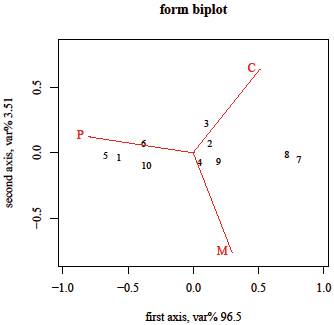
Figure 4 Form biplot of mean table. Points correspond to items in the survey, arrows to protective measures.
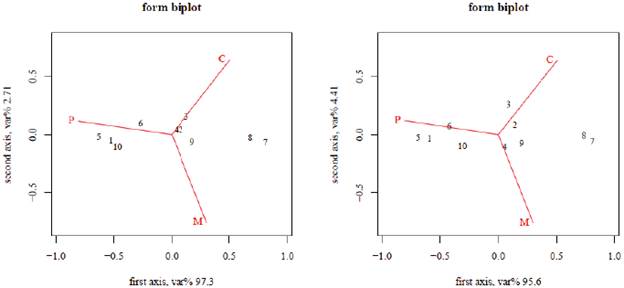
Figure 5 Form biplot of mean table. Points correspond to items in the survey, arrows to protective measures; males (left) and females (right).
The biplots by sex are shown in Figure 5. They are all very similar, although subtle differences can be observed. A global difference is that the second principal axis represents a larger percentage of variance for females (4.40%) than for males (2.71%); this indicates a greater differentiation in females' perception. For instance, items 2 (protect from pregnancy), 3 (provide peace during and after intercourse), 4 (are economically accessible), and 9 (are easy to use correctly) are more dispersed along the second axis for females as women are more direct users/consumers of contraceptives and morning after pills.
Conclusions
Condoms, in general, are very positively valued: (a) as protection against sexually transmitted infections/ AIDS, (b) for their lack of side effects, and (c) because of an interest in protecting the couple's sexual health. This is the opposite of what happens in the case of pills.
Hormonal methods are clearly more favorable than the condom regarding pleasure perception during intercourse, whereas the reverse occurs when it comes to feeling protected against STIs. However, it is also a positive point for the condom that it does not produce side effects and using one shows interest in protecting the couple's sexual health; this is contrary to what is observed in the assessment of hormonal methods. The results suggest that, in general, when confronted with the three possibilities, the participants' preferences are inclined towards the condom rather than the contraceptive pill and the postcoital pill; this is even more pronounced for men. This is observed in Figure 3, which suggests that the condom is perceived as a good protector against STI/AIDS for the individual and the couple as well as from unwanted pregnancies.
Examining results by sex, it can be observed that women's assessments are less extreme than men's in 5 of the 6 mentioned items, but are more pronounced when they consider that the use of the condom demonstrates interest in protecting the couple's sexual health. Results coincide with data on the use of the condom for college students in different countries (Grimley et al., 1995; Prat et al., 2016).
Survey data can advantageously be treated as compositional tables as the relevant information includes the ratios between the different responses and items.
Interactions between responses and items provide insights into the importance respondents give to the different possibilities.
Standard compositional data analysis tools are useful to detect and assess associations between items/ responses. The main tools are: CoDa-variation array (bivariate associations), CoDa-biplot, dimensionality reduction to data visualization, and decomposition of the mean compositional table into independent and interaction tables.
From a methodological point of view, the use of compositional methods provides us an insight into the interrelation between contraceptive methods and their perception in different circumstances. Although these interactions can also be examined with traditional exploratory methods, they frequently involve correlations that, when used with compositional data, are spurious (Aitchison, 1986) and can invalidate the analysis.

