


 Inglês (pdf)
 Artigo em XML
 Referências do artigo
 Enviar este artigo por email
 Citado por SciELO
  Citado por Google
  Similares em
SciELO
Similares em
SciELO  Similares em Google
 Permalink
In psychological and educational research with adolescents there is frequently a need for assessment of cognitive ability. This could be, for example, to compare groups who differ on some demographic factor or exposure to some experimental manipulation, or to examine correlations with grades, behaviour, or symptom scores etc.
There are several batteries of tests that can be used for such purposes, such as the ABCD Battery, which includes the NIH Toolbox cognitive tests (Luciana et al., 2018). Or, many researchers opt to use commercial intelligence tests such as the Wechsler Intelligence Scale for Children (WISC; Wechsler, 2004). Such batteries are highly developed, with good psychometric properties, standardized administration procedures, and extensive normative data. However, commercially produced cognitive test batteries have drawbacks in some research contexts. Firstly, because of the multiple tests involved, substantial professional training is required to administer and score them (generally precluding their use in student research projects). Secondly, they are very expensive to license, costing hundreds of dollars. Such prohibitive costs may impede research in many developing countries, where very limited research funding is available (Arnett, 2008). Thirdly, they are very time consuming, typically taking well over an hour to administer, one-to-one, for each research participant. Group administration is not possible.
There is clearly a role for such test batteries, but often their use is akin to ‘taking a sledgehammer to crack a walnut’. If the research question is not solely focused on a range of cognitive abilities, simpler, cheaper, and faster research methods could be employed, which give a measure of general cognitive ability.
General cognitive ability, also known as intelligence, has been envisaged in several ways. Most notably, the Cattel-Horn-Carrol framework, which is the most empirically supported theory of the overall structure of cognitive abilities (Flanagan & Dixon, 2014). This proposes a very broad and general intelligence ability which is involved in all cognitive processing. Below this, there are two different forms of cognitive processing, though closely related. These are fluid intelligence and crystalized intelligence. The Cattel-Horn-Carrol framework draws on the fact that performance of cognitive tasks are intercorrelated, giving rise to the crystalized and fluid factors, which are themselves positively correlated and linked by the general intelligence factor.
The positive manifold is useful to consider here. This is the highly replicated finding that when sets of very different cognitive tests are administered to a sufficiently diverse sample, all of the tests correlate positively and with large effect sizes (Kovacs & Conway, 2016). For an empirical demonstration of the positive manifold see Pluck and Cerone (2021). Thus, there is some general ability captured in all cognitive tests, a phenomena central to the Cattell-Horn-Carroll cognitive architecture (Flanagan & Dixon, 2014). There are alternative interpretations of the overall cognitive architecture, such as process overlap theory (Kovacs & Conway, 2016). That theory does not postulate a general intelligence, but does draw on the concept of domain general cognitive processing, and emphasizes the positive manifold, and so similar to the Cattell-Horn-Carroll framework, predicts that a general ability can be seen in a range of diverse cognitive tests.
In fact, intelligence tests such as the Wechsler scales are excellent measures of this general ability (Canivez, 2014; Canivez & Watkins, 2010), which is revealed as the g factor in factor analytic studies. In the cases of Wechsler batteries such as the WISC and Wechsler Adult Intelligence Scale (WAIS), multiple tests are included so that a very precise estimate of general cognitive ability can be made. Such precise IQ estimates can potentially be used to make diagnostic or educational placement decisions. In research, such precision is usually not required, but brevity and simplicity are. Fortunately, because of the positive manifold the general cognitive factor can potentially be measured with any single cognitive test, although admittedly, some are much better measures than others.
In fact, at the group level, the best single measure of general cognitive ability is vocabulary (Gignac, 2006; Jensen, 2001). It seems paradoxical that such a specific skill of crystalized, learnt, knowledge is highly associated with all other cognitive abilities. But studies show that it is highly correlated with various non-verbal cognitive tasks, including general knowledge, visuospatial processing, psychomotor speed, and working memory (Pluck, 2020). This pattern of associations is explained by investment theory, which argues that accumulation of crystalized knowledge, such as vocabulary, is a consequence of how efficient the other, more fluid, cognitive systems are (Cattell, 1987). Vocabulary, then, can be used as a strong proxy measure of cognitive ability in general.
Nevertheless, this has its own drawbacks. Vocabulary is culture-specific, so cannot easily be used to compare cognitive function across cultures, and, in fact, vocabulary tests would have to be validated anew for every language context in which they might be used. Furthermore, it is not simply a matter of translation as consideration of contextual and cultural issues is also important to test adaption (Elosua et al., 2014). Also, vocabulary only reflects general cognitive ability (Cattell, 1987). It will not accurately measure general cognitive ability of participants who have received unusually low exposure to language. In such cases, measuring vocabulary will likely underestimate true general cognitive ability.
The alternative has been to use supposedly ‘culture free’ tests (e.g., Cattell, 1973). These usually involve visuospatial reasoning tasks. Raven’s Matrices (Raven et al., 1998) type tests have been particularly popular, and similar matrix reasoning tasks are now included in recent versions of the Wechsler intelligence scales (Wechsler, 1999, 2004, 2012). They are included because such matrix reasoning tasks are highly loaded on general cognitive ability. By that we mean that they intercorrelate highly with other cognitive tests (i.e., they strongly demonstrate the positive manifold), and the g factor when it is extracted by factor analysis of the whole set of tests. There are, nevertheless, drawbacks to reliance on visuospatial reasoning tasks to measure general cognitive ability. Firstly, they clearly focus on a single very specific reasoning skill, and they do not measure crystalized ability at all. Ideally, a simple measure of general cognitive ability would include measures of both fluid and crystalized performance. This would accord with the aforementioned, widely accepted and highly supported psychometric theory of cognitive abilities proposed by the Cattell-Horn-Carroll framework (Flanagan & Dixon, 2014), which proposes fluid and crystalized components of a higher level single, general, cognitive ability.
There is a recently developed measure of general cognitive ability for adults that does just this, and avoids many of the pitfalls of other cognitive assessments. The Matrix Matching Test is free to use, and can be downloaded from https://gpluck.co.uk. The test is simple to administer (in about 10 minutes). It contains two sets of items, one of which, the semantic set, appears particularly sensitive to crystalized intelligence, and the other, the visuospatial set, particularly sensitive to fluid intelligence (Pluck, 2019), as described in the Cattel-Horn-Carrol framework. The semantic items require knowledge of concepts in order to spot similarities. In the adult sample, on which the Matrix Matching Test was initially validated, the semantic items correlated highly with measures of crystalized intelligence. The visuospatial items do not require any prior knowledge, and are similar to visuospatial reasoning tasks in existing matrix reasoning assessments, such as in the WAIS-IV (Wechsler, 2012), or Raven’s Progressive Matrices (Raven et al., 1998), and indeed they correlated most highly with measures of fluid ability on the WAIS-IV. However, the overall measure, as a total score, was found to load highly on a single general factor, consistent with the general intelligence factor of the Cattell-Horn-Carroll framework.
The set of semantic items, which we argue are sensitive to crystalized ability, would be expected to be quite stable in adulthood, but fluid abilities would gradually decline (Park, 2000). In adolescence, both would be expected to improve with increasing age due to development factors, and education exposure, which would particularly drive the development of crystalized ability (Raven, 1936).
The Matrix Matching Test does not require any particular language for administration. It uses the familiar administration method of other matrices tasks, but includes both visuospatial and semantic reasoning tasks. Here, we show that the Matrix Matching Test is also a valid measure of general cognitive ability, and also statistically reliable, in a sample of adolescents, aged 12-17. We demonstrate reliability through examination of the internal consistency and test-retest reliability. We demonstrate validity by showing that scores substantially correlate with standard measures of fluid and crystalized cognitive ability, and that individual items appear to function in the same way as they did for adults in the original validation study. We also show the test’s concurrent criterion validity in its ability to distinguish between a psychosocial deprived group (adolescents in foster care who have had limited access to formal education) and age-matched control adolescents recruited in schools.
Method
Participants
Two different samples were opportunistically employed to assess reliability and validity of the Matrix Matching Test in adolescents. The test was added to the assessment battery of two other on-going studies with adolescents, in Quito, Ecuador.
Firstly, we included the Matrix Matching Test in the second phase of data collection of a study that examined cognitive functions in relation to socioeconomic status in a sample of adolescents selected to be more or less representative of the life contexts of adolescents living in Quito, Ecuador (Pluck, Cordova, et al., 2021). In one part of that report, 27 adolescents were asked to be part of a test-retest study. Demographics of this sample are: mean age = 15.96 (SD = 1.45, 95% CI = 15.1 - 16.7), female = 9/27 (33%, 95% CI = 15% - 52%), Mestizo ethnicity = 21/27 (78%, 95% CI = 63% - 93%), Afroecuadorian ethnicity = 5/27 (18%, 95% CI = 7% - 33%), mixed ethnicity = 1/27. Educational levels of the parents were recorded: for the fathers, six had postgraduate level, and eight had bachelor’s degrees or similar, but seven had not completed high school. A similar pattern was observed for the mothers, four had postgraduate qualifications, six had bachelor’s degrees or similar, but seven had not completed high school.
Recruitment of these 27 participants was from appeals on social media (n = 9), first year college students (n = 8) and from a charitable service providing sports education to socioeconomically disadvantaged youth (n = 10).
The reliability data from that has already been reported for several cognitive tests, however, participants were also administered the Matrix Matching Test, as a measure in test development; the data from which is reported here for the first time. Only 21 of those 27 returned for the follow-up appointment. Consequently, we have Matrix Matching Test data from 27 adolescents, and for 21 of them, test-retest data.
Secondly, the Matrix Matching Test was included in a study of 40 adolescents living in foster care group homes (mean age 15.80 years, SD = 1.23, 95% CI = 15.4 - 16.2). Of that sample, there were 18/40 females (45%, 95% CI - 28% - 61%). The majority, 33/40 (83%, 95% CI = 70%-93%) identified as Mestizo, and 5/40 (13%, 95% CI = 3% - 23%) identified as Afroecuadorian. Two identified as White. These individuals were recruited from five different foster group homes around Quito. There were 65 potential recruits, however four were outside our age-range criteria, and one had pre-diagnosed learning difficulties (also an exclusion criteria). A further exclusion criterion was sensory disability, but this was not an issue in any case. Six declined to participate, and the remainder were not recruited because they were not available on data collection visit days. The mean years spent in foster care was 7.0 (range 1 - 12). The reason for being in foster care was available for only 31/40 cases. This was taken from carer information, with categories overlapping: parental substance abuse (n = 5), parental abandonment or death (n = 13) and caregiver negligence (n = 20), abuse (n = 19).
As a control to the 40 adolescents living in foster care, a sample was of 44 adolescents (mean age = 15.94 years, 95% CI = 15.5 - 16.3, SD = 1.27), 24/44 females, 55%, 95% CI = 41% - 67%) was recruited from two different state-run schools, in Quito. Regarding ethnicity, 40/44 (91%, 95% CI = 82% - 98%) identified as Mestizo, two identified as White, one as Indigenous American, and one as Afroecuadorian.
The main data from this study is, as yet, unpublished. The 84 participants from the Foster Study were added to the 27 cases from the SES Study, giving a combined sample analysed in this report of N = 111. The mean age of this combined sample was 15.90 (SD = 1.45, range 12 - 17), and the dispersion of scores was found to be within the limits of a normal distribution based on skew and kurtosis (Kim, 2013). Regarding gender, 51 (46%) identified as female, which is slightly less than would be expected for the country as a whole, and for ethnicity, 94 (85%) identified as Mestizo, 11 (10%) as Afroecuadorian, 4 (4%) as White, and the remaining two participants as Indigenous American, and mixed race. All spoke Spanish as their principal language. That combined sample was used for most of the analyses reported in the Results section; however, for some correlations, data was only available on subsets of participants, as some of the cognitive assessments in the two different studies (the SES Study and the Foster Study) were not the same. Where analyses were conducted on subsamples, this is clearly stated and the number of participants and basic demographics of the subsamples are reported.
Measures
Grade Point Average data (GPA) was requested from the schools for all the control participants in the Foster Study. This was the cumulative GPA representing all courses completed in the school. The GPA system used in Ecuadorian schools ranges from 0 to 10 (best). In addition, we assessed all participants with the relatively new Matrix Matching Test, and subsets of participants were assessed with standard measures of general cognitive ability (WISC) for comparison.
Matrix Matching Test
This was designed as an easy to administer and brief measure of intelligence or general cognitive ability (Pluck, 2019). It uses the method used in other matrix reasoning tasks in which a set of images that follow a pattern are presented, and a gap is indicated. The participant is then required to select from an array of images, only one of which is correct in that it conforms to the pattern (Cattell, 1973; Raven et al., 1998; Wechsler, 1999; 2004; 2012). The Matrix Matching Test presented here has two components: 12 trials of visuospatial reasoning, graded from rather simple to complex, and 12 trials of semantic reasoning, again graded from simple to complex; 24 trials in total. As an example, in one of the visuospatial items, there is row of 9 shapes: alternating large red and small yellow circles. One of the shapes is obscured by a white box containing a question mark. The participant must choose from six different options (e.g., small yellow circle, small red circle, large red circle), only one of which maintains the pattern.
The semantic reasoning tasks have the same format as the visuospatial reasoning tasks; for example, a set of images showing four images of female faces, with one obscured by the white box and question mark. The participant must choose from an array of options which are all human faces, but only one is female, and therefore maintains the pattern.
All trials are administered, and each trial answered correctly is awarded one point, the potential score range is therefore from 0 to 24. All 24 trials are presented in a PowerPoint file on a tablet computer. Responses are recorded by the researcher by hand. None of the materials presented to the participant contain any written language, or require any particular language. The individual visuospatial trials are all based on geometrical shapes or different colours, sizes, brightness etc. The semantic matching trials use colour photographs, which were selected to minimize cultural biases. For example, where people are shown, they are from a range of different ethnic backgrounds. There is no time limit on how long research participants may spend on individual trials.
It has previously been shown that in adults the Matrix Matching Test has acceptable internal consistency (a = .75) and test-retest reliability (r = .93), as well as validity as a measure of general cognitive ability, demonstrated by its high correlation with full-scale WAIS-IV IQ scores (r = .89) and university student grades (r = .40).
Established measures of general cognitive ability
The Matrix Matching Test evaluated here was compared with established measures of cognitive ability. These were two subtests from Wechsler Intelligence Scale for Children IV - Spanish Edition (WISC-IV; Wechsler, 2004). The two tests were Vocabulary and Matrix Reasoning. These are the two subtests from the WISC-IV that have the highest loading on the general cognitive factor (Canivez, 2014). Matrix Reasoning is considered to be the best Wechsler subtest for measuring fluid cognitive ability, and Vocabulary the best test for measuring crystalized ability, based on loadings on the respective factors in factor analytic studies (Gignac, 2006).
For this reason, they are the two tests used to measure general intelligence of children and adults in the most brief version of the Wechsler scales, the Wechsler Abbreviated Scale of Intelligence (Wechsler, 1999).
Procedure
In each study, participants were assessed in one-to-one sessions with a research assistant, under supervision of a doctoral-level neuropsychologist. In each session, a range of cognitive tests were administered. For all participants, this included the Matrix Matching Test. Tablet computers with 10-inch screens were used to display the task materials in a PowerPoint file. There were no time limits, and all trials were administered to all participants.
Visuospatial trials were administered first. As per the standardized instructions for the task, the requirements were explained to the participant and one example trial was performed before the main 12 data trials. One point was awarded for each trial completed correctly. If a zero score was recorded on one of the first three trials, feedback on the error was given, and the correct response explained. However, no feedback was given on trials 4 - 12. The same procedure was used for the 12 semantic trials, that is, one unscored practice trial, followed by the 12 actual trials, with feedback about errors only on the first three trials. The researcher recorded the trial-by-trial responses made and scores achieved on paper.
In the SES Study (n = 27), participants also performed the WISC-IV Vocabulary test, with stimuli displayed on the same tablet computer, and scored by hand. The participants in the Foster Study (n = 84) completed the WISC-IV Matrix Reasoning task, again with materials displayed on the tablet computer and scored by hand. Each study sample performed other cognitive tests not-reported here, with the entire test sessions taking about 50 minutes. The tests were administered in quiet rooms, at the schools where the adolescents studied, at their homes, or in an interview room at a university. The adolescents in the Foster Study were assessed only once. The adolescents in the SES Study were asked to return after four weeks to complete the tests again (for the purpose of establishing test-retest reliability). Upon completion of participation, all the adolescents were thanked for their assistance and debriefed about the research, and were able to ask questions. All participants in the single session Foster Study we given a gift of stationary worth about US$1.50. In the SES Study which involved two test sessions, those who returned were rewarded with a gift of stationary worth approximately US$10.
Research ethics
For all participants, written informed consent was provided by a parent or legal representative. In addition, the participants provided written, informed assent to participate. The research protocols were approved by the Comité de Bioética at Universidad San Francisco de Quito, a nationally recognized research ethics committee, and the research was conducted in accordance with guidance on research provided by the American Psychological Association and the Declaration of Helsinki.
Statistical Methods
Raw scores were analysed, given that normative data for the different scales is not available for Ecuador. However, age was accounted for in all relevant analyses via covariance or age adjusting scores with linear regression. Between-group analyses used ANOVA with effect sizes given as partial eta squared (ηp2), or Mann-Whitney U tests for data that was not normally distributed (with effect sizes given as absolute score differences). Correlational analyses were with Pearson r tests, but with Rankit transformation for any data that was not normally distributed (Bishara & Hittner, 2012). For mean scores and r values, 95% confidence intervals were estimated by bootstrapping with 1,000 iterations. All analyses were two-tailed with a significance threshold of .05. SPSS V23 was used for all statistical tests.
Results
Differential item functioning
Individual scores from the full sample of adolescents (N = 111) was compared to that of the original validation sample composed of 176 adults previously reported (Pluck, 2019) in order to detect differential item functioning (DIF). A regression-based method was employed, described in Zumbo (1999). To avoid misleading results produced by regression on very small samples, only test items in which there were at least 10 participants scoring correctly or incorrectly in both groups were analysed for DIF. The effect sizes were the change in Nagelkerke R2 values, indicating combined uniform and non-uniform DIF. Under the criteria suggested by Zumbo (1999), none of the items would be considered to show any more than negligible DIF. However, with the less conservative effect size criteria supplied by Jodoin and Gierl (2001), one of the visuospatial items, and two of the semantic items, could be considered to have moderate DIF between the adult and adolescent samples. Those three items were investigated further. All three correlated highly and positively with the overall scale total score in both adolescent and adult groups (r values range = .43 - .58), indicating that they appeared to measure the same latent construct in both samples. Furthermore, they were not systematically biased to one group: two items were performed better, and one worse, by the adolescents, compared to the adults. Consequently, as theses were only moderate levels of DIF and were not systematically biasing the scale, they have been maintained.
Data distributions
The raw scores on the Matrix Matching Test for the full sample (N = 111), ranged from 4 to 21 giving a score range of 17 points, with no ceiling or floor effects. The potential maximum score is 24. The mean score was 14.87 (SD = 3.43, 95% CI = 14.24 - 15.48), and the median was 15.00. That the two measures of central tendency are so close suggests little skew within the distribution. Indeed, the z score of the skew statistic at -1.79, as well as for the kurtosis at 0.89, are well within the limits for considering the data to be normally distributed (Kim, 2013). The distribution of total raw scores on the Matrix Matching Test is shown in Figure 1. In addition, mean scores and distribution statistics of all the cognitive measures are shown in Table 1. The only measure that appeared to be not normally distributed was the WISC-IV Matrix Reasoning test.
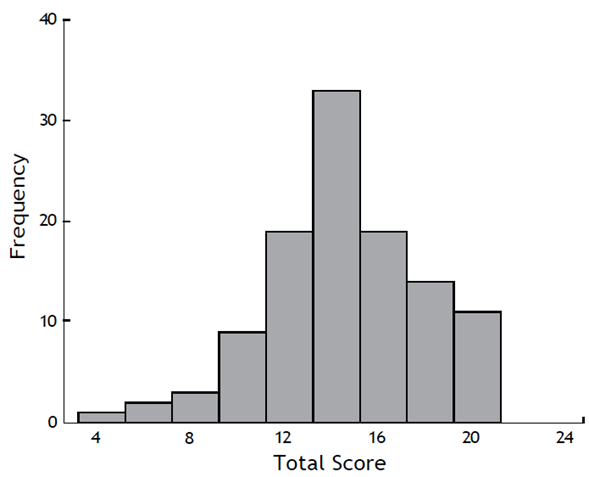
Table 1 Raw score means, distributions, and reliability statistics for the different cognitive measures employed and GPA
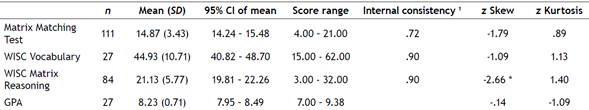
* Differs significantly from expected for a normal distribution based on Kim (2013), 1 For scales with binary scored items, they are estimated with Kuder-Richardson Formula 20 values, and for scales with ordinal scores, as Cronbach’s alpha.
Internal consistency and dimensionality
In the next step we examined the internal consistency with the Kuder-Richardson Formula 20 values of all 24 items of the Matrix Matching Test. The observed value was .72, which would be considered a ‘respectable’ level of internal consistency (DeVellis, 2003). This appears to be somewhat lower than the values observed for the two WISC-IV tests (see Table 1); however, that likely reflects, in part, that the Matrix Matching Test has fewer trails then they do. Kuder-Richardson Formula 20 values, and their continuous variable equivalent- Cronbach’s a values, are known to increase with the number of items analysed (Tavakol & Dennick, 2011), and there are 36 in the WISC-IV Vocabulary test and 35 in the WISC-IV Matrix Reasoning test, approximately 50% more than the 24 trials in the Matrix Matching Test. We also found that the two subcomponents of the Matrix Matching Test, visuospatial and semantic, correlated well at r = .47, p < .001 (95% CI of r = .29 - .62). In that calculation, a partial correlation was used to control for age as a potential general development factor that could produce a false impression of association.
Dimensionality was investigated by examination of the mean inter-item correlations. If a set of items are unidimensional, then the mean of all the inter-correlations should be above .15 for a broad concept (Clark & Watson, 1995), although it has been argued that below .10 is the threshold for a scale lacking unidimensionality (Briggs & Cheek, 1986). A further criteria is that if a scale is unidimensional, the distribution of inter-item correlation r values will be unimodal and approximately normally distributed (Piedmont & Hyland, 1993). Bidimensionality would be expected to produce bimodal or positively skewed distributions, and higher numbers of dimensions would be expected to produce strongly positively skewed distributions.
We found that for the 12 semantic items, the mean inter-item correlation was .11, slightly lower than the target threshold for unidimensional scales, of .15. However, lower values are expected with broad concepts (Clark & Watson, 1995), and this may be acceptable given the broadness of the concept of ‘general cognitive ability’, and it is still above the threshold beyond which unidimensionality is doubtful (Briggs & Cheek, 1986). Moreover, the distribution of inter-item r values was unimodal, and approximately normally distributed based on examination of the frequency distribution and Q-Q plots. The standard value for skewness was .12 which is consistent with only minimal skewing. A very similar pattern was found for the visuospatial items, this time the mean inter-item correlation was slightly higher, at .12. The frequency distribution of inter-item correlations was again unimodal and approximately normally distributed, based on examination of frequency distribution and Q-Q plots. Skewing was again minimal with a standard value of -0.12. The analyses are consistent with both scales being more or less unidimensional. We argue that in both cases that dimension is general cognitive ability. We also analysed all 24 items together, if they are measuring different latent variables, then the criteria used will be violated. The mean inter-item correlation value was slightly above the threshold for doubting unidimensionality at .10, and the frequency distributions and Q-Q plots suggested a normal distribution. This time there was more skewing, with a standard value for skew of -0.72, but still rather low. Finally, all three distributions were assessed with Kolmogorov-Smirnov tests, which indicated no significant deviation from normal distributions (all p > .20).
Test-retest reliability
Twenty-one participants from the SES Study sample were assessed with the Matrix Matching Test on a second occasion. The mean age of this subsample was 16.27 (SD = 1.90, range 12 -17) and 8/21 (38%) were female. The mean number of days between test and retest was 33.71 (SD = 7.88, range 21 - 54). Test and retest assessments were always performed in the same room, and 19/21(90%) of the participants were assessed by the same researcher at both sessions. The partial correlation between the two sessions, controlling for age, was r = .88, p < .001 (95% CI of r = .70 - .96), suggesting ‘very good’ reliability (DeVellis, 2003). The mean score at test was 15.57 (SD = 3.56) and at retest it was 16.62 (SD = 3.44), a significant increase, F(1,19) = 4.68, p = .043, ηp2. This effect size indicates a medium to large practice effect on the Matrix Matching Test, which suggest it should only be used for repeat testing with caution.
Associations with demographics
In the full sample (N = 111) total Matrix Matching Test scores were positively and significantly correlated with age, r = .22, p = .021 (95% CI of r = .06 - .37). However, the semantic items had a larger association, r = .31, p = .001 (95% CI of r = .13 - .47), than the visuospatial items, r = .07, p = .477 (95% CI of r = -.10 - .22). This is likely explicable by the semantic items drawing much more on acquired crystalized knowledge that is developed through exposure to culture, and particularly formal education. We also explored whether age and gender might associate with total Matrix Matching Test scores, using multivariate linear regression to predict the combined variable of visuospatial and semantic subtest totals on the Matrix Matching Test. Age was found to be a significant predictor of the combined performance variable, F(2,107) = 4.30, p = .004, ηp2 = .099. However, gender was not a significant predictor, F(2,107) = 2.96, p = .056, ηp2 = .052. The data distributions of the model residuals did not differ from a normal distribution based on skew and kurtosis.
For the SES Sample (n = 27), years of education was not recorded. However, it was in the Foster Sample (n = 84). The distribution of years of education was found to differ from that expected from a normal distribution. Partial correlations controlling for age confirmed that years of attended formal education was significantly correlated with total scores (r = .43, p < .001, 95% CI of r = .21 - .61). And that the association of education with visuospatial item scores (r = .32, p = .003, 95% CI of r = .10 - .54) was lower than that with semantic item scores (r = .41, p < .001, 95% CI of r = .20 - .58). Analysis of the regression model producing the partial correlations revealed that the distributions of the residuals did not differ from the normal distribution.
Limiting analyses to the Foster Study sample, as a group, those living in foster care (n = 40) had a similar mean age of 15.80 years (SD = 1.23) compared to the mean age of their matched control group (n = 44) of 15.94 years (SD = 1.27). Despite this, the foster care group reported fewer years of formal education (median = 9, range 0 - 12) compared to their control group (median = 11, range = 9 - 14), a significant difference, Mann-Whitney U test = 4.78, p < .001, absolute median score difference = 2. Correspondingly, for total Matrix Matching Test scores, the foster group scored a mean of 13.50 (SD = 3.68), which is significantly below the level of the control group mean score of 15.93 (SD = 2.90), F(1,81) = 10.98, p = .001, ηp2 = .119 (age covaried). Nevertheless, when years of formal education is entered as an additional covariate, the between-group difference is no longer significant, F(1,80) = .97, p = .327, ηp2 = .012 (the residuals from this GLM model were normally distributed).
To summarize the demographic findings, Matrix Matching Test scores are sensitive to the differences between an adolescent group who have suffered psychosocial deprivation and a matched control group. This difference would be expected based on previous research suggesting delayed cognitive development associated with psychosocial deprivation (Fry et al., 2017; Pluck et al., 2018). We also found that the difference was statistically accounted for by differences in past access to formal education, consistent with our observations that Matrix Matching Test scores are positively correlated with years of education (controlling for age). This is also as would be expected, given that cognitive test scores are robustly associated with the number of years spent in formal education (Ritchie & Tucker-Drob, 2018). The Matrix Matching Test between-group significant difference and associations with years of education therefore provide an element of concurrent criterion validity. We also found that Matrix Matching Test scores are dependent on age, most likely due to maturational factors and opportunity for education. To prevent this effect producing false positive associations, age adjusted scores for all cognitive measures were produced using linear regression, and these adjusted scores are used in all of the later correlations used to establish psychometric validity. As the Matrix Matching Test has two components, visuospatial and semantic, and these had somewhat different associations with age, separate age adjusted scores were calculated for each component and these were summed to produce the age-adjusted total Matrix Matching Test score.
Validity
Within the SES Study sample, all 27 participants completed both the Matrix Matching Test and the WISC Vocabulary test (mean age 16.00, SD = 2.00; 9/27 females, 33%). Within the Foster Study sample, all 84 participants (mean age = 15.9, SD = 1.27; females 42/84, 50%) completed both the Matrix Matching Test and the WISC Matrix Reasoning test. Within the control participants of the Foster Study (n = 44) we were able to obtain the GPA data for 27 participants (mean age = 16.39, SD = 1.10; 16/27 females, 59%). Data on 18 participants is missing as it was not supplied to us by the school. Mean and data distribution statistics for GPA are shown in Table 1. The correlations of the Matrix Matching Test with standard cognitive measures and GPA are shown in Table 2. These correlation validity r values would all be considered qualitatively ‘large’ effects (Gignac & Szodorai, 2016).
Table 2 Correlations between the total scores on the Matrix Matching Test and standard cognitive measures from the WISC and GPA
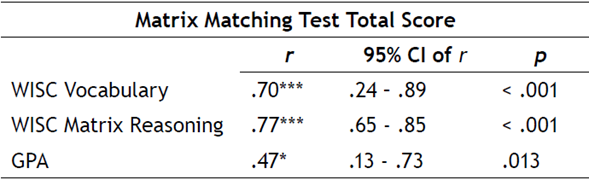
In summary of the validity studies, we have shown that the Matrix Matching Test has convergent validity by its correlations with measures of both fluid reasoning ability (WISC-IV Matrix Reasoning test) and crystalized lexical knowledge (WISC-IV Vocabulary test). Furthermore, we show that it has criterion validity in its ability to predict academic achievement, as shown by its large correlation with GPA scores.
Discussion
The Matrix Matching Test appears to have acceptable psychometric reliability, and validity as a measure of general cognitive ability in adolescents aged 12-17. In fact, its properties in this age range are similar to the previous report of its reliability and validity in an adult sample (Pluck, 2019).
Reliability in the form of temporal stability is crucial to tests in which traits, as opposed to states, are to be measured. General cognitive ability, usually measured in terms of ‘intelligence’ is known to be a stable trait, and in fact, one remarkable study has shown a high correlation (r = .73) between tests, even with a 66-year delay (Crawford et al., 2001). The fact that we report a high correlation (r = .86) between test and retest for the Matrix Matching Test is important because reliability necessarily places an upper limit on test validity. Furthermore, such reliability cannot be assumed, some cognitive tests, particularly of executive functions, have very poor test-retest reliability (Pluck, Amraoui & Fornell-Villalobos, 2021), which raises questions about their ability to measure higher-level cognition.
Fortunately, the Matrix Matching Test appears to be rather stable, in that people who score highly on one occasion are very likely to score highly on other occasions. Nevertheless, there is a medium-to-large practice effect, which precludes repeat testing. This may be caused partially by the feedback given to participants who make errors on any of the first three trials in each section. This feedback is given to prevent participants continuing through the test, even if they have not comprehended the task rules. However, errors on those early items are quite rare and cannot be responsible for all of the score increases between test and retest.
This increase in scores with repeat testing would be problematic if the test were intended for clinical or educational use, when repeat testing is often informative; for example, to measure recovery or decline of ability over time. However, the Matrix Matching Test is intended only as a research tool, in which cross-sectional assessment is more common. This is also why normative data is not necessary. For clinical and educational purposes, comparison of an individual to the ‘norm’ is often desirable to evaluate abnormality of performance. However, in research, between-group comparisons, regressions and correlations are much more common, for which normative data is not required. Covariates in ANOVA models, regression models and partial correlations can be used to control for age as a developmental factor if required. Where age correction of raw scores is desirable, a method for this is explained in Pluck (2019).
That the Matrix Matching Test is reliable, we can also add that it has concurrent criterion validity, in that it is sensitive to performance differences between a psychosocially deprived adolescent group and their control group. That is, adolescents living in foster care performed significantly below the level of the control adolescents, consistent with evidence on the detrimental effects of such psychosocial deprivation on cognitive development (Fry et al., 2017; Pluck et al., 2018). We have also shown that this effect is mainly driven by the foster care group having had less exposure to formal education than the control group. It would be interesting to replicate this finding more formally, as well as to examine other factors; in particular, the opportunities available to children and adolescents in foster care in different contexts, such as urban and rural settings.
More directly, we also showed that Matrix Matching Test scores correlate positively, and with large effects, with standard measures of both crystalized (Vocabulary) and fluid (Matrix Reasoning) aspects of general cognitive ability. The choice of comparison tests here is important, as they are considered the best available performance tests of crystalized and fluid general cognitive skill, based on factor analytic studies that have shown that those are the tests that load most highly on the crystalized and fluid factors (Canivez, 2014; Gignac, 2006; Wechsler, 1999). Crystalized and fluid cognitive ability are generally considered to be the two most basic forms of cognitive processing below the general cognitive ability, or g factor, in the widely accepted and well supported Cattell-Horn-Carroll theory of cognitive abilities (Flanagan & Dixon, 2014).
In addition, a common psychometric technique used to validate general cognitive ability tests, such as intelligence assessments, is to look for correlations with real-life performance, particularly in education. We also provide this evidence of validity for the Matrix matching Test, as the scores correlate positively, and again with a large effect size, with GPA.
Historically, psychology research has been dominated by research from developed, English speaking counties (Arnett, 2008). Thus, typical research participants are said to be WEIRD, that is, from Western, Educated, Industrialized, Rich, and Democratic countries (Henrich et al., 2010), meaning that they fail to represent the global human population. The reasons for this are complex, but access to valid and reliable assessment tools in non-WEIRD countries is a large part of the problem. The Matrix Matching Test is an attempt to address this. The test was developed in a non- WEIRD context (a Latin American country), and is designed to be relatively culture free so that its use could be explored in other contexts around the world. No specific language is needed in order to perform the test. Furthermore, the Matrix Matching Test is free to use. The materials for application have been kept deliberately simple in order to allow adoption in resource-limited contexts. The stimulus material can be downloaded as a PowerPoint file, and scoring is done by hand.
Nevertheless, some limitations of the research should be acknowledged. The sample employed was obtained opportunistically, and so it is not necessarily representative of the population of adolescents in low- and middle-income countries, nor indeed, Ecuador. The aim was to present preliminary evidence of validity and reliability in an adolescent sample. The user of the Matrix Matching Test should count on their professional skills in order to decide whether or not the test is valid in the research context in which they intend to apply it.
In summary, we provide preliminary evidence that the Matrix Matching Test is a reliable and valid measure of general cognitive ability in adolescents. This could potentially be useful for research in which a simple, cost-free measure of cognition is required.

