


Services on Demand
Journal
Article
 English (pdf)
 Article in xml format
 Article references
 Send this article by e-mail
Indicators
-
 Cited by SciELO
 -
 Access statistics
Related links
-
 Cited by Google
 -
 Similars in
SciELO
Similars in
SciELO -
 Similars in Google
Share

 Permalink
Revista Colombiana de Ciencias Pecuarias
Print version ISSN 0120-0690On-line version ISSN 2256-2958
Rev Colom Cienc Pecua vol.22 no.1 Medellín Jan./Mar. 2009
Artículos originales
GEPRO: Gene Expression Profiler for DNA microarray data ¤
GEPRO: Analizador de Expresión Genética para datos provenientes de microarreglos de DNA
GEPRO: Analisador de Expressão Gênica para dados provenientes de microarranjos de DNA
Beob G Kim1*, Animal Science, PhD; Merlin D Lindemann1, Animal Science, PhD; Phillip J Bridges2, Animal Science, PhD; CheMyong Ko2*, Biology, PhD.
1 Department of Animal and Food Sciences, University of Kentucky, Lexington, KY 40546, USA
2 Department of Clinical Sciences, University of Kentucky, Lexington, KY 40536, USA
(Recibido: 29 enero, 2009; aceptado: 12 febrero, 2009)
Summary
The DNA microarray technology has been widely employed in recent biological research. However, the unprecedented large amount of data produced by the technology has presented inevitable challenges to biological scientists, forcing individual researchers to take extensive training or rely on database specialists for the use of the data. Microsoft Excel® has a number of convenient functions and may be the most widely used spreadsheet package for data storage and manipulation. Therefore, we developed a userfriendly, Excel spreadsheet-based microarray data-managing program. The program, gene expression profiler (GEPRO), is designed to facilitate organizing miocroarray data, performing statistical analysis, and displaying the results. Using GEPRO’s filtering and sorting capabilities, a user can easily identify differentially expressed genes, display the expression profiles of the genes of interest, and present and save the analyzed data in a user-defined way. The versatility and utility of GEPRO should enable bench work researchers to maximize the use of their microarray data. The GEPRO is freely available for noncommercial users at http://www.mc.uky.edu/cls/ko/gepro1.html.
Key words: database, gene expression, microarray, Microsoft Excel .
Resumen
La tecnología de microarreglos de DNA es actualmente empleada de manera amplia en investigación biológica. Sin embargo, el manejo de la enorme cantidad de datos generados por la misma representa un desafió para los investigadores, forzándolos a invertir valioso tiempo en capacitación sobre dicho manejo, o a confiar el uso de la misma a especialistas en bases de datos. El programa Excel® de Microsoft, la hoja de calculo mas ampliamente utilizada a nivel mundial, que cuenta con muchas funciones útiles para almacenamiento y manipulación de datos, fue utilizado por nosotros para desarrollar una aplicación amigable para el manejo de datos generados por microarreglos de DNA. Nuestro programa, llamado “Gene Expression Profiler” (GEPRO), esta diseñado para facilitar la organización de datos de microarreglos, realizar su análisis estadístico, y presentar los resultados. Utilizando la posibilidad de filtrado y ordenamiento de datos que ofrece GEPRO, el usuario puede identificar fácilmente diferentes genes, observar los perfiles de expresión de los genes de interés, así como presentar y guardar los datos de diversas maneras. La versatilidad y utilidad de GEPRO ayuda a los investigadores a maximizar la utilización de sus datos de microarreglos. GEPRO es una aplicación gratuita, disponible para uso no comercial en http://www.mc.uky.edu/cls/ko/gepro1.html.
Palabras clave: bases de datos, Excel de Microsoft, expresión de genes, microarreglos.
Resumo
A Tecnologia dos Mircroarranjos de DNA é muito empregada em pesquisa biológica. Mas o manejo da grande quantidade de dados gerados é um desafio para os pesquisadores, os quais estão sendo forçados a realizar grandes investimentos econômicos e de tempo para sua capacitação ou em confiar em expertos da informática para analisar seus dados. O programa Excel® da Microsoft, amplamente utilizada no mundo foi utilizado para desenvolver uma aplicação amigável para o manejo de dados gerados por Mircroarranjos de DNA. O nosso programa, chamado “Gene Expression Profiler” (GEPRO), está desenhado para facilitar a organização de dados, permite realizar as respectivas análises estatísticas e apresentar os resultados. Utilizando a possibilidade de filtrar e organizar os dados que oferece GEPRO, o usuário pode identificar pares de genes, observarem os perfis da expressão dos genes de interesse, assim como a possibilidade de apresentar e salvar os dados de diferentes formas. A versatilidade e a utilidade do programa, ajuda aos pesquisadores a maximizar a utilização dos dados. GEPRO é uma aplicação gratuita para uso não comercial, disponível em http://www.mc.uky.edu/cls/ko/gepro1.html.
Palavras chave: bases de dados; Excel de Microsoft, expressão gênica, microarranjos.
Introduction
Improvements of nano-technology and biomolecular techniques have led to the development of microarray systems, which allow individual bench researchers to measure gene expression at the genome level. Accordingly, microarray technology has been widely employed in biological research in recent years. However, the nature of generating large data sets from individual microarray experiments has presented challenges for data collection, exchange, and analysis. Although there are now widely accepted formats for microarray data, because of the enormous data size of each microarray data set, it is difficult for an investigator to put the data together to build and populate large-scale databases (13).
While programs have been developed for the management of data, most of them require extensive knowledge of statistics and computer skills (4, 5, 15), which limits their value for some researchers. Therefore, user-friendly software has been awaited that would allow individual bench work researchers to manage their own microarray data. In an effort to disseminate and share microarray data via online, we recently built a web-based rat ovarian gene expression database (rOGED) that performs a key-word driven data search, execute a programmed statistical analysis and presents data as tables and graphs (7).
Now, we report the development of a Microsoft Excel® (www.microsoft.com) spreadsheet-based software tool with which a bench work researcher can easily build his/her own microarray database. The software, gene expression profiler (GEPRO), can perform statistical analysis, identify genes of interest, and present data in a user-defined format. The GEPRO was developed using Microsoft Excel mainly because of its familiarity to bench work researchers and its versatility. A variety of software tools built on Excel are currently being used in the areas of animal science (10), physiology (2), pharmacology (3), and GEPRO.xls with no special installation. When this biochemistry (14) as well as molecular biology in file is opened, a user needs to click on the Enable managing gene expression data (6, 8, 11).
Program description and sample run
The GEPRO source codes for all the modules have been written in Visual Basic for Application as an Excel XP add-in. A user can run the program file GEPRO.xls with no special installation. When this file is opened, a user needs to click on the Enable Macros button in a dialogue box. A flow chart illustrating the program is presented in figure 1. The GEPRO database set-up falls into four procedures: 1) data structure input, 2) microarray data input, 3) statistical computation, and 4) display as tables and charts on the main screen. The functions include search, filtering, sorting and chart exporting and are all performed on the main screen.
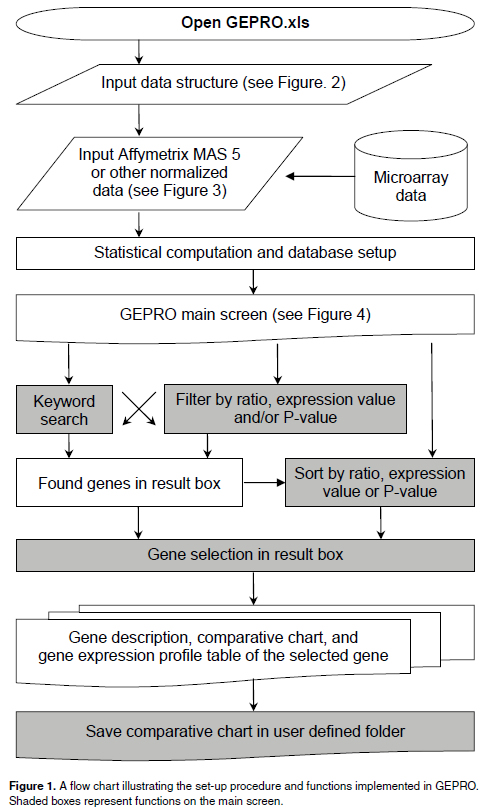
Data structure input
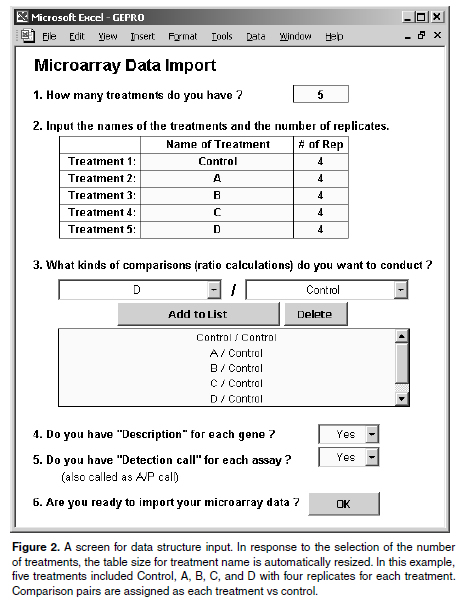
The first step of the GEPRO database setup is data structure input (see Figure 2). A user inputs the number of treatments, the name of each treatment, and the number of replicates for each treatment. The user then assigns the comparison pairs of treatments for expression ratio calculation and Studentâs T-test and provides input that indicates whether gene descriptions and detection calls are available.
When the user finishes this step by clicking the OK button, the program generates a spreadsheet for the microarray data input.
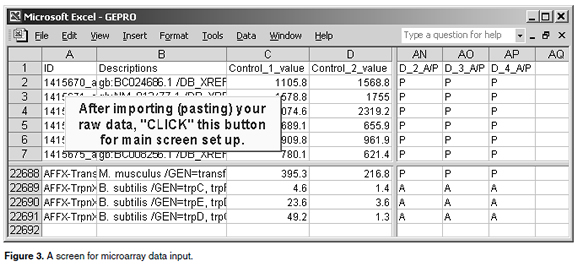
Microarray data input
An Excel spreadsheet for microarray data input is presented in figure 3. In this spreadsheet, the first row shows the title of each column including gene ID, gene description, and the name and replicate of treatment for the expression value and detection call according to the data structure input. Following the order of the columns, the user prepares microarray data in a spreadsheet, makes a copy, and pastes the data into the data input sheet of GEPRO.
Statistical computation
When a user clicks the button for main screen setup (see Figure 3), statistical computations are performed generating treatment means, standard errors, expression ratios between comparison pairs, p-values from unequal variance Studentâs T-test, and p-values from one way ANOVA tests. The treatment pairs for expression ratio and Studentâs T-test were assigned during the data structure input procedure. These statistics are tabulated on the main screen with a corresponding chart (see Figure 4).
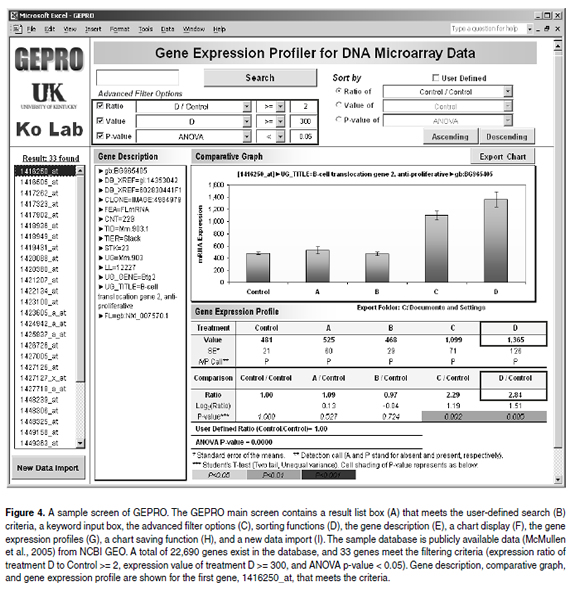
Description and functions of main screen
When a user performs a search, a list of gene IDs matching the search criteria appear in the result list box on the left corner of the GEPRO (see Figure 4A). The user can display gene expression profiles of the genes of interest by clicking the individual gene IDs; in response to the selection of a gene ID in the list box, the corresponding gene description, chart, and table are instantly updated and displayed (see Figures 4E, 4F and 4G).
The Search button (see Figure 4B) enables filtering genes containing a keyword in the description (see Figure 4E). Advanced filter options (see Figure 4C) enable filtering by a ratio of gene expressions between two comparison groups, by an expression value of an experimental treatment, and/ or a p-value from statistical tests. Genes listed in the result list box (see Figure 4A) can be rearranged by expression ratios, expression values, or p-values by using the sorting function (see Figure 4D).
In addition, a user can modify chart formats, types, source data, or chart options using Excel chart functions. Finally, the Export Chart button (see Figure 4H) allows a user to save the current chart as GIF image file in a folder assigned by the user. The New Data Import button (see Figure 4I) enables a new database set-up. When a user clicks this button, a sheet for data structure input appears (see Figure 2).
Discussion
In this paper, we report the development of a user-friendly, Excel spreadsheet-based GEPRO that allows users to easily build their own microarray database, identify genes of interest and, thus, maximize the use of the data produced from microarray. In GEPRO, a user imports original microarray data, annotation information and other relevant information in a guided manner. This program has search, filtering, and charting capabilities that allow researchers to identify differentially expressed genes and to display the gene expression profiles. The program also enables a user to easily change the display format or options of charts using Excel functions and to save charts in a user-defined folder. Additionally, GEPRO enables individual researchers to build their own gene expression databases using publicly available resources such as microarray data deposited in SAGE (9) or NCBI GEO (1).
The GEPRO is powerful, quick, and easy-touse software for researchers to organize microarray data, identify potentially important genes in their databases, and display the expression of those genes of interest. The greatest benefit of using GEPRO is that a user can use microarray data repeatedly and instantly, combine multiple sets of microarray data into one database, and utilize microarray data deposited in public domains. The GEPRO is freely available for non-commercial users. The GEPRO, sample database, sample microarray data, and supplemental information can be downloaded from http://www.mc.uky.edu/cls/ko/gepro1.html.
Acknowledgement
The authors thank Dr. Arnold J. Stromberg (Department of Statistics, University of Kentucky) for his helpful comments on the GEPRO and the manuscript.
References
1. Barrett T, Suzek TO, Troup DB, Wilhite SE, Ngau WC, Ledoux P, Rudnev D, Lash AE et al. NCBI GEO: mining millions of expression profiles-database and tools. Nucleic Acids Res 2005; 33: D562-D566. [ Links ]
2. Brown AM. A non-linear regression analysis program for describing electrophysiological data with multiple functions using Microsoft Excel, Comput. Meth. Prog. Biomed 2006; 82: 51-57. [ Links ]
3. Dansirikul C, Choi M, and Duffull SB. Estimation of pharmacokinetic parameters from non-compartmental variables using Microsoft Excel®. Comput. Biol. Med 2005; 35: 389-403. [ Links ]
4. Gentleman RC, Carey VJ, Bates DM, Bolstad B, Dettling M, et al. Bioconductor: open software development for computational biology and bioinformatics. Genome Biol 2004; R80. [ Links ]
5. Heyer LJ, Moskowitz DZ, Abele JA, Karnik P, Choi D, et al. MAGIC Tool: integrated microarray data analysis. Bioinformatics 2005; 21: 2114-2115. [ Links ]
6. Hulshizer R, Blalock EM. Post hoc pattern matching: assigning significance to statistically defined expression pattern in single channel microarray data. BMC Bioinformatics 2007; 8: 240. [ Links ]
7. Jo M, Gieske MC, Payne CE, Wheeler-Price SE, Gieske JB, et al. Development and application of a rat ovarian gene expression database (rOGED). Endocrinol 2004. 145: 5384-5396. [ Links ]
8. Khan HA. ArraySolver: an algorithm for color-coded graphical display and Wilcoxon signed-rank statistics for comparing microarray gene expression data. Comput Func Genom 2004; 5: 39-47. [ Links ]
9. Lash AE, Tolstoshev CM, Wagner L, Schuler GD, Strausberg RL, et al. SAGEmap: a public gene expression resource. Genome Res 2000; 10: 1051-1060. [ Links ]
10. Lindemann MD, Kim BG. Technical note: A model to estimate individual feed intake of swine in group feeding. J. Anim. Sci 2007; 85: 972-975. [ Links ]
11. Liu H, Tarima S, Borders AS, Getchell TV, Getchell ML, et al. Quadratic regression analysis for gene discovery and pattern recognition for non-cyclic short time-course microarray experiments. BMC Bioinformatics 2005; 6: 106. [ Links ]
12. McMullen CA, Moylan J, Reid MB, Andrade FH. C2C12 transcriptome changes in response to hydrogen peroxide. NCBI GEO 2005; (Accessed Feb 10, 2009) URL: http://www.ncbi.nlm.nih.gov/projects/geo/query/acc.cgi?acc=GSE3078/. [ Links ]
13. Navarange M, Game L, Fowler D, Wadekar V, Banks H, et al. MiMiR: a comprehensive solution for storage, annotation and exchange of microarray data. BMC Bioinformatics 2005; 6: 268-277. [ Links ]
14. Raguin O, Gruaz-Guyon A, Barbet J. Equilibrium expert: an add-in to Microsoft Excel for multiple binding equilibrium simulations and parameter estimations. Anal. Biochem. 2002; 310: 1-14. [ Links ]
15. Saeed AI, Sharov V, White J, Li J, Liang W, et al. TM4: a free, open-source system for microarray data management and analysis. Biotechniques 2004; 34: 374-378. [ Links ]

