Services on Demand
Journal
Article
Indicators
-
 Cited by SciELO
 -
 Access statistics
Related links
-
 Cited by Google
 -
 Similars in
SciELO
 -
 Similars in Google
Share
Revista Colombiana de Ciencias Pecuarias
Print version ISSN 0120-0690On-line version ISSN 2256-2958
Rev Colom Cienc Pecua vol.22 no.2 Medellín Apr./June 2009
Growth Curves and Genetic Parameters in Colombian Buffaloes (Bubalus bubalis Artiodactyla, Bovidae) *
Curvas de crecimiento y parámetros genéticos en búfalos (Bubalus bubalis Artiodactyla, Bovidae) en Colombia
Curvas de crescimento e parâmetros genéticos em búfalos (Bubalus bubalis Artiodactyla, Bovidae) na Colômbia
Divier Agudelo-Gómez 1,2, Ms; Naudín Hurtado-Lugo 1,4, Zoot; Mario F Cerón-Muñoz1,3,* Zoot, PhD.
1 Animal Breeding and Genetics Research Group, University of Antioquia, Medellín, Colombia, fax (4) 4259111. 2 College of Administrative and Agricultural Sciences, Lasallista Universitary Corporation. Caldas, Colombia, 3000200 extensión 184. 3 College of Agricultural Sciences, University of Antioquia, Medellín, Colombia, fax (4) 4259140 4 FCAV, UNESP, Jaboticabal, SP, 14884900, Brazil.
(Recibido: 19 febrero, 2009; aceptado: 30 abril, 2009)
Summary
Non-linear mathematical functions proposed by Brody, Gompertz, Richards, Bertalanffy and Verhulst were compared in several buffalo production systems in Colombia. Herds were located in three provinces: Antioquia, Caldas, and Cordoba. Growth was better described by the curves proposed by Brody and Gompertz. Using the datasets from herds from Caldas, heritabilities for traits such as weaning weight (WW), weight and maturity at one year of age (WY and MY, respectively), age at 50% and 75% of maturity (A50% and A75%, respectively), adult weight (β0), and other characteristics, were also estimated. Direct and maternal heritabilities for WW were 0.19 and 0.12, respectively. Direct heritabilities for WY, MY, A50%, A75% and β0 were 0.39, 0.15, 0.09, 0.20 and 0.09, respectively. The genetic correlation for β0 and WY was -0.47, indicating that selection for heavy weight at one year of age will lead to lower weight at adult age. These data suggest that selection based on maturity traits can generate changes in characteristics of economic importance in beef-type buffalo farms.
Key words: non-linear functions, tropical production systems, genetic parameters.
Resumen
Funciones matemáticas no lineales propuestas por Brody, Gompertz, Richards, Bertalanffy y Verhulst fueron utilizadas para describir el crecimiento en búfalos provenientes de tres regiones de Colombia (Antioquia, Caldas y Córdoba). Las funciones que mejor describieron el crecimiento fueron Brody y Gompertz. Con la base de datos de la región de Caldas, fueron estimadas las heredabilidades para las características peso al destete (PD), peso y madurez al año de edad (PA y MA, respectivamente), edad al 50% y 75% de madurez (I50% y I75%, respectivamente), peso adulto (β0), y otras características. Las heredabilidades directa y materna para PD fueron: 0.19 y 0.12, respectivamente. Las heredabilidades directas para PA, MA, I50%, I75% y β0 fueron 0.39, 0.15, 0.09, 0.20 y 0.09, respectivamente. La correlación genética para β0 y PA fue -0.47, indicando que al seleccionar animales por peso al año, tendríamos animales con mayor peso adulto. Las características de madurez pueden ser utilizadas en programas de mejoramiento genético en procura de búfalos mas eficientes en sistemas de producción colombianos.
Palabras clave: funciones no lineales, parámetros genéticos, sistemas de producción tropical.
Resumo
Funções matemáticas não lineares propostas por Brody, Gompertz, Richards, Bertalanffy e Verhulst foram utilizadas para descrever o crescimento em búfalos provenientes de três regiões da Colômbia ( Antioquia, Caldas e Córdoba). As funções que melhor descreveram o crescimento foram Brody e Gompertz. Com a base de dados da região de Caldas, foram estimadas as herdabilidades para as características peso ao desmame (PD), peso e maturidade ao ano de idade (PA e MA, respectivamente), idade ao 50% e 75% de maturidade (I50% e I75%, respectivamente), peso adulto (β0), e outras características. As herdabilidades direita e materna para PD foram: 0.19 e 0.12, respectivamente. As herdabilidades direitas para PA, MA, I50%, I75% e β0 foram 0.39, 0.15, 0.09, 0.20 e 0.09, respectivamente. A correlação genética para β0 e PA foi -0.47, indicando que ao selecionar animais por peso ao ano, teríamos animais com maior peso adulto. As características de maturidade podem ser utilizadas em programas de melhoramento genético em procura de búfalos mais eficientes em sistemas de produção colombianos.
Palavras chave: funções não lineares, parâmetros genéticos, sistemas de produção tropical.
* Para citar este artículo: Agudelo-Gómez D, Hurtado-Lugo N, Cerón-Muñoz MF. Growth Curves and Genetic Parameters in Colombia-n Buffaloes (Bubalus bubalis Artiodactyla, Bovidae). Rev Colomb Cienc Pecu 2009; 22: 178-188
* Autor para correspondencia: Facultad de Ciencias Agrarias, Universidad de Antioquia, Tel 2199140. Medellín, Colombia. Email: mceronm@hotmail.com.
Introduction
Animal growth is an important factor in the economy of a meat production system due to its relations with productive and reproductive traits. Growth rate is affected by genetics, the environment, and their interactions. The complexity of those interactions makes it very difficult to formulate reliable growth predictions (6).
Animal growth curves are described by non-linear functions where the function parameters can have a biological interpretation such as adult weight, age to the inflection point, mature weight and maturity rate (11). According to Tedeschi et al (36) growth functions can be used for several purposes, including dietary adjustments. Growth functions can also be used for genetic improvement. They are used as a tool for animal selection, considering that animals showing high maturity rates are more precocious (9, 14).
Several mathematical models have been used to describe animal growth. Moore (24) proposed a general function to estimate weight from the embryonic phase until adult weight. Functions with logarithmic and exponential components were used by Liski (21). Currently, non-linear and non-linear mixed models are used, both with exponential components, because their coefficients can be biologically interpreted and easily compared under different scenarios (16, 28).
Several non-linear models have been proposed to explain animal growth, such as: Gompertz (17), Von Bertalanffy (38), Brody (8), Richards (31). These models summarize information (e.g. weight and age to reach maturity, adult weight and precocity) in few parameters, which facilitates the understanding of animal growth (28).
Estimation of genetic parameters is essential to determine genetic progress. Carrijo and Moura (11), working with Chianina cattle, estimated 0.20, 0.21 and 0.31 heritability values for age to the inflection point, weight to the inflection point and age to maturity, respectively, suggesting that selection based on those traits could be effective and also that weight to maturity can be modified by selection programs. Heritability estimates, genetic correlations among growth traits, and maturity index are traits of economic importance in meat production systems (22). Coefficients of non-linear functions for bovine breeds can be used to calculate genetic variability for weight traits in beef cattle improvement programs. In regard to buffaloes, scarce reports have been found to evaluate heritabilities of growth functions. Chantalakhana (12) reported 0.63 and 0.37 heritability values for buffalo weight at birth and weaning, respectively.
Buffalo has been considered a precocious meatproducing animal in grazing production systems (30). Compared to genus Bos indicus or taurus, buffaloes grow faster, reaching slaughter weight sooner (1). This is due to a higher capacity to use pastures, reflected by better feed conversion of buffaloes (37). It is estimated that the current buffalo population in Colombia reaches around 100.000 animals, and it is increasing close to 10 percent per year, which is higher than the 3% increase for Bos indicus and taurus (33).
An objective of the present study was to identify the mathematical functions that better describe growth under three buffalo production systems. Another objective was to estimate heritabilities and genetic correlations for: weaning and one year of age weights (WW and WY, respectively), Brody´s coefficients (β0 , β1 and β2), maturity at one year of age (MY), and age at 50% and 75% of maturity (A50% and A75%, respectively).
Materials and methods
This study evaluated productive records from buffalo herds located in three different Colombian regions, under different management systems described as follows:
Production System A (PSA)
Data were obtained from Altamar herd, located in Buenavista municipality (Cordoba province, Lat: 8º 30´ N. Long: 75º 30´ W), at an altitude of 50 meters above sea level (masl) and 30ºC temperature. Crossbred animals with high percent of Bulgarian and Brazilian Murrah breeds were used. Animals grazed on native grass fields mixed with Brachiaria Spp grass and some forage legumes. Females were milked twice a day in a dual-purpose cattle raising system (meat and milk production). Lactation lasted at 270 days, and milk yield was 4.3 Kg/day (18.). The calving season extends from August to October.
Production System B (PSB)
This system included records from three herds located in an area around the middle Magdalena river. Ceilan herd, located in a dry tropical forest (in La Dorada municipality, Caldas province) is at an altitude of 190 masl, with 28.4 ºC Temperature, and annual precipitation around 1,900 mm distributed from March to June and October to December. Riomanso herd, in a humid tropical forest (Norcasia municipality, Caldas province) is at 150 masl, 26.3 ºC, and 2.300 mm of annual precipitation distributed as in the former farm. El Cortijo herd, also in a humid tropical forest (Puerto Boyacá municipality, Boyacá province -bordering with Caldas province) is at 120 masl, 26.1 ºC, and 2.500 mm of annual precipitation, distributed from April to June and November to December. Calves in the three herds are managed under continuous suckling (dams are not milked). Buffaloes graze on Brachiaria fields.
Production System C (PSC)
Records were obtained from a production system classified as organic (certified by the International Corporation of Colombia), located in a humid tropical forest around the middle Magdalena River (Puerto Nare municipality, Antioquia province), at 125 maosl, with 27 ºC, and 2.016 mm annual precipitation (75% relative humidity). The rainy seasons extend from March to May and from September to November. The dry seasons cover from December to February and from June to August. The buffalo breed is Bufalypso, which originally came from Trinidad and Tobago. Animals are managed in an extensive system grazing on native (Panicum Spp) and improved (Brachiaria Spp) pastures, Females are milked twice a day in a dual-purpose cattle raising system (meat and milk production). Buffalo cows, which are supplemented with molasses and mineral salt at libitum, have to walk about 2.0 to 2.5 km with their calves from the grazing fields to the milking parlor. After milked, cows and calves are walked to a nearby parlor where calves can suck milk for half an hour (29).
Datasets
The PSA dataset included 1.678 weight records from 116 males and 266 females born between year 1999 and 2004. Each animal had at least four weight records taken between 100 and 900 days of age. The PSB dataset included 8.026 weight records from 447 males and 402 females born between year 2002 and 2006. Animals had at least six records between 100 and 800 days of age. The PSC dataset had 8586 records from 519 males and 461 females born between year 2001 and 2004, with at least six records between 100 and 1,100 days of age. Outliers, inconsistent age, and repeated records were eliminated from the datasets
Growth functions
Functions evaluated for each animal in the three production systems were the following:
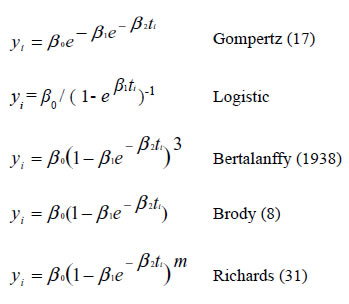
Where:
yi represents the i-th weight record of the animal in the i-th time ti;
β0 is the adult weight when t tends to infinite; β1 is an adjustment parameter when
y ≠ 0 or t ≠ 0;
β2 is an index of maturity expressed as a proportion of the maximum growth with regard to the adult animal weight. The "m" parameter in Richards´s function refers to the inflection point.
The inflection point for Gompertz, Bertalanffy, Logistic, and Richards functions were calculated using the following equations:
1n β1 / β2, 1n β1 / β2, 1n (3β1)/ β2, and
-1n (m/β1) / β2, respectively, obtained from the original functions
The election of the best model was based on: the percentage of converging curves (PCC), the percentage of highly significant curves (PCHS, P <0.05), the percentage of curves having a small Akaike information criteria (PCAIC) and a small Bayesian information criteria (PCBIC). Residual values and determination coefficient (R2) were also taken into account (15). The Akaike and Bayesian information criteria (AIC and BIC, respectively) were calculated using the equations proposed by Bret (7):
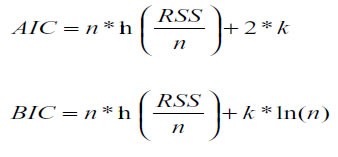
Where n is the number of observations per animal, K is then number of function parameters, and RSS is the residual sum of squares.
Datasets were analyzed using the Nlin procedure of SAS software (34). From the best function chosen, MY, A50% and A75% traits were calculated.
Genetic parameters
For production system B, heritabilities and genetic, phenotypic and environmental correlations for WW, WY, β0, β1, β2, MY, A50% and A75% traits were estimated, considering that a database with genealogical information was available. For WW, a uni-trait model was used. The fixed effects were: sex (males and females), herd-year-season, contemporary group of weaning, buffalo cow parity number (1, 2, 3, and >=4), and weaning age (lineal effect). Herds were: Ceilan, El Cortijo, and Riomanso. Seasons were: dry (January, February, March, July, August and September) and rainy (April, May, June, October, November and December). Years were: 2002 to 2006. Direct and maternal genetics, permanent environment, and residual random effects were included in the model. The number of animals in the relationships matrix was 3080, in 6 generations. Animals in the three herds were genetically connected because there were sire and dam exchanges among herds.
Variable WY was analyzed in a bi-trait model with β0, β1, β2, MY, A50%, and A75% traits. Fixed effects for WY (sex, and herd-year-season contemporary group at one year of age) were included in the model. Age at weighing for WY was included as a covariable. Fixed effects for the other traits were: sex, and herd-year-season contemporary group of birth. For all the traits, the direct genetic and residual random effects were used.
A tri-trait analysis for β0, β1 and β2 was performed, considering sex and contemporary group of birth as fixed effects, and also considering direct genetic and residual as random effects.
The covariance components were estimated by the derivative-free restricted maximum likelihood estimation method in animal models using the MTDFREML software (3).
Results
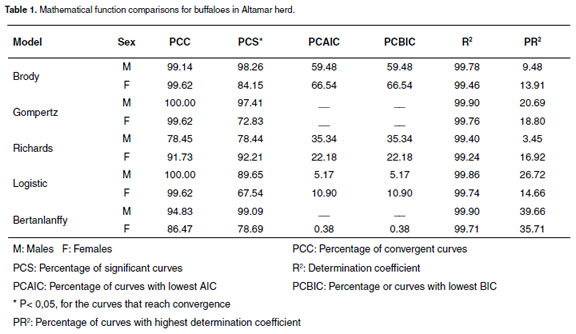
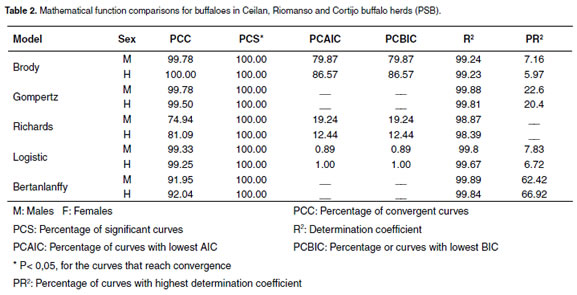
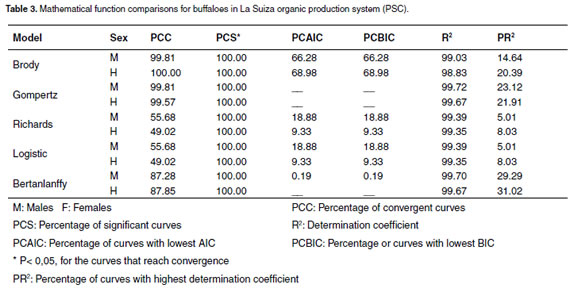
For all three production systems, every evaluated function had R2 higher than 98.39%, as shown in tables 1, 2, and 3. For males in the PSA system, all the functions had high PCC and SPC criteria. Nevertheless, when analyzing the PCIAC and PCBIC criteria, the best model was Brody´s function because it presented the biggest percentage of animals with low PCIAC and PCBIC (see Table 1). The Brody´s function was also the best for females. For the PSB and PSC systems located around the middle Magdalena river, the Brody and Richard´s functions were the best (bigger PCAIC and PCBIC), except for the females in the PSC system, where the best functions were Brody and Logistic (see Table 2 and 3).
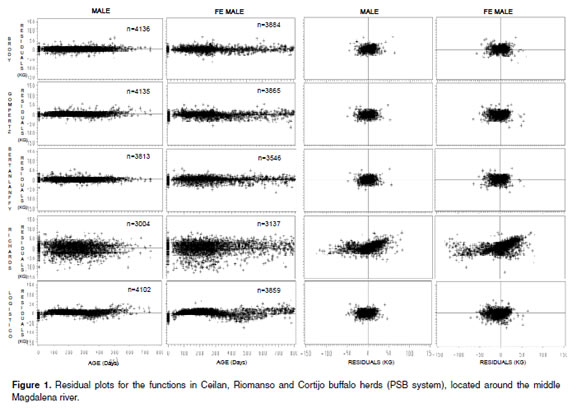
Comparisons of residuals distribution among the mathematical functions were similar in the three productions systems. Taking PSB as an example, a considerable variation for the residuals distributions of all the mathematical functions was observed in this system. Richards´s function presented the biggest variation of residuals plotted against time (see Figure 1). It was also observed that Logistic function underestimated the data for the first stage of life (birth weight); Bertalanffy´s function presented a better adjustment because its residuals distribution was close to zero and had the best no residuals dependence. However, this function presented less PCC. Bertalanffy´s function converged in 7,359 records, while Brody and Gompertz functions converged in 8.020 and 8.000 records, respectively (see Figure 1), indicating that Brody and Gompertz functions have greater convergence ability. Furthermore, for beef cattle, Brody´s function has the best adjusted curve during the first six months of age, compared with Von Bertalanffy, Gompertz, and Logistical functions (16, 28).
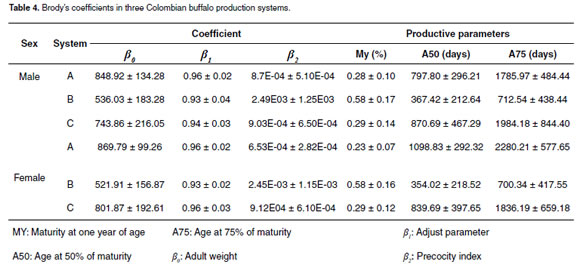
Although all the mathematical functions a great phenotypic variation. Adult weight (β0) described the growth curve, Brody was selected varied from 536 ± 183 to 848 ± 134 and 521 ± 157 as the best function. Brody´s coefficients (β0, β1 to 870 ± 99 kg for males and females, respectively and β2) for the three production systems indicates (see Table 4).
The MY, A50%, and A75% traits were calculated with Brody´s function using the following equations:

Where V is the maturity grade at different ages ti (ti), and Ev is the age at different maturity grades (6). The MY trait in the three productions systems varied from 0.28 ±0.10% to 0.58 ± 0.17% and 0.23 ± 0.07% to 0.58 ± 0.17% for males and females, respectively. In regard to A75%, it varied from 712 ± 438 to 1,984 ± 844 and 700 ± 417 to 2,280 ± 578 days of age for males and females, respectively (see Table 4).
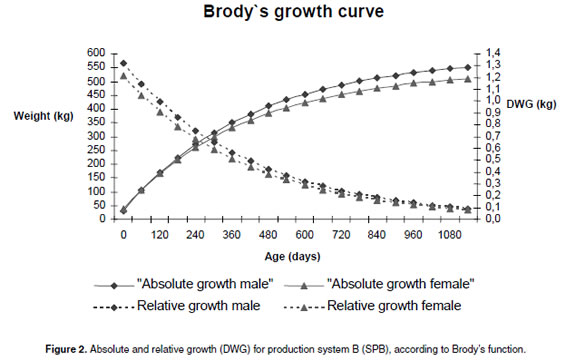
Absolute (live weigh) and relative growth (daily weight gain, DWG) for males and females were plotted (see Figure 2) using Brody´s functions coefficients for the PSB systems. The relative growth curve was obtained using the first derivate of the Brody´s function.
For production system B, the number of records, means, and variation coefficients for WW, WY, MY, A50% and A75% traits included in the genetic analyses are shown in table 5. The means for WW and WY in males were 251.23 and 282.40 kg, respectively. Females were lighter in 12.22 and 11.35 kg for WW and WY, respectively.
Phenotypic variance for WW was 801.18 kg2. The direct and maternal heritabilities were 0.19 ± 0.10 and 0.12 ± 0.14, respectively.
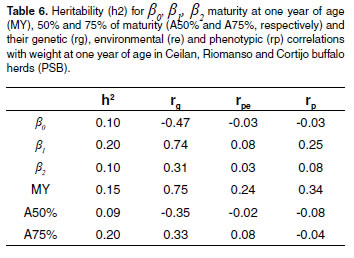
The proportion of the variance for permanent environment was 0.64. The genetic correlation was 0.37 with a high standard error (± 0.94), analyses values was 0.39. Heritabilities for β0, β1, β2 , MY, A50% and A75% traits were lower than 0.20. The genetic, environmental and phenotypic correlations for WY are shown in table 6.
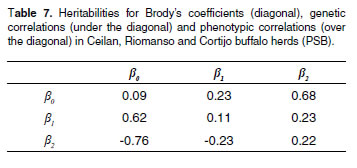
Heritability values as well as genetic and phenotypic correlations obtained in the tri-trait analysis are presented in table 7. Heritability for adult weight (β0) and rate of maturity or precocity (β2) are moderate.
Genetic correlations between β and WY 0 (table 6) and β0 and β2 (see Table 7) were high and negative (-0.47 and -0.76, respectively). Genetic correlation between WY and β2 was positive (0.31). Genetic correlation between WY and MY was 0.75., and genetic correlations between WY-A50% and WY-A75% were -0.35 and -0.33, respectively.
Discussion
Adult animal weight depends on the nutritional value of forages and supplementation (36). Age is also a factor that determines adult weight, according to Morrow et al (25): for Angus cattle, stable weight was reached after 4.5 years of age. Beltran et al (2) indicated that weight remains constant after 5.5 years of age, suggesting that for animals with out weighing records near this age the non-lineal functions will not reach convergence. In this study, the convergence levels were reached in Brody, Gompertz and Logistics functions, where PCC was higher than 98%. Furthermore, the adult age was reached at 3 years of age, coinciding with other researchers who found that buffalo age to reach slaughter weight is younger than beef cattle, due to their high growth speed and precocity (1, 19, 32).
Although all the mathematical functions described the growth curve, Brody was selected as the best function. The high phenotypic variation observed can be explained by genetic and environmental effects between and within the three production systems. Similar results were reported by Garnero et al (16) in Nelore cattle and Oliveira et al (28) in Guzerat cattle. Working on Brody´s function with Angus Cattle, Kaps et al (20) reported that 55 and 65% of maturity were reached at 365 and 540 days, respectively. These results were similar to PSB but lower than PSA and PSC systems, because PSA and PSC were dual-purpose raising systems (meat and milk). In Brazilian Nellore females, A50% was reached at 430 days of age (16) which agrees with Oliveira et al (28), who reported that Bos indicus cattle is less precocious and has slower growth compared to Bos taurus cattle.
For production system B, the means for WW and WY were 241.16 and 277.02 kg, respectively. Argentinean (39) and Venezuelan (32) buffalo herds reported WW of 201 ± 15 kg and of 235 ± 22 kg, respectively, which are lower than the values found in this study.
The direct and maternal heritabilities were 0.19 ± 0.10 and 0.12 ± 0.14, respectively. In beef-type buffaloes, heritability for WW reported values vary from 0.16 up to 0.23 (35); the results found in this study are considered moderate in comparison with data for beef cattle which vary from 0.33 to 0.59 (5, 23). The genetic correlation was 0.37 with a high standard error (± 0.94), understanding that there were difficulties in our estimation. Dodenhoff et al (13) estimated direct and maternal genetic correlations between -0.37 and 0.64 for nine cattle breeds, while 6 of them (Braunvieh, Gelbvieh, Pinzgauer, Charolais, Limousin and Red Poll) had a positive genetic correlation.
Carrero (10) reported wide variation for WY heritability in buffalos (between 0.18 and 0.85), which can be explained by the environmental conditions and the genetic model used for evaluating the data.
The heritability for adult weight (β0) and rate of maturity or precocity β2) are moderate, suggesting that selection based on these parameters can lead to acceptable genetic progress. For β2, Carrijo and Moura (11) reported 0.12 and 0.33 in Nelore and Chianina cattle, respectively.
Genetic correlations between β and WY 0 and β0 and β2 were high and negative, indicating that selection based on precocity (β2) leads to obtaining individuals with low adult weights. Similar values were estimated by Carrijo and Moura (11), Oliveira et al (27) and Garnero et al (16), suggesting that animals selected for greater adult weight would be less precocious than animals with lower adult weights. Genetic correlation between WY and β and WY and MY 2 were positive. Carrijo and Moura (11) reported 0.51 for the genetic correlation between β0 and age to the inflection point in Nelore cattle. Their report coincides with the genetic correlations estimated by Northcutt et al (26) in Angus, and by Bullock et al (4) in Hereford. Genetic correlations between WY-A50% and WY-A75% were negatives, suggesting that animals presenting greater WY genetic values will also present smaller A50% and A75% genetic values.
According to the results obtained in this study, it is possible to alter the growth curve of Colombian buffalo cattle using as a reference the coefficients of the mathematical function proposed by Brody, considering that there is moderate genetic variability in the studied population. Increasing precocity by using selection programs reduces traits such as age to starting of reproduction, age to slaughter, and adult weight.
Acknowledgments
The authors Acknowledgments to: Altamar, Fondo Ganadero del Centro, Riomanso, El Cortijo and Ceilan Farm for facilitating the data sets to conduct this study, and Grica group.
References
1. Angulo R, Agudelo-Gómez D, Cerón-Muñoz M, Jaramillo-Botero S. Genetic parameters in buffalo calves fed at full milk in beef production system in middle Magdalena region of Colombia. Liv Res for Rural Dev. 2006; [Jul 11, 2007] URL: http://www.cipav.org.co/lrrd/lrrd18/12/angu18180.htm [ Links ]
2. Beltrán J, Butts W, Olson T, Koger M. Growth curves of two lines of Angus cattle selected using predicted growth parameters. J Anim Sci 1992; 70:734-741. [ Links ]
3. Boldman K, Kriese L, VanVleck L, Kachman S. A manual for use of MTDFREML. A Set of Programs to Estimate of Variances and Covariances. USDA, ARS, USA. 1995. [ Links ]
4. Bullock K, Bertrand J, Benyshek L. Genetic and environmental parameters for mature weight and other growth measures. Polled Hereford cattle. J Anim Sci 1993; 71: 1737-1741. [ Links ]
5. Bhat P. Genetics parameters of milk production and scope of increasing milk production in buffalo´s vis-à-vis cattle. Anim Prod and Health, FAO/UN; 1979; 13. [ Links ]
6. Blasco A. It lacks the name of the work. In: Proc. XIV international Course on animal genetic improvement. Universidad Politécnica de Valencia, Spain. 2004. [ Links ]
7. Bret L. AIC and BIC in Lecture Handouts. 2003; [Dic 10, 2007] URL: http://www.stat.wisc.edu/courses/st333-larget/aic.pdf. [ Links ]
8. Brody S. Bioenergetics and growth. Reinhold publishing corporation. New York. 1945. [ Links ]
9. Brown J, Brown C, Butts W. A discussion of the genetic aspects of weight, mature weight and rate of maturing in Hereford and Angus cattle. J Anim Sci 1972; 34:525-532. [ Links ]
10. Carrero J. Genética. In: El búfalo asiático: un recurso inexplorado para producir proteína animal. Caracas: Lito formas. Caracas; 2000. [ Links ]
11. Carrijo S, Moura F. Description and comparison of growth parameters in Chianina and Nelore cattle breeds. Gen and Mol Bio 1999; 22:187-196. [ Links ]
12. Chantalakhana C. Research on the water buffaloes in Thailand during the last decade. In: Proc Workshop on the uses of nuclear techniques to improve buffalo production in Asia. Chulalongkorn University, Bangkok, Thailand; 1981. [ Links ]
13. Dodenhoff J, Van Vleck L, Gregory K. Estimation to direct, maternal, and grandmaternal genetic effects for waning weight in several breeds of beef cattle. J Anim Sci 1999; 77: 840-845. [ Links ]
14. Fitzhugh H. Analysis of growth curves and strategies for altering their shapes. J Anim Sci 1976; 42: 1036-1051. [ Links ]
15. Gaona B. Wombs of structured (co)variance in curves with repeated measures. Tesis de Doctorado. Universidad de Puerto Rico, Puerto Rico, Mayagüez. 2005. 127 p. [ Links ]
16. Garnero A, Marcondes C, Bezerra L, Oliveira H, Wolf R. Parâmetros genéticos da taxa de maturação de peso assintótico de fêmeas da raça Nelore. Arq Brás Med Vet Zootec 2005; 57: 652-662. [ Links ]
17. Gompertz B. On the nature of the function expressive of the law of human mortality, ando n a new mode of determining the value of life congengencies. Phil Trans of the Royal Soc of Lon 1825;115: 513-585. [ Links ]
18. Hurtado-Lugo N, Cerón-Muñoz M, Gutiérrez-Valencia A. Estimación de parámetros genéticos para la producción de leche en el día del control en búfalos de la Costa Atlántica Colombiana. Liv Res for Rural Dev. 2006; [Jul 11, 2007] URL: http://www.cipav.org.co/lrrd/lrrd18/3/hurt18039.htm [ Links ]
19. Jorge A. Produção e qualidade da carne bubalina. In: Proc. Anais do Simpósio Paulista of Bubalinocultura. Pirassununga, SP, Brazil. 2001; p. 55. [ Links ]
20. Kaps M, Herring Q, Lamberson W. Genetic and environmental parameters for traits derived from the Brody growth curve and their relationships whit weaning weight in angus cattle. J Anim Sci 2000; 78: 1436-1442. [ Links ]
21. Liski E. A growth curve analysis for bulls tested at station. Biometrical J 1987; 29: 331-343. [ Links ]
22. Macneil M, Newman S. Selection indexes for Canadian beef production using specialized sire and dam lines. Canadian J Anim Sci 1994; 74: 419-424. [ Links ]
23. Meyer K. Variance components due to direct and maternal effects for growth traits of Australian beef cattle. Livest Production Sci 1992; 31: 179-204. [ Links ]
24. Moore A. A mathematical equation for animal growth from embryo to adult. Anim Prod 1985; 40: 441-453. [ Links ]
25. Morrow R, Mclaren J, Butts W. Effect of age on estimates of bovine growth-curves parameters. J Anim Sci 1978; 47: 352-357. [ Links ]
26. Northcutt S, Wilson D, Hoekstra J. Effect of positive genetic trend for mature size on age-of-dam adjustment factors for weaning weight in Angus fi eld records. J Anim Sci 1994; 72: 828-832. [ Links ]
27. Oliveira J, Lôbo R, Oliveira H. Tendência genética em pesos ganhos de peso em bovinos da raça Guzerá. Pesq Agropec Bras 1995; 30:1355- 1360. [ Links ]
28. Oliveira H, Lôbo R, Pereira C. Comparison of non-linear models for describing growth of Guzerat beef cattle females. Pesq Agro Bra 2000; 35: 1843-1851. [ Links ]
29. Quintero J, Serna J, Cerón-Muñoz M. Modelos mixtos no lineales en curvas de lactancia de búfalas en un sistema de producción orgánica en el Magdalena Medio Antioqueño (Colombia). Liv Res for Rural Dev 2007; [Jul 11, 2007] URL: http://www.cipav.org.co/lrrd/lrrd19/4/quin19052.htm. [ Links ]
30. Ramos A. Melhoramento genético dos búbalinos. En: HIPÓLITO, V.; TONHATI, B. and BARUSELLI, S. editors. I Simposio paulista de bubalinocultura. Jaboticabal: FUNEP; 1999. p. 27-50 [ Links ]
31. Richards F. A fl exible growth function for empirical use. J Exp Bot 1959; 10: 290-300. [ Links ]
32. Rodas A, Huerta N, Vidal A, Rodríguez R, Colina O. Rendimiento carnicero de búfalos vs. Vacunos acebuados producidos a sabanas y sacrifi cados serialmente a cuatro edades contemporáneas. In Proc. I SAW World Buffalo Congress, Maracaibo, Venezuela; 2001; p.65. [ Links ]
33. Sanint L. Pasado, presente y futuro del búfalo en Colombia. En: SIMPOSIO DE BÚFALOS DE LAS AMÉRICAS. Memorias III Simposio de búfalos de las américas. Medellín, 2006. p. 32. [ Links ]
34. SAS. System for regression SAS institute Inc, Cary, version 9.1 Edition Carv Nc North Caroline. 2005. [ Links ]
35. Schammass E, Kawatoko M, Camargo F, Mattos C. Macedo M. Desenvolvimiento ponderal de bubalinos da raça Mediterrânea. In: Proc. XXXIII Annual Reunião da Soc Bras de Zootecnia, Fortaleza, Brazil. 1996; p. 301. [ Links ]
36. Tedeschi L, Boin C, Fernandes N, Leme P. Estudo da Curva de Crescimento da animales da Raça Guzerá e seus Cruzamentos Alimentados a pasto, com e sem Suplementação. 1 Análise e Seleção da Funções Não- Lineares. Rev Bras Zootec 2000; 29: 630-637. [ Links ]
37. Vale W, Lourenzo J, Ohashi O. Proceedings of the I buffalo symposium of americas. Belén, Brazil: PRODEPA - Governo do Estado do Pará. 2002; p. 613. [ Links ]
38. Von Bertalanffy L. A quantitative theory of organic growth Hum Biol 1938; 10: 181-213. [ Links ]
39. Zaba M, Clevañer F. Breeding of buffalos in Argentina. In: Proc. Proceeding 6th World Buffalo Congress, Maracaibo, Venezuela. 2001;p. 705. [ Links ]


