


Services on Demand
Journal
Article
 English (pdf)
 Article in xml format
 Article references
 Send this article by e-mail
Indicators
-
 Cited by SciELO
 -
 Access statistics
Related links
-
 Cited by Google
 -
 Similars in
SciELO
Similars in
SciELO -
 Similars in Google
Share

 Permalink
Revista Colombiana de Ciencias Pecuarias
Print version ISSN 0120-0690On-line version ISSN 2256-2958
Rev Colom Cienc Pecua vol.23 no.2 Medellín Apr./July 2010
Genotype-environment interaction in multibreed bovine populations in the Colombian low tropic¤
Interacción genotipo-ambiente en una población bovina multirracial en el trópico bajo colombiano
Interação genótipo ambiente em populações bovinas multiraciais no trópico baixo colombiano
Elkin M Arboleda Zapata1, Zoot, MSc; Mario F Cerón Muñoz1*, Zoot, PhD; José M Cotes Torres2, I Agr, PhD; Oscar D Vergara Garay1,3, Zoot, PhD.
1 Grupo de Genética, Mejoramiento y Modelación Animal (GaMMA), Facultad de Ciencias Agrarias, Universidad de Antioquia, Medellín, Colombia. 2 Facultad de Ciencias Agropecuarias, Universidad Nacional de Colombia, Sede Medellín, Medellín, Colombia. 3 Facultad de Medicina Veterinaria y Zootecnia, Universidad de Córdoba, Montería, Colombia.
(Recibido: 26 octubre, 2009 ; aceptado: 13 abril, 2010 )
Summary
With the aim of quantifying the genotype-environment interaction (GEI) and the phenotypic stability in multibreed bovine population of the Colombian Northwest, registries from 16 herds located in three agroecological regions (E1, E2, E3) from low tropic systems (humid subtropic forest, humid tropic forest and dry tropic forest, were collected from 1995 to 2007. Weight at 12-mo (W12), weight at 18-mo (W18), and weight at 24-mo (W24), were evaluated with 1806, 1455, and 1197 data, 14, 11, and 10 genetic groups respectively; animals of the breeds and crossbred between Angus (A), Blanco Orejinegro (B), Zebu (Z), Holstein (H), Romosinuano (R), and Senepoll (S) were used. In a mixed model, the fixed effects of contemporary group (year-season-sex) and the age covariate were used, which showed a significant effect (p<0.001) on the three traits. Random effects were region, genetic group (breed or crosses), and GEI, but the last one (GEI) showed significant effect (p<0.05) for this last one. The Shukla's variance in Bayesian methodology was used for the phenotypic stability analysis. The results indicated that the groups with high proportion of Zebu were associated with E2 and groups with greater levels of Romosinuano were associated with E3. Holstein and Blanco Orejinegro tended to give greater phenotypic stability than the groups that used these breeds.
Key words: bayesian methodology, beef cattle, phenotypic stability, variance components.
Resumen
Con el objetivo de cuantificar la interacción genotipo-ambiente (IGA) y la estabilidad fenotípica en una población bovina multirracial del noreste colombiano, se usaron registros de 16 rebaños localizados en tres regiones agroecológicas del trópico bajo: bosque húmedo subtropical (R1), bosque húmedo tropical (R2) y bosque seco tropical (R3), entre los años 1995 y 2007. Los pesos fueron evaluados a los 12 (P12), 18 (P18) y 24 meses (P24), con 1806, 1455 y 1197 datos, y 14, 11 y 10 grupos genéticos, respectivamente. Fueron usados animales puros y cruzados entre las razas Angus (A), Blanco Orejinegro (B), Cebú (C), Holstein (H), Romosinuano (R) y Senepol (S). Se utilizó un modelo mixto, en el que los efectos fijos de grupo contemporáneo y la edad presentaron efecto significativo (p<0.001) sobre las tres características. Los efectos aleatorios fueron región, grupo genético (raza o cruce) e IGA, la que presentó efecto significativo (p<0.05). Para el análisis de estabilidad fenotípica se utilizó la varianza de Shukla mediante metodología bayesiana. Los resultados indican que los grupos genéticos con altas proporciones de Cebú fueron asociados con R2 y los grupos genéticos con altos niveles de Romosinuano fueron asociados con R3. Las razas Holstein y Blanco Orejinegro tendieron a dar mayor estabilidad fenotípica a los grupos donde estas razas fueron usadas.
Palabras clave: componentes de varianza, estabilidad fenotípica, ganado de carne, metodologías bayesianas.
Resumo
Com o propósito de quantificar a interação genótipo ambiente (IGA) e estabilidade fenotípica em populações bovinas multiraciais no trópico baixo colombiano foram utilizados registros desde 1995 até 2007 de 16 fazendas localizadas em três regiões agroecológicas: bosque subtropical úmido (E1) bosque tropical úmido (E2) e bosque tropical seco (E3). Foram avaliadas o peso aos 12, 18 e 24 meses, com 1806, 1455 e 1197 registros, respectivamente de 10 grupos genéticos das raças Angus, Blanco Orejinegro, Zebu, Holandês, Romosinuano e Senepol. O Modelo mixto utilizado incluiu os efeitos fixos de grupo contemporâneo (ano, época e sexo) e a idade como covariavel, os quais foram significativos (p<0.001) nas três características. Foram considerados os efeitos aleatórios de regiao, grupo genético e a interação (GEI), onde este último foi significativo. A analise de estabilidade fenotípica foi realizada utilizando a variância de Shukla por metodologia Bayesiana. Os resultados indicaram que os grupos com maior proporção de Zebu foram associados com E2 e os grupos com maior proporção de Romosinuano foram associados com E3. Os animais que tinham composição racial de Holandês e Blanco Orejinegro tiveram maior estabilidade fenotípica que os outros grupos raciais.
Palavras chave: metodologia bayesiana, gado de corte, estabilidade fenotípica, componentes de variância.
¤ Para citar este artículo: Arboleda Elkin, Cerón-Muñoz Mario, Cotes José, Vergara Oscar. Genotype-environment interaction in multibreed bovine populations in the Colombian low tropic. Rev Colomb Cienc Pecu 2010; 145-157.
* Corresponding Author. Mario F Cerón-Muñoz. Universidad de Antioquia. Facultad de Ciencias Agrarias. Carrera 75 No. 65-87- Ciudadela de Robledo. Medellín, Colombia. Tel: (4) 2199140. E-mail address: mceronm@hotmail.com.
Introduction
The genetic evaluation of animals according to the performance of their pure and crossbred progeny is becoming a priority for Colombian producers. To make these evaluations, several models have been proposed. These models allow comparisons among animals with different breed composition (Elzo and Famula, 1985; Arnold et al., 1992). However, it is important to consider the possible genotypeenvironment interactions when these evaluations are conducted under different environmental conditions (Falconer and Mckay, 1996).
The genotype-environment interaction (GEI) has been defined as the variation in the relative performance of a trait, expressed by two or more genotypes, when it is measured under two or more environments. These interactions can represent either changes in the genotype classification order and/or changes in the absolute and relative variances (genetic, environmental and phenotypic) for diverse environments (Falconer, 1952; Falconer and Mckay, 1996; Hunh, 1996; Kang and Magari, 1996).
In order to estimate the presence of GEI for economically important traits in bovines, the following methodologies have been used: a) To consider the GEI as a random effect in the model (Shukla, 1972; Meyer, 1987; Magari and Kang, 1997; Piepho, 1999). b) To use multi-trait analysis, which considers animal performance in each environment as different traits, and estimating the genetic correlation among them (Dickerson, 1962; Schaeffer, 2001). c) To model the variation in phenotypic performance under the different environments, this is named reaction norm (Lynch and Walsh, 1998).
The Shukla's variance allows to assess the study of GEI, and to use the Bayesian Methodology for estimating the model with the Shukla's variance to improve the selection of genotypes by high yield and phenotypic stability and it is more appropriate when the prior information is available (Cotes et al., 2006).
On the other hand, Su et al. (2006) proposed the use of reaction norms under Bayesian analysis in order to achieve better parameters for interpreting GEI. This research was carried out to estimate GEI and the phenotypic stability in multibreed beef cattle production, located in different agroecological regions of the Colombian Northwest.
Materials and methods
The Animal Care and Use Committ ee approval was not obtained for this study, because the data were obtained from an existing database in La Leyenda farm.
Three agroecological regions (environments) were considered: The first one (E1) was located in the Southwest region of Antioquia department (altitude: between 500 and 800 m above sea level; yearly average temperature: 27 ºC; precipitation around 2050 mm/yr). The zone was classified as sub-tropical humid forest (bh-ST; Holdridge, 1996). Soils were very fertile and 60% of the lands were undulated. The second region (E2) was located in the border between Antioquia and Córdoba departments (altitude: between 60 and 150 m above sea level; yearly temperatures ranged from 28 ºC to 30 ºC; precipitation: from 2000 to 2200 mm/yr). The zone was classified as tropical humid forest (bh-T; Holdridge, 1996). Soil fertility ranged from low to very low, and the land was mostly flat. The last region (E3) was located in Córdoba and Sucre departments (altitude: between 0 and 150 m above sea level; yearly temperature ranged from 27 to 32 °C; precipitation ranged from 1000 to 1400 mm/yr). This zone was classified as tropical dry forest (bs-T; Holdridge, 1996), and its soils were fairly fertile and the land is mostly flat.
Data from 16 herds managed by the company Custodiar S. A. were used. Four of them were raised in E1, six in E2 and six in E3. All animals were born one herd located in E2, after weaning, most of the female calves stayed in this farm while all males were distributed in the other farm and environments (Table 1).
Records used corresponded to animals born between years 1995 and 2006, with weight at weaning 12, 18, and 24, months of age. Animals used included several crossbreeds of Angus (A), Blanco Orejinegro (B), Zebu (Z), Romosinuano (R), Senepoll (S), and Holstein (H) (Table 1). Zebu included commercial crossbred Bos indicus cattle of Brahman, Guzerat, and Nellore origins, and Brahman sires imported from the USA. For all evaluated traits, each genetic group had at least 10 animals in two of the agroecological regions (Table 1).
After filtering the original data base, 14 groups were analyzed for weight at 12 months of age (W12), with 1806 records and ages between 315 and 415 days; 11 groups were analyzed for weight at 18 months of age (W18) including 1455 records and ages between 500 and 600 days; finally 10 groups were analyzed for weight at 24 months of age (W24) with 1197 records and ages between 680 and 780 days.
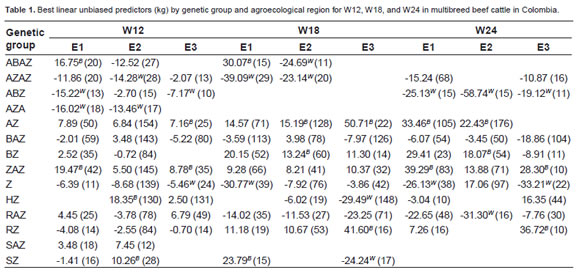
Remark in parenthesis is the number of animal for genetic group. Superscript in the same column indicates better (B) and worst (W) genetic groups for each agroecological region.
Contemporary groups were formed by sex (male or female), season (dry, from December to March; wet, from April to November) and year of weighting (from 1995 to 2007).
The following mixed model was used to analyze W12, W18 and W24:
y = X1è + X2β + Z1ã + Z2õ+ Z3ä + å [1];
Where:
y = vector of records of weights;
X1 = design matrix related with the effect of contemporary group è;
X2 and β = design matrix and regression coeffi cient of animal age (covariate), respectively;
Z1 and ã = incidence matrix and vector of genetic group effects, respectively;
Z2 and õ = incidence matrix and vector of environment effects, respectively;
Z3 and ä = incidence matrix and vector of genetic group by environment interaction effects, respectively;
å = vector of residuals.
Effects of genetic group, environment, genetic group by environment interaction, and the residual were considered random effects and were considered to be normally distributed with mean zero and variances: Iσγ2, Iσυ2, Iσδ2 and Iσε2, respectively. For estimating all parameters in model [1] the MIXED procedure of SAS (2006) program was used.
The Shukla's variance (Shukla, 1972) and Bayesian method proposed by Cotes et al. (2006) was used. Thus, model [1] was modified as follows:
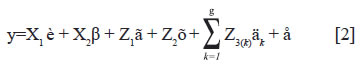
Where:
Z3(k) and äk = incidence matrix and vector of genetic group by environment interaction effects kth for the group (k=1,2,…,g). This model [2] assumes heterogeneity variance for kth genetic group among environments. Thus, the effects äk were considered to be normally distribution with mean zero and variances Iσδ2(k) (Kang and Magari, 1996; Magari and Kang, 1997; Piepho, 1999; Cotes et al., 2006).
The Bayesian estimation included a noninformative prior distribution for all the parameters, as follows:
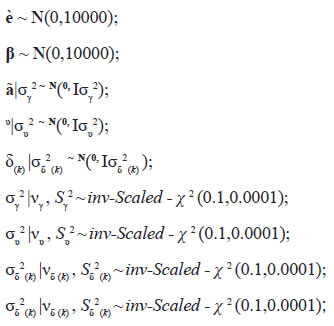
Where Inv-Scaled-χ2 indicates a scaled inversechi-square. Samples of joint posterior distribution were obtained using GIBBS sampler, which was programmed in SAS/IML (2006).
Results
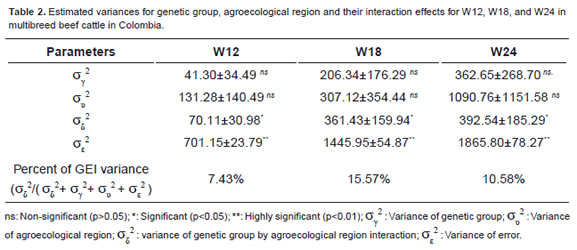
Both, age covariate and c ontemporary group effect were highly significant (p<0.001) for W12, W18, and W24 (Table 2). GEI was observed between genetic group and agroecological region (p<0.05) for the three evaluated traits. Main effects of genetic groups and agroecological region were non-significant (Table 2).
Genetic group by agroecological region interaction
Weight at 12 months of age
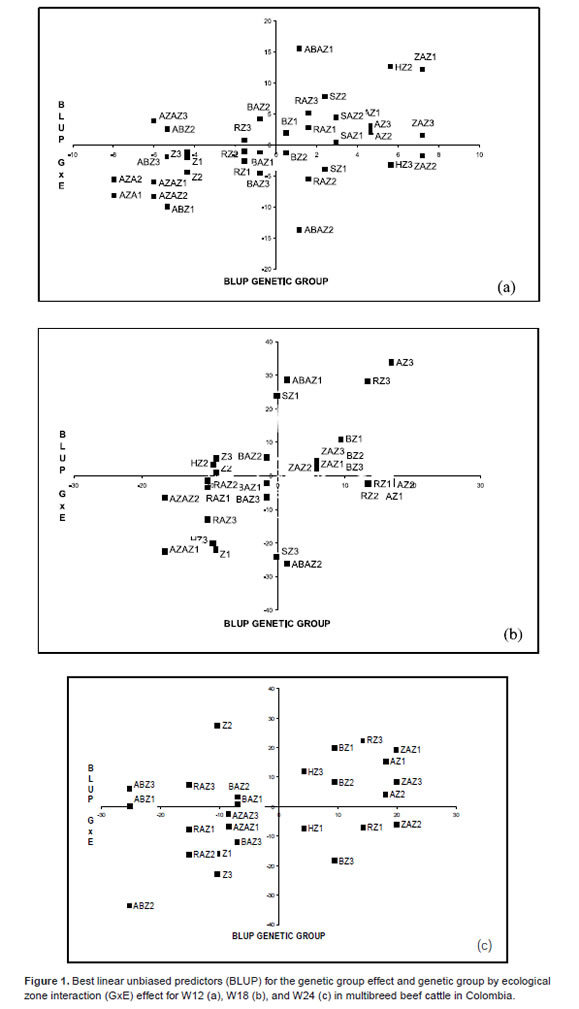
Agroecological region 1 (E1). Genetic groups of highest performance for W12 were ZAZ and ABAZ (Fig. 1). These groups did not show significant differences (p>0.05) among themselves, but both of them had significant differences (p<0.05) with the rest of genetic group. AZA, ABZ, and AZAZ groups showed the lowest performance, and had not significant differences (p>0.05) among themselves (Figure 1).
Agroecological region 2 (E2). HZ, SZ, SAZ, AZ, and ZAZ groups had a highest performance (although a non-significant difference was observed among themselves; p>0.05). The HZ group showed significant differences from groups whit the lowest performance (AZAZ, AZA, ABAZ, Z, RAZ, and RZ; Figure 1a).
Agroecological region 3 (E3). A non-significant difference was observed among genetic groups (p>0.05).
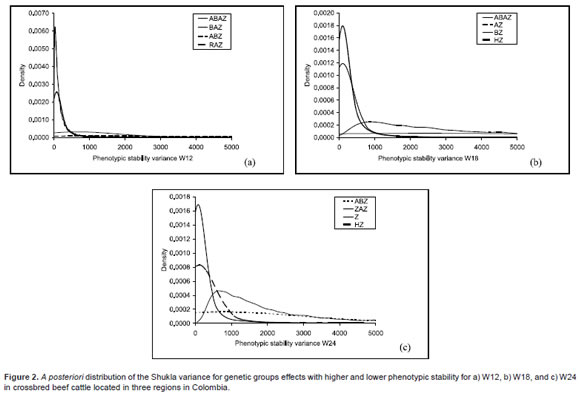
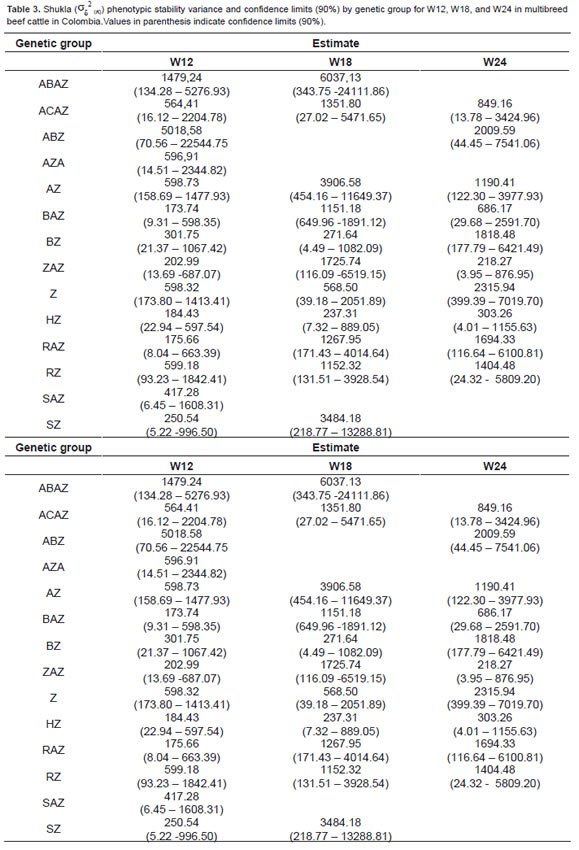
Phenotypic stability analysis. The genetic group BAZ, RAZ, HZ, and ZAZ showed a high stability, with low variances (Table 3). Groups with high variances and low stability were ABZ and ABAZ (Figure 2).
Performance and stability analysis. Summarizing the results for W12, group ABAZ has high performance in E1, but also a low performance in E2, underlying the importance of GEI analysis. ZAZ group performed well in E1 and E2, while ABZ (the least stable group) performed poorly.
Genetic groups with crosses between Angus (A), Blanco Orejinegro (B), Zebu (Z), Holstein (H), Romosinuano (R) and Senepoll (S); 1 (Agroecological region 1); 2 (Agroecological region 2); 3 (Agroecological región 3); (Genetic group of the sire)x(Genetic group of the dam): ABAZ (25%Ax25%B)x(25%Ax25%Z); AZAZ (37,5%Ax12,5%Z)x(25%Ax25%Z); ABZ (50%A)x(25%Bx25%Z); AZA (50%A) x(37,5%Zx12,5%A); AZ (50%A)x(50%Z); BAZ (50%B)x(25%Ax25%Z); BZ (50%B) x(50%Z); ZAZ (50%Z)x(25%Ax25%Z); Z (50%Z)x(50%Z); HZ (50%H)x(50%Z); RAZ (50%R)x(25%Ax25%Z); RZ (50%R)x(50%Z); SAZ (50%S)x(25%Ax25%Z); SZ (50%S) x(50%Z).
When BLUP of genetic group and GEI effects are graphically confronted for W12 (Figure 1a), it was found that ABAZ group in E1 (on the rightupper quadrant) had the highest BLUP. However, it was the lowest performance and had the lowest stability (Figure 2). Although had a positive BLUP, ABAZ group was located near the mean, and was exceeded by ZAZ, HZ, and AZ groups. These groups did not show important performance differences between zones and showed high stability. Regarding the low performance groups (left-lower quadrant), AZA had the lowest BLUP value and intermediate stability where it was evaluated. Groups such as AZAZ and Z showed intermediate stability and had low performance in most zones. The group ABZ (the least stable) showed only one positive BLUP, although it was close to the mean in E2.
Weight at 18 months of age
Agroecological region 1 (E1). ABAZ, SZ, and BZ genetic groups had the best performance for W18. AZAZ and Z genetic groups were the worst performers for W18 (Figure 1b), and a non-significant difference was found between themselves (p>0.05), but showed significant differences from the others groups (p<0.05).
Agroecological region 2 (E2): the AZ group had the best performance (Figure 1b). Groups ABAZ and AZAZ were the worst performance, and nonsignificant difference was found between them (p>0.05).
Agroecological region 3 (E3). AZ and RZ groups showed the best BLUP values and were significantly different (p<0.05) from the rest of genetic groups (Figure 1b). HZ, SZ and RAZ groups were the worst performance. The RZ group had a good BLUP in this zone, while RAZ had a negative BLUP. F1 groups, such as HZ and SZ, performed poorly.
Phenotypic stability analysis. HZ and BZ groups were the most stable for W18 (Table 3), with relatively lower variances. On the other hand, ABAZ, AZ, and SZ groups were the least stable, with higher variances (Figure 2). Some F1 were the most stable groups (HZ and BZ), although some other F1 groups showed lower stability (AZ and SZ).
Performance and stability analysis. ABAZ group had high performance in E1 but showed the lowest performance in E2. In the same way, SZ group had good performance in E1, but showed bad performance in E3.
AZ group had a good performance in E2 and E3, while BZ group had a poor performance in E1 and E2. However, AZAZ had a low performance in both environments.
When BLUP of main effect of the genetic group was confronted with BLUP for GEI effect (Figure 1b), AZ and RZ groups in E3 (located in the rightupper quadrant) had the highest BLUP, although both of them showed negative BLUP in E1 and E2. Group AZ was one of the least stable (Figure 2), while RZ had medium stability, which made BZ and ZAZ the best alternatives. These last two groups had positive BLUP values, but close to zero. Stability was high and medium for BZ and ZAZ groups, respectively (Table 3). As observed for W12, ABAZ had a good performance in E1, but had the worst performance in E2.
Regarding the groups with low performance (Figure 1b, left-lower quadrant), AZAZ had the lowest BLUP values and presented medium stability. Medium stability groups, such as RAZ and Z, had lower BLUP in most environments. HZ group, the most stable (Figure 2), had only one positive BLUP, although it was close to the average in E2, but it had the worst performance in E3.
Weight at 24 months of age
Agroecological region 1 (E1). ZAZ, AZ, and BZ genetic groups were the best groups for W24 (Fig. 1c). These groups did not show significant difference from the groups of worst performance (p>0.05; Z, ABZ, and RAZ). In the groups of worst performance a non-significant difference was found among themselves (p>0.05).
Zebu and BZ, AZ, and ZAZ groups had good performance in this environment. On the other hand, Z, ABZ, and AZAZ groups had negative values of BLUP.
Agroecological region 2 (E2). Genetic groups with high performance were AZ, BZ, Z and ZAZ (p>0.05). Genetic groups with low performance were ABZ and RAZ (p>0.05). There was significant difference between these groups (p<0.05) (Figure 1c). Similar to W12 and W18, F1 groups with dam Z had a high performance mating with Bos taurus and ZAZ. Contrary to W12 and W18 result, Zebu demonstrated to be a good option here. The ABZ group showed low BLUP, as for W12, in this agroecological region.
Agroecological region 3 (E3. The RZ and ZAZ groups were the best performance groups (Figure 1c), but a non-significant difference between themselves (p>0.05) was found, but the RZ group differed from another genetic group (p<0.05). On the other hand, groups of poorest performance were Z, ABZ, and BAZ, and a non-significant difference was found between themselves (p>0.05). Similar to W18, RZ group had good performance in this agroecological region, as well as in E1 and E2.
Phenotypic stability analysis. The most stable groups for W24 were ZAZ and HZ (Table 3), which had relatively lower variances. On the other hand, the least stable groups were Z and ABZ (Figure 2).
Performance and stability analysis: Groups performed in different ways in each agroecological region. It Z group was the best performance in E2 but it was the worst in E1 and E3.
When the BLUP's of the main effect of genetic group were confronted with the BLUP's of the GEI effect for W24 (Figure 1c), ZAZ in E1 and E3 (right-upper quadrant) had good BLUP values. This group showed negative BLUP in E2, although close to the average, and it was the most stable group (Figure 2). Group AZ had medium stability with good BLUP values where it was evaluated (E1 and E2). Groups HZ and RZ, which performed well in E3 had negative BLUP's in E1. The contrary happened with BZ, which performed well in E1 and E2, but had negative BLUP's in E3.
On the other hand, the lowest performance groups (Figure 1c, left-lower quadrant), ABZ, RAZ, and Z had the lowest BLUP's values and stability (Figure 2). Several BLUP values were also calculated for those groups in the zones where they were tested. Thus, ABZ had the lowest values in E1 (ABZ1), while RAZ had the lowest in E1 and E2 (RAZ1 and RAZ2), and Z had the lowest in E1 and E3.
Comparative analysis
Table 1 summarizes the best and worst genetic groups in each agroecological region for each trait, according to performance and stability.
Discussion
Although in the GEI was non-significant in this study the GEI has been reported to be significant in several research studies, for example Domínguez et al. (2003) analyzed weights and gains of weight from different ages in México (including W12 and W18), and reported significant differences for GEI. They concluded that productive performance for each genetic group differs according to specific herd management. In Argentina, Molinuevo (1998) conducted a lineal regression analysis of gains of weight for genetic group and season combinations to determine GEI and compare high versus low growth potential steers fed on different pasture. The high potential groups were superior when the conditions improved. Carvalheiro et al. (2006) compared several Nellore x Hereford crossbred in different environments in Brazil. They reported significant differences for GEI on pre-weaning weight.
Genetic group by agroecological region interaction
Weight at 12 months of age
Agroecological region 1 (E1). in this region, genetic groups with AZ dams had the best performance. An exception occurred when the sire was 75% A x 25% Z (group AZAZ), for the high percent of Angus which revealed signs of lack of adaptation to this region. Similarly, groups with Angus sires (AZA and ABZ groups) showed low performance. Schatz et al. (2005), reported that under tropical conditions, increasing Bos taurus proportions decrease post weaning growth.
Agroecological region 2 (E2). When groups combined Z dams with Bos taurus sires breeds (no including Creole breeds), the performance of W12 was increased in this region. The AZAZ group, which had a high performance in E1, but had a poor performance in E2, showed a very strong GEI.
Agroecological region 3 (E3). The nonsignificant difference found may be because the agroecological region has the best environmental conditions for development of all the genetic groups.
Phenotypic stability analysis. Groups with AZ dams were the most stable when combined with Zebu or Creole breeds as the paternal group (BAZ, RAZ and ZAZ); but when the sire was AB, animals showed lower stability (ABAZ). In conclusion, when three breeds are crossed, AZ dams transmit higher stability, so they should be considered for genetic improvement programs.
Performance and stability analysis: Difference in the performance of the group ABAZ in E1 and E2, underlies the importance of GEI analysis. However, this group showed a low stability, which means that it requires specific agroecological conditions to improve its performance.
The ZAZ group performed well in E1 and E2, while ABZ (the least stable group) performed poorly here. This could be explained by postweaning adaptation factors of ABZ or by the lack of precocity of ABZ provided by Blanco Orejinegro (which is not present in the ZAZ group). This could also be explained by the low Bos indicus proportions in the ABZ group. And also it may explain the fact that the AZA group (composed by the same breeds as ZAZ, but in inverse proportions) performed poorly and had lower stability.
Weig ht at 18 months of age
Agroecological region 1 (E1). ABAZ, SZ, and BZ genetic groups had best performance for W18. AZAZ and Z genetic groups were the worst performers for W18 (Fig. 1b), with a non-significant difference between themselves (p>0.05), but they showed significant differences from the others groups (p<0.05). According to Molinuevo (1998) similar results were obtained in Angus crossbreds for different feeding systems. Frisch and Vercoe (1984), Brown et al. (2001), and López and Vacaro (2002) also reported opposite results for several European crossbreds compared to Brahman under tropical conditions. This was explained by the high productive potential of Bos taurus and the high adaptive potential of Zebu, which can or cannot be expressed according to the prevalent environmental and management conditions.
Agroecological region 2 (E2). The differences found between groups at 12 months of age were lost 6 months after. This may be because the environments have an important effect in early stages of animal development (Meyer et al., 1993; Elzo et al., 1998).
Agroecological region 3 (E3). In this region, crossbreds with AZ dams continue to be productive at 18 months, but when the Romosinuano was included in crossbreds of three breeds it showed a disadvantage in this period, underlying the importance of the specific adaptations of crossbreds.
High heterosis levels and the balance between productive and adaptive potential of Bos taurus and Zebu explain the high performance of F1 crossbreds (Madalena, 2001; López and Vacaro, 2002; Plasse, 2003; Carvalheiro et al., 2006). This may be one of the advantages of Colombian Creole cattle which is Bos taurus mainly.
Phenotypic stability analysis. As for W12, the group ABAZ was the least stable, and the HZ group had the lowest variance. This suggested the need of making specific recommendations to each agroecological region, with the objective of increasing the stability of the production of beef cattle.
Performance and stability analysis. Differences in the performance of some groups in the different regions indicate the importance of the GEI analysis, in order to improve the meat production in each environment.
The AZ group had a good performance in E2 and E3, while BZ group had a poor performance in E1 and E2. However, the AZAZ had a low performance in both environments. It should be noticed that groups with good performance were F1, while the AZAZ group (which performed also poorly for W12 in those zones) had a different genetic composition (5/8 Angus x 3/8 Zebu).
The differences in stability of different genetic groups are in agreement with Frisch and Vercoe (1984) and Hartman (1990), who recommended specific genetic groups for specific environments.
Weight at 24 months of age
Agroecological region 1 (E1). The performance of Z, ABZ, and AZAZ groups coincides with their lower performance for W12 and W18 in this environment. Madalena (2001) and López and Vacaro (2002), reported a tendency to favor F1 crossbreds. Molinuevo (1998) in Argentina, Frisch and Vercoe (1984), and Brown et al. (1997) in tropical conditions, highlighted heterosis between Bos taurus and Zebu, which would express depending on the management and conditions supplied.
Agroecological region 2 (E2). The results in this region support the idea of the farmers that having animals with a Zebu genetic composition in this environment (with poorest soils), is the best option. For another type of environment the use of Zebu animals are not necessary. Reports by Frisch and Vercoe (1984), Brown et al. (1997), Brown et al. (2001), and Beffa (2005), do not show clear conclusions when comparing several crossbreds of Zebu with Bos taurus under tropical conditions. The common conclusion is conducting additional research in order to establish specific environments for specific lines or crossbreds. Other researchers, such as Madalena (2001), López and Vacaro (2002), Plasse (2003) and Carvalheiro et al. (2006), have reported a slight tendency to use F1 crossbreds in beef cattle.
Agroecological region 3 (E3). This result in this region shows that the RZ genetic group did not show differences between ages, and it is a good option for beef cattle production in Colombia (Martínez, 1998; Torregrosa et al., 2006).
Phenotypic stability analysis. Results of phenotypic stability analysis suggest that in ages, with no maternal influence, the ability of animal growth is strongly influenced by their genetic composition and environmental conditions in which animals grow.
Performance and stability analysis. The difference in the performance of genetic groups may be because Zebu has a good adaptation in fertile and poor soils, but when conditions improve, other groups have higher performace (e.i, the ZAZ group).
Comparative analysis
Although the GEI was observed for the three traits, it was also observed that several groups had a high performance in most of the environments for several traits. Groups AZ, ZAZ, and BZ had high performance in E1 and E2. Groups ABZ, RAZ, and AZAZ showed low performance for all three traits in several environments. Thus, when breeds such as Angus is introduced, the results will depend on different factors, including breed complementarity, breed proportion, and selection of sires and dams. This is in agreement with those results reported by Hartman (1990), Molinuevo (1998), and Madalena (2001).
GEI were significant for W12, W18 and W24. Some genetic groups showed high performance in specific agroecological regions. Groups that had high performance for a particular trait, did not necessarily perform well for the other traits evaluated. This could be due to factors such as adaptability, precocity, heterozygosis, breed proportion, weather and soil conditions, or other conditions and management present in each farm. However, some groups excelled in most zones for most of the traits, such as AZ, ZAZ, and BZ. On the other hand, groups such as ABZ, RAZ, and AZAZ performed poorly for the three traits in almost all of the regions. The ideal Bos taurus proportions for W12, W18, and W24 is close to 50%, when this proportion increases, the response for the evaluated traits decreases.
Acknowledgments
Authors thank Custodiar S.A. company for facilitating the data sets to conduct this research. Authors also appreciate the financial support of CODI of the University of Antioquia.
References
1. Arnold J, Bertrand J, and Benyshek L. Animal model for genetic evaluation of multibreed data. J Anim Sci 1992; 70:3322-3332. [ Links ]
2. Beffa L. Genotype x environment interaction in Africander cattle. Thesis PhD. Faculty of Natural and Agricultural Sciences. University of the Free State. 2005. [ Links ]
3. Brown M, Brown A, Jackson W, and Miesner J. Genotype x environment interactions in Angus, Brahman, and reciprocal cross cows and their calves grazing common Bermudagrass and endophyte-infected tall fescue pastures. J Anim Sci 1997; 75:920-925. [ Links ]
4. Brown M, Brown A, Jackson W, and Miesner J. Genotype x environment interactions in milk yield and quality in Angus, Brahman, and reciprocal-cross cows on different forage systems. J Anim Sci 2001; 79:1643-1649. [ Links ]
5. Carvalheiro R, Pimentel E, Cardoso V, Queiroz A, and Fries L. Genetic effects on preweaning weight gain of Nellore-Hereford calves according to different models and estimation methods. J Anim Sci 2006; 84:2925-2934. [ Links ]
6. Cotes J, Crossa J, Sanches A, and Cornelius P. A Bayesian Approach for Assessing the Stability of Genotypes. Crop Sci Soc of Amer 2006; 46:2654-2665. [ Links ]
7. Dickerson G. Implications of genetic-environmental interactions in animal breeding. Anim Prod 1962; 4:47-63. [ Links ]
8. Dominguez J, Núñez R, Ramírez R, and Ruíz A. Environmental effects and repeatability for growth traits in Tropicarne cattle. Tec Pecu Mex 2003; 41:1-18. [ Links ]
9. Elzo MA and Famula T. Multibreed sire evaluation procedure within a country. J Anim Sci 1985; 60:942-952. [ Links ]
10. Elzo MA, Manrique C, Ossa G, and Acosta O. Additive and nonadditive genetic variability for growth traits in the Turipana Romosinuano-Zebu multibreed herd. J Anim Sci 1998; 76:1539-1549. [ Links ]
11. Falconer D and Mckay J. Introduction to quantitative genetics. 4th ed. England: Longman Group Ltd; 1996. [ Links ]
12. Falconer D. The problem of environment and selection. Amer Nat 1952; 86:293-299. [ Links ]
13. Frisch J and Vercoe J. An analysis of growth of different cattle genotypes reared in different environments. J of Agr Sci 1984; 103:137-153. [ Links ]
14. Hartman W. Implications of genotype-environment interactions in animal breeding: Genotype-location interactions in poultry. World's Poultry Sci J 1990; 46:197-210. [ Links ]
15. Huhn M. Nonparametric analysis of genotype x environment interactions by ranks. In: Kang MS and Gauch HG. Genotype by environment interaction. New York: CRC Press; 1996. p. 235-271. [ Links ]
16. Holdridge L. Ecología basada en zonas de vida. San José de Costa Rica: Instituto interamericano de cooperación para la agricultura; 1996. [ Links ]
17. Kang M and Magari R. New development in selecting for phenotypic stability in crop breeding. Genotype-byenvironment interaction. New York: CRC Press; 1996. p.1-14. [ Links ]
18. Lynch M, and Walsh B. Genetics and analysis of quantitative traits. Massachusetts: Sinauer Associates; 1998. [ Links ]
19. López J and Vacaro L. Comparative performance of Holstein Friesian and Brown Swiss crosses with zebus in dual purpose production systems in three regions of Venezuela. Zootec Trop 2002; 20:397-414. [ Links ]
20. Madalena F. Consideration on models to predict crossbred performance in cattle. Arch Latinoam Prod Anim 2001; 9:108-117. [ Links ]
21. Magari R and Kang MS. SAS-STABLE: Stability analysis of balanced and unbalanced data. Agrono J 1997; 89:929-932. [ Links ]
22. Martínez G. El ganado criollo Romosinuano (Romo). Agri 1998; 24: 1-11; [Fecha de acceso: Dic. 17-2008] URL: http://www.cattlenetwork.net/docs/agri/agri24_1.pdf. [ Links ]
23. Meyer K. Estimates of variances due to sire x herd interactions and environmental covariances between paternal half-sibs for first lactation dairy production. Livest Prod Sci 1987; 17:95-115. [ Links ]
24. Meyer K, Carrick J, and Donnelly B. Genetic parameters for growth traits of Australian beef cattle from a multibreed selection experiment. J Anim Sci 1993; 71:2614-2622. [ Links ]
25. Molinuevo H. Selección de bovinos para sistemas de producción en pastoreo. Rev. Arg Prod Anim 1998; 18:227-245. [ Links ]
26. Plasse D. El uso del ganado criollo en pro gramas de cruzamiento para la producción de carne en América Latina. Documentos FAO; 2003; [Fecha de acceso: Jan. 23-2009] URL: http://www.fao.org/docrep/009/ah223s/AH223S08.htm#ch4.7 [ Links ]
27. Piepho H. Stability analysis using the SAS system. Agron J 1999; 91: 154-160. [ Links ]
28. SAS. SAS OnlineDoc 9.1. SAS Institute Inc., Cary, NC, USA. 2006 [ Links ]
29. Schaeffer L. Multiple trait international bull comparisons. Livest Prod Sci 2001; 69:145-153. [ Links ]
30. Schatz TJ, Ridley PER, and O`brien PJ. Effect of Charolais content on post weaning growth of brahman cross steers in the douglas daly region of the northern territory. Ani Prod Aust 2005; 25: 309; [Fecha de acceso: Jan. 23-2009] URL: http://www.publish.csiro.au/?act=view_file&file_id=SA0401154.pdf. [ Links ]
31. Shukla G. Some statistical aspects of partitioning genotype -environment components of variability. Heredity 1972; 29:237-245. [ Links ]
32. Su G, Madsen P, Lund M, Sorensen D, Korsgaard I, and Jensen J. Bayesian analysis of the linear reaction norm model with unknown covariates. J Anim Sci 2006; 84:16 [ Links ]
33. Torregroza L, Cuadrado H, and Pérez J. Beef producction in steers F1 Romo-Zebu with grass Angleton (Dichantium aristatum) ensitlages and supplements in Sinu Valley. Rev MVZ Córdoba 2006; 11: 825-829. [Fecha de acceso: Feb. 16-2009] URL: http://redalyc.uaemex.mx/redalyc/pdf/693/69311207.pdf. 51-1658. [ Links ]

