


Serviços Personalizados
Journal
Artigo
 Inglês (pdf)
 Artigo em XML
 Referências do artigo
 Enviar este artigo por email
Indicadores
-
 Citado por SciELO
 -
 Acessos
Links relacionados
-
 Citado por Google
 -
 Similares em
SciELO
Similares em
SciELO -
 Similares em Google
Compartilhar

 Permalink
Revista Colombiana de Ciencias Pecuarias
versão impressa ISSN 0120-0690versão On-line ISSN 2256-2958
Rev Colom Cienc Pecua v.23 n.4 Medellín out./dez. 2010
Artículos originales
Analysis of genetic diversity in Colombian buffalo herds¤
Análisis de la diversidad genética del búfalo en Colombia
Análise da diversidade genética de búfalos na Colômbia
Paula A Ángel-Marín1,2*, Lic Biol. MSc; Henry Cardona1,2, Zoot. DrSc; Manuel Moreno-Ochoa, Biol. MSc; Mario F Cerón-Muñoz1,2×, Zoot. DrSc
1Grupo de Investigación en Genética, Mejoramiento y Modelación Animal GaMMA, 2Facultad de Ciencias Agrarias e Instituto de Biología de la Universidad de Antioquia, Medellín Colombia
(Received: 13 august, 2010; accepted: 8 november, 2010)
Summary
Estimates of genetic diversity provide useful information on the genetic structure of animal populations, useful for the design of improvement strategies to impact traits of economic interest. They can also be used for implementing conservation and restoration policies regarding the sustainable use of genetic resources. The aim of this study was to characterize the genetic structure of buffalo population (Bubalus bubalis) in the most representative Colombian provinces by using 10 microsatellite markers. A total of 588 individuals were sampled from 12 buffalo herds. The MGTG7 and ETH225 microsatellites were monomorphic. Eighty seven alleles were observed for all the loci. The average number of alleles was 10.9 ± 3.6 and the effective average number of alleles was 3.9 ± 1.4. The PIC values ranged between 0.5 and 0.8, and the probability of exclusion over all loci was over 99.99%. The highest value for the Ho population was 0.68, and the lowest was 0.60. The GST value for the total loci was 0.062, indicating a very low level of genetic structure among subpopulations. Values for genetic distance between populations and racial groups were very low, suggesting there is still a genetic mix within buffalo herds in the analyzed population.
Key words: genetic structure, microsatellites, paternity test.
Resumen
Las estimaciones de diversidad genética del búfalo en Colombia proveen información útil para conocer su estructura genética, diseñar programas de cría y mejoramiento genético para características de interés económico, e implementar políticas de conservación para la utilización sostenible y restauración de los recursos genéticos. El objetivo de este estudio fue caracterizar y determinar la estructura genética de la población bufalina (Bubalus bubalis) en las provincias (Departamentos) Colombianos más representativos, por medio de 10 marcadores microsatélites. Se muestrearon 588 individuos de 12 hatos bufalinos de Colombia. Los microsatélites ETH225 y MGTG7 fueron monomórficos. Se observó un total de 87 alelos para el total de los loci, el número de alelos observados promedio fue de 10.9 ± 3.6 y el número efectivo de alelos promedio fue de 3.9 ± 1.4. Los valores de PIC variaron entre 0.5 y 0.8, y la probabilidad de exclusión sobre todos los loci fue superior al 99.99%. El valor más alto de Ho por población fue de 0.68 y el más bajo 0.60. El valor promedio de GST para el total de los loci en la población total de búfalos fue de 0.062, indicando un grado muy bajo de estructura genética entre las subpoblaciones. Los valores de distancia genética fueron muy bajos entre poblaciones y entre grupos raciales, lo cual indica que aún existe una alta mezcla genética en los hatos bufalinos en Colombia.
Palabras clave: estructura genética, microsatélites, pruebas de paternidad.
Resumo
Os estimativos de diversidade genética de búfalos na Colômbia são parâmetros muito importantes para conhecer a estrutura genética desta população. Com este conhecimento pode-se desenhar de forma adequada cruzamentos e programas de melhoramento genético para características de importância econômica. Alem disto, serve para pôr em prática políticas de conservação sustentável no uso dos recursos genéticos. O objetivo deste estudo foi caracterizar e determinar a estrutura genética da população dos búfalos (Bubalus bubalis) nos estados mais representativos da Colômbia, utilizando 10 marcadores microsatélites. Amostraram-se 588 indivíduos em 12 fazendas dedicadas a produção de búfalo. Os microsatélites MGTG7 e ETH225 foram monomórficos. Encontraram-se um total de 87 alelos, o número médio de alelos por locus foi 10.9 ± 3.6 e o número médio de alelos efetivos foi 3.9 ± 1.4. Os valores de PIC estiveram entre 0.5 e 0.8, e a probabilidade de exclusão de todos os loci foi superior a 99.99%. O maior valor da Ho foi 0.68 e o menor 0.60. O valor do Gst para a população total foi 0.062 indicando uma baixa estrutura genética entre as subpopulações. Os valores de distancia genéticos entre as diferentes populações de búfalos na Colômbia foram muito baixas indicando que existe uma alta mistura.
Palavras chave: estrutura genética, microsatélites, teste de paternidade.
¤ To cite this paper: Ángel-Marín PA, Cardona H, Moreno-Ochoa M, Cerón-Muñoz M. Analysis of genetic diversity in Colombian buffalo herds. Rev Colomb Cienc Pecu 2010; 23:411-421.
* Corresponding author: * paulaandreamarin@gmail.com × mceronm@hotmail.es
Introduction
Buffalo species (Bubalus bubalis; Artiodactyla: Bovidae) was introduced as Bufalypso breed to Colombia from Trinidad and Tobago in the 60s. There were subsequent imports of the Bulgarian and Brazilian Murrah breeds from Venezuela and Brazil, and semen of Mediterranean breed from Italy (Torres, 2009). Since the beginning, Colombian buffalo farmers have tried cross-breeding between different racial groups in an attempt to improve milk and meat production, resulting in a high proportion of crossbred animals.
In specialized breeds, availability of data on genetic variability help to adequately plan the programs on assisted reproduction, such as artificial insemination and embryo transfer, without seriously affecting genetic diversity, and avoiding high levels of inbreeding.
Microsatellite markers are highly polymorphic, co-dominant, neutral and profusely distributed in the genome. They are widely used for genome characterization and for the analysis of genetic diversity in different species. Several diversity and genetic characterization studies have been conducted using microsatellite markers in buffalo populations throughout the world. Navani et al. (2002) reported the amplification of a panel of 61 polymorphic microsatellite markers from cattle in a sample of 25 Murrah, Nili-Ravi and Mehsana buffalo breeds. Martinez et al. (2009) characterized two populations of Murrah breed in Colombia through six microsatellites. In addition, Aminafshar et al. (2008) analyzed the genetic structure of the Guilan buffalo population in Iran, using 14 microsatellites with a total of 58 alleles, finding considerable genetic variability. Kataria et al. (2009) used 25 microsatellites to evaluate genetic diversity and conducted bottleneck analysis of Nagpuri buffalo in India.
Diversity estimates provide useful information to understand the genetic structure of buffalo populations, for the design of breeding programs, and for the improvement of economic traits. They can also be used for conservation and restoration policies on sustainable use of genetic resources (Albuquerque et al., 2006; Arora et al., 2004; Barker et al., 1997a and 1997b; Mishra et al., 2009; Moioli et al., 2001a; Ritz et al., 2000; Vijh et al., 2008).
This study was aimed to characterize and determine the genetic population structure of buffalo Bubalus bubalis in the most representative provinces of Colombia, using 10 microsatellite markers.
Materials and methods
Sampling and DNA isolation
Hair bulb samples were taken from the tail of 588 male and female animals of five genetic groups: Brazilian Murrah (MBR), Bulgarian Murrah (MBUL), Colombian Buffalo (BC), crossbreeds of BC, MBUL and MBR (MZ), and Murrah by Absorption (MPA). Genealogy of most of the animals was registered at the Colombian Association of Buffalo Breeders (ACB). A total of twelve cattle herds were sampled. The herds were located in four Colombian provinces: Antioquia, Caldas, Córdoba and Magdalena, which comprise most of the buffalo population in the country.
DNA analysis was conducted with a DNA extraction and purification kit (DNeasy Blood & Tissue Kit, QIAGEN Inc, Hilden, Germany). The final concentration of the samples was 50 ng / ml, using the standard described by Angel et al. (2010).
Genotyping and microsatellite loci
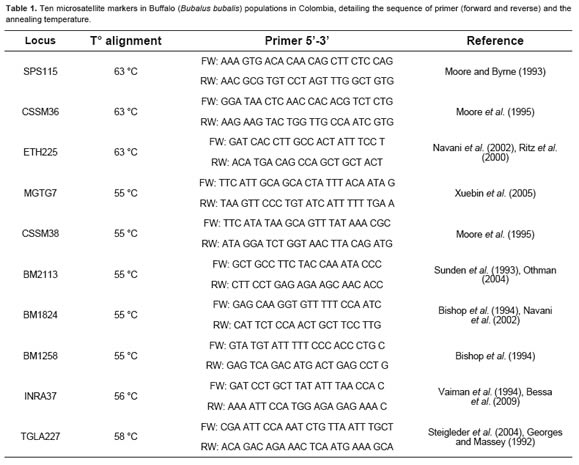
A total of 10 microsatellites were analyzed. Microsatellites, located on different chromosomes, were originally identified in cattle, and the amplification conditions for each locus were previously standardized by Angel et al. (2010) (Table 1).
A 6% polyacrylamide gel (19:1 acrylamide: bisacrylamide) was used for genotype determination in an electrophoresis chamber (Dedicate Height Dual Nucleic Acid Sequencer, CBS Scientific Company Inc, Del Mar, CA, USA) under constant conditions at 2000 V, 40 mA, 60 w, using 1X TBE buffer, and stained by nitric acid oxidation with silver nitrate, according to the method by Budowle et al. (1991).
The allele size of STR was based on the variable number of repetitions and compared with commercial allelic ladders (Fermentas Inc). Some alleles were selected for each locus and were sequenced (Macrogen, Rockville, MD, USA), confirming the repeated sequence and the allelic size.
Statistical analysis
Values of genetic diversity, mean number of alleles per locus (na), effective number of alleles per locus (ne) (Kimura and Crow, 1964), observed heterozygosity (Ho) and coefficient of genetic diversity (He) of Nei (1973) were estimated. The Hardy-Weinberg equilibrium test (HWE) was conducted using the Levene algorithm (1949), and significance was estimated using the likelihood ratio (G2) for each locus, which can be calculated independently of the sample size, using the Popgene simulation program for population genetics (Yeh and Yang, 1999).
Allele frequencies per locus were calculated for each population. Percentage of polymorphic loci was assessed by the GDA program (Lewis and Zaykin, 2001), taking into account that the most common allele frequency was lower than 95%. Polymorphic information content (PIC) for each marker was determined following the method described by Bostein et al. (1980). For the probability of individual and overall exclusion (PE) of the molecular markers, the formula of Jamieson and Taylor (1997) was calculated in Cervus 3.0 (Kallinowski et al., 2007).
The genetic structure for the total population and subpopulations was calculated using Wright’s F statistics (Wright, 1965), the coefficient of inbreeding by the method of Weir and Cockerham (1984), and a significance test on the estimates of Wright’s F-statistics was calculated by constructing 95% and 99% confidence intervals based on the standard deviations estimated by Jackknifing and bootstrapping with 5000 permutations using FSTAT. In addition, values of genetic differentiation among subpopulations (GST) for multiallelic locus were calculated using the method of Nei (1973) with the FSTAT (Goudet, 2002) and TFPGA (Miller, 1997) programs.
Values of identity / genetic distance were estimated using the Nei (1978) unbiased method for the total population. Genetic Distance was used to infer the phylogenetic relationship in populations and racial groups by means of the paired average distance method (UPGMA), algorithm based on the discussion of the use of sampling for bootstrap parsimony analysis (Felsenstein, 1985), with the TFPGA program (Miller, 1997).
Results
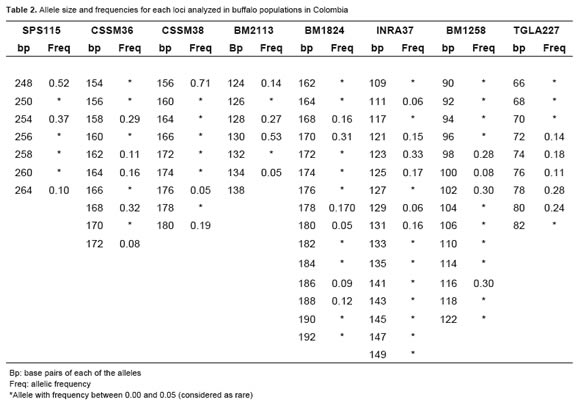
The MGTG7 and ETH225 microsatellites were monomorphic, with a single allele of 129 and 288 base pairs (bp), respectively. The allele frequencies values for polymorphic loci (SPS115, CSSM36, CSSM38, BM2113, BM1824, BM1258, and TGLA227 INRA37) ranged from 0.001 to 0.53. Rare alleles were observed in all the microsatellite markers tested (frequency <0.05; Table 2).
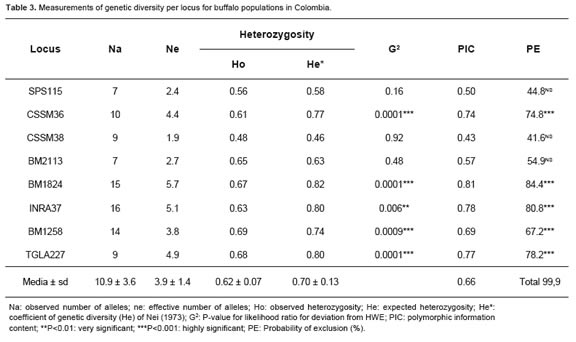
The percentage of polymorphic loci was 80%. There were 87 alleles for the eight polymorphic loci in the analyzed population. Thirty six of these alleles had a frequency greater than 0.05. The other 51 alleles were considered rare due to their low frequency. The mean for the observed number of alleles (na) was 10.9 ± 3.6, ranging from 7 for SPS115 and BM2113 loci, to 16 for INRA37. The effective number of alleles per locus (ne) showed lower values with respect to those observed, varying between 1.9 and 5.7 for CSSM38 and BM1824, respectively, with a mean of 3.9 ± 1.4 (Table 3).
Most markers had polymorphic information content (PIC) values between 0.5 and 0.8. The least informative marker was CSSM38 (0.43), and the most informative was BM1824 (0.81). The probability of a priori exclusion for the total polymorphic microsatellite was higher than 99.99%, indicating the usefulness of this set of markers for parentage testing of this species in Colombia (Table 3).
The Ho per locus ranged between 0.48 (CSSM38) and 0.69 (BM1258) with a mean of 0.62 ± 0.07. The genetic diversity index of Nei (1973) ranged between 0.46 (CSSM38) and 0.82 (BM1824) with a mean of 0.70 ± 0.13. Deviation from HWE test showed that CSSM36, BM1824, INRA37, TGLA227 and BM1258 microsatellites demonstrated highly significant differences (p <0.01) between Ho and He (Table 3).
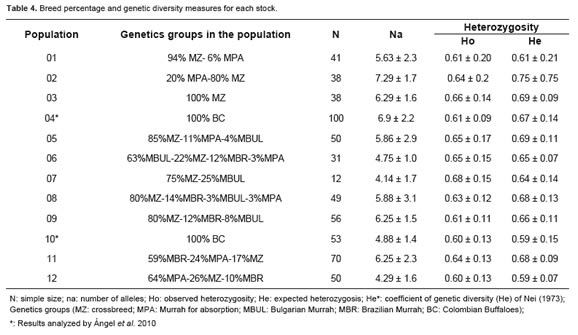
Genetic diversity values (na, Ho and He; Nei, 1973) estimated for different subpopulations are shown in Table 4. The values of Ho ranged from 0.60 to 0.68. Coefficient of genetic diversity (He) of Nei (1973) ranged between 0.59 and 0.75 (Table 4).
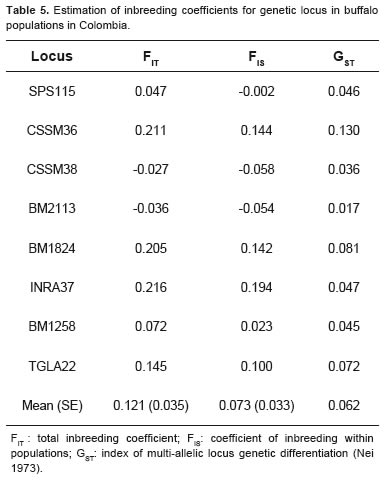
The estimated F-statistics per locus were FIT = 0.121 and FIS = 0.073. The multi-allelic analogue of is GST (Nei, 1973), which indicates the degree FST of genetic differentiation between populations. The average value for the total GST loci in the analyzed population was 0.062, indicating a very low degree of genetic structure among subpopulations (Table 5).
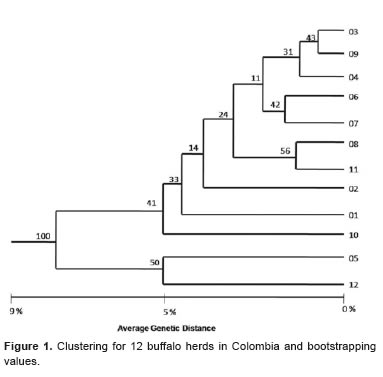
The clustering used for the 12 populations showed a scale of genetic distance ranging between 0.8% and 8.7%. Populations 03 and 09 had the smallest genetic distance value (0.8%) compared to other populations, while populations 05 and 12 had the greatest genetic distance value (5.5%). There were two groups separated by 8.7% genetic distance (Figure 1).
The percentage of mixed breed animals in the populations with low genetic distance (03 and 09) was very high (≥ 80%), which may explain the similarity between both populations. Population number 04, characterized for having only “Colombian Buffalo” (Bufalypso), had a high percentage of genetic identity (98.6%) with populations 03 and 09. Herds 06 and 07 showed little genetic distance (1.8%), which was also true for 08 and 11 (1.4%), On the other hand, populations 05 and 12 differed by 5.5%, forming a separate cluster from other populations, and had an 8.7% genetic distance value. The high genetic identity (≥ 91.3%) among all populations could be explained by the high introgression breed component in each herd, in addition to the crossbreeds of these animals with the Brazilian and Bulgarian Murrah genetic groups.
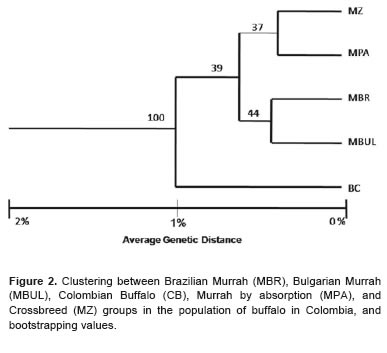
The dendrogram obtained for different genetic groups in the evaluated buffalo population demonstrated low genetic distance values, ranging between 0.8% and 2%. Bufalypso were genetically separated by 2% compared to the pure lines of Murrah (Bulgarian and Brazilian) and crossbreed animals (MZ and MPA). Mixed breed animals were very similar (99.2%) to pure bred Murrah through absorption, and likewise the lines resemble pure Brazilian and Bulgarian Murrah (Figure 2).
Discussion
The monomorphism found for loci ETH225 and MGTG7 confirms the results reported by Angel et al. (2010) in Bufalypso animals, by Martínez et al. (2009) in a sample of pure Murrah breed of Brazilian origin, and by Soysal et al. (2006) in Anatolian Buffalo. Contrary to these results, Navani et al. (2002) amplified the microsatellite ETH225 in Murrah, Nili-Ravi and Mehsana breeds, observing a single allele of 140 bp. Furthermore, Greyling et al. (2008) found two alleles (133 and 137bp) for ETH225 in African buffalo (Syncerus caffer).
These findings confirm that although buffalo species (Bubalus bubalis and Syncerus caffer) are genetically close, they differ in terms of genetic diversity (Greyling et al., 2008; Egito et al., 2007; Steffen et al., 1993; Liron et al., 2006). The mean number of observed and effective alleles and the high values of PIC indicate that markers SPS115, CSSM36, CSSM38, BM2113, BM1824, BM1258, TGLA227 and INRA37 are useful to explain genetic variability of buffalo species (Bubalus bubalis), and can be implemented for parentage testing in Colombia. Individual PE for SPS115, BM2113 and CSSM38 microsatellites was no significant. Therefore, PE calculation for the five markers with significant values was performed, and the observed result was 0.9998292. The combined probability for the 8 markers was significant (0,9999212), indicating that inclusion of these 3 markers significantly increases the combined PE to a value greater than 99.99%, which demonstrates the usefulness of these 3 markers for parentage analysis in this species.
The Ho and He mean values for the total loci were higher compared to those reported in different buffalo breeds (Kataria et al., 2009; Kathiravan et al., 2009; Martinez et al., 2009), but similar with respect to the values found by Mishra et al. (2009) in Chilika buffaloes in India, and by Moioli et al. (2001b) in Greek and Italian buffalo populations.
According to He values of Nei (1973), 10 of the studied populations had a heterozygote deficit, possibly explained by the high percentage of Murrah breed present in the purebred population, and to the presence of crossbred animals.
The observed deviation of HWE for loci CSSM36, BM1824, INRA37, BM1258 and TGLA227 can be explained by low genetic diversity in the sampled herds, because the sires belong to the same inbred line, mainly Murrah of Brazilian and Bulgarian origin.
Contrary to the findings by Navani et al. (2002), the BM2113 microsatellite PIC value indicates the usefulness of this genetic diversity assessments and the later parentage testing for this species. These results confirm the findings by Martínez et al. (2009) and Angel et al. (2010). The BM1824 microsatellite showed 3 alleles in a 25 river buffalo sample (Bubalus bubalis), with a range of 160196 bp allele (Navani et al., 2002). This study showed high polymorphism for this marker, and corroborates the findings in studies of Murrah and Colombian Buffalo (Martínez et al., 2009; Ángel et al., 2010).
Zhang et al. (2007) found 10 and 8 alleles for microsatellites CSSM36 and CSSM38, respectively, distributed in a population of river buffalo (Bubalus bubalis) and a population of swamp buffalo (Bubalus carabanensis). However, contrary to the findings of this study, other authors have reported a lower number of alleles (about five) for these markers in Bubalus bubalis (Aminafshar et al., 2008; Elbeltagy et al., 2008; Moioli et al., 2001a and 2001b). These results demonstrate a high degree of polymorphism for both microsatellites in Colombian buffalo populations, and the genetic mixing prevailing in the evaluated herds. Similar to this study, Greyling et al. (2008) found high values of PIC for SPS115, BM1824 and TGLA227 markers (0.80, 0.86, and 0.40, respectively) in a population of African buffalo (Syncerus caffer), thus proving that the microsatellites tested in this study are useful for the genetic characterization of buffalo species.
The GST value was low for all loci (0.062), indicating a heterozygote deficit which implies a low genetic differentiation between populations. It is clear that the racial percentage of each population has a great influence on this value, since most of them have a high component of cross-breed animals (Brazilian and Bulgarian Murrah). Compared with other studies on genetic diversity using microsatellites in Bubalus bubalis, low FST values were found, indicating little inbreeding and low genetic structure (Moioli et al., 2001b; Arora et al., 2004; Vijh et al., 2008).
Considering the history of buffalo introduction in Colombia, it is very likely that genetic drift or other processes have altered the balance, since the Colombian founding group was composed of a small number of breeding animals (110 females and 5 sires), which were then crossed with pure lines imported from Venezuela and Brazil.
Although high diversity was observed in the polymorphisms of the studied microsatelites, it is necessary to clarify that rare alleles were identified (low frequency), and many effective alleles are concentrated in particular populations. It is worth mentioning that some farms have been importing pure-breed animals and semen to improve their populations and thereby to mitigate the observed drift.
The values obtained for FIT y FIS showed a moderate level of inbreeding in the total population, while they are lower for each subpopulation, confirming that current populations are not genetically distinguishable from the original populations.
The cluster by racial groups confirms the low genetic distance between racial groups and herds. These results indicate that most of the analyzed Colombian buffalo herds include a high percentage of crossbreds and a low percentage of pure animals (Brazilian and Bulgarian Murrah). This indicates genetic mix and a minimal differentiation between populations, possibly because some of these populations were founders and disseminators of animals to different areas of the country.
There is high genetic diversity in buffalo populations in Colombia as measured by the high values of polymorphic information content per locus and by the observed heterozygosity in the total evaluated population. Nevertheless, it is clear that buffalo herds in Colombia still retain a high percentage of mixed breed animals, which gives no defined genetic structure to each population. Moreover, according to the genetic distance analysis, although there is a percentage of differentiation between the herds, these values are very low and defined genetic groups cannot be determined.
It is possible to implement affiliation tests using the eight polymorphic microsatellite markers analyzed in this study, given that the probability of exclusion for all loci was higher than 99.99%.
Acknowledgements
This paper was derived from the study titled “Strengthening the family registration system and dairy control in buffaloes and its impact on production and improvement of Colombian herds”. The authors would like to thank the Ministry of Agriculture and Rural Development and the Colombian Federation of Cattle (FEDEGAN), the University of Antioquia, and the Colombian Association of Buffalo Breeders (ACB) for funding and assistance.
References
1. Albuquerque MS, do Egito AA, Marques FJR, Ciampi YA, Mariante da Silva A, Castro RST, Costa MR, Paiva RS, da Silva MA, and Contel BEP. Variabilidade genética em búfalos estimada por marcadores RAPD. Pesq Agropec Bras 2006; 41: 623-628. [ Links ]
2. Aminafshar M, Amirinia C. and Vaez TR. Genetic Diversity in Buffalo Population of Guilan Using Microsatellite Markers. J Anim Vet Adv 2008; 7:1499-1502. [ Links ]
3. Ángel PA, Montoya AE, Martínez E, Cardona H, Moreno M, Cerón-Muñoz MF. Caracterización genética del búfalo Colombiano. Liv Res Rur Dev 2010; 22: Article 131. [ Links ]
4. Arora R, Lakhchaura BD, Prosad RB, Chauhan A, Bais RK, Tantia MS, Vijh RK. Physical and Microsatellite Based Characterization of Tarai Buffalo of India. Buffalo Newsletter 2004; 19: Jun. [ Links ]
5. Barker JS, Moore SS, Hetzel DJ, Evans D, Tan SG, Byrne K. Genetic diversity of Asian water buffalo (Bubalus bubalis): microsatellite variation and a comparison with protein-coding loci. Anim Genet 1997a; 28:103-115. [ Links ]
6. Barker JS, Tan SG, Selvaraj OS, Mukherjee TK. Genetic variation within and relationships among populations of Asian water buffalo (Bubalus bubalis). Anim Genet 1997b; 28:1-13. [ Links ]
7. Bessa I, Pinheiro I, Matola M, Dzama K, Rocha A, Alexandrino P. Genetic diversity and relationships among indigenous Mozambican cattle breeds. S Afri J Anim Sci 2009; 39:61-72. [ Links ]
8. Bishop MD, Kappes SM, Keele JW, Stone RT, Sunden SL, Hawkins GA, Solinas-Toldo S, Fries R, Grosz MD, Yoo J, Beattie CW. A Genetic Linkage Map for Cattle. Genetics 1994; 136:619-639. [ Links ]
9. Botstein D, White RL, Skolnick M, Davis RW. Construction of a genetic linkage map in man using restriction fragment length polymorphisms. Am J Hum Genet 1980; 32:314-331. [ Links ]
10. Budowle B, Chakraborty R, Giusti AM, Eisenberg AJ, Allen RC. Analysis of the VNTR locus D1S80 by the PCR followed by high-resolution PAGE. Am J Hum Genet 1991; 48:137-144. [ Links ]
11. Egito AA, Paiva SR, Albuquerque MM, Mariante AS, Almeida LD, Castro SR, Grattapaglia D. Microsatellite based genetic diversity and relationships among ten Creole and commercial cattle breeds raised in Brazil. BMC Genetics 2007; 8:83. [ Links ]
12. Elbeltagy AR, Galal S, Abdelsalam AZ, El Keraby FE, Blasi M, Mohamed MM. Biodiversity in Mediterranean buffalo using two microsatellite multiplexes. Liv Sci 2008; 114:341-346. [ Links ]
13. Felsenstein J. Confidence limits on phylogenies: an approach using the bootstrap. Evolution 1985; 39:783-791. [ Links ]
14. Georges M, Massey JM. Polymorphic DNA markers in Bovidae. Patent WO 1992; 92/13102. [ Links ]
15. Goudet J. FSTAT, a program to estimate and test gene diversities and fixation indices (version 2.9.3.2). 2002 [August 5, 2010]. URL: http//www2.unil.ch/popgen/softwares/fstat.htm [ Links ]
16. Greyling BJ, Kryger P, du Plessis S, van Hooft WF, van Helden P, Getz WM, Bastos AD. Development of a high-throughput microsatellite typing approach for forensic and population genetic analysis of wild and domestic African Bovini Afri J Biotechnol 2008; 7:655-660. [ Links ]
17. Jamieson A, Taylor CS. Comparisons of three probability formulae for parentage exclusion. Anim Genet 1997; 28:397-400. [ Links ]
18. Kallinowski ST, Taper ML, Marshall TC. Revising how the computer program CERVUS accommodates genotyping error increases success in paternity assignment. Mol Ecol 2007; 16:1512. [ Links ]
19. Kataria RS, Sunder S, Malik G, Mukesh M, Kathiravan P, Mishra BP. Genetic Diversity and Bottleneck Analysis of Nagpuri Buffalo Breed of India Based on Microsatellite Data. Russ j Gen 2009; 45:826-832. [ Links ]
20. Kathiravan P, Mishra BP, Kataria RS, Sadana D. Evaluation of genetic architecture and mutation drift equilibrium of Marathwada buffalo population in Central India. Liv Sci 2009; 121:288-293. [ Links ]
21. Kimura M, Crow J.F. The number of alleles that can be maintained in a finite population. Genetics 1964; 49:725-38. [ Links ]
22. Levene H. On a matching problem in genetics. Ann Math Stat 1949; 20:91-94. [ Links ]
23. Lewis PO, Zaykin D Genetic Data Analysis: Computer program for the analysis of allelic data. Version 1.0, (2001) [August 4, 2010]. URL: http://lewis.eeb.uconn.edu/lewishome/software.html. [ Links ]
24. Liron JP, Peral-Garcia P, Giomvambattista G. Genetic Characterization of Argentine and Bolivian Creole Cattle Breeds Assessed through Microsatellites. J Hered 2006; 97:331-339. [ Links ]
25. Martínez E, Tirado JF, Cerón-Muñoz MF, Moreno M, Montoya A, Corrales JD, Calvo SJ. Caracterización genética del búfalo Murrah en Colombia usando marcadores microsatélite. Liv Res Rur Dev 2009; 21: Article 14. [ Links ]
26. Miller MP Tools for population genetic analyses (TFPGA) 1.3: A windows program for the analysis for allozyme and molecular population genetic data. 1997 [Agust 3, 2010]. URL: http://www. marksgeneticsoftware.net/tfpga.htm [ Links ]
27. Mishra BP. Kataria RS, Bulandi SS, Prakash B, Kathiravan P, Mukesh M, Sadana DK. Riverine status and genetic structure of Chilika buffalo of eastern India as inferred from cytogenetic and molecular marker-based analysis. J Anim Breed Genet 2009; 126:69-79. [ Links ]
28. Moioli B, Georgoudis A, Napolitano F, Catillo G, Giubilei E, Ligda Ch, Hassanane M. Genetic diversity between Italian, Greek and Egyptian buffalo populations. Liv Prod Sci 2001a; 70:203-211. [ Links ]
29. Moioli B, Georgoudis A, Napolitano F, Catillo G, Lucioli S, Ligda Ch, Boyazoglu J. Genetic diversity between Italian and Greek buffalo populations. Animal Genetic Resources Information. Liv Prod Sci 2001b; 70:203-211. [ Links ]
30. Moore SS, Byrne K. Dinucleotide polymorphism at the bovine calmodulin independent adenylcyclase locus. Anim Genet 1993; 24:150. [ Links ]
31. Moore SS, Evans D, Byrne K. A set of polymorphic ADN microsatellites useful in swamp and river buffalo. Anim Genet 1995; 26:355-359. [ Links ]
32. Navani N, Jain PK, Gupta S, Sisodia BS, Kumar S. A set of cattle microsatellite DNA markers for genome analysis of riverine buffalo (Bubalus bubalis). Anim Genet 2002; 33:149-154. [ Links ]
33. Nei M. Analysis of Gene Diversity in Subdivided Populations. Proc Nat Acad Sci USA 1973; 70:3321-3323. [ Links ]
34. Nei M. Estimation of average heterozygosity and genetic distance from a small number of individuals. Genetics 1987; 89:583-590. [ Links ]
35. Otham EO. Chromosome and gene mapping homology between river buffalo, cattle and sheep using molecular markers. Biotech 2004; 3:119-125. [ Links ]
36. Ritz LR, Glowatzki-Mullis ML, MacHugh DE, Gaillard C. Phylogenetic analysis of the tribe bovini using microsatellites. Anim Genet 2000; 31:178-185. [ Links ]
37. Soysal MI, Ozkan E, Kok S, Occidente M, Tuna YT, Gurcan EK, Matassino D. Genetic characterization of indigenous anatolian water buffalo breed using microsatellite dna markers. Ital J Anim Sci 2007; 6:409-412. [ Links ]
38. Steffen P, Eggen A, Dietz AB, Womack JE, Stranzinger G, Fries R. Isolation and mapping of polymorphic microsatellites in cattle. Anim Genet 1993; 24:1221-1224. [ Links ]
39. Steigleder CS, Almeida EA, Weimer TA. Genetic Diversity of a Brazilian Creole Cattle Based on Fourteen Microsatellite Loci. Arch Zootec 2004; 53:3-11. [ Links ]
40. Sunden SL, Stone RT, Bishop MD, Kappes SM, Keele JW, Beattie CW. A highly polymorphic bovine microsatellite locus: BM2113. Anim Genet 1993; 24:69-69. [ Links ]
41. Torres GE Búfalos: Una Especie Promisoria. 2009 [August 5, 2010]. URL: http://www.perulactea.com/2009/09/30/búfalos-una-especie-promisoria/ [ Links ]
42. Vaiman D, Mercier D, Moazami-Goudarzi K, Eggen A, Ciampolini R, Lépingle A, Velmata R, Kaukinen J, Varvio SL, Martin P, Levéziel H, Guérin G. A set of 99 cattle microsatellites: characterization, synteny mapping, and polymorphism. Mamm Genome1994; 5:288-297. [ Links ]
43. Vijh RK, Tantia MS, Mishra B, Bharani KS. Genetic relationship and diversity analysis of Indian water buffalo (Bubalus bubalis). J Anim Sci 2008; 86:1495-1502. [ Links ]
44. Weir BS, Cockerham CC. Estimating F-Statistics for the analysis of population structure. Evolution 1984; 38: 13581370. [ Links ]
45. Wrigth S. Interpretation of population structure by Fstatistics with special regard to system of mating. Evolution 1965; 19:395-420. [ Links ]
46. Xuebin Q, Jianlin H, Lkhagva B, Chekarova I, Badamdorj D, Rege JE, Hanotte O. Genetic diversity and differentiation of Mongolian and Russian yak populations. J Anim Breed Genet 2005; 122:117-126. [ Links ]
47. Yeh FC, Yang R. POPGENE VERSION 1.31 Microsoft Window-based Freeware for Population Genetic Analysis. University of Alberta and Tim Boyle, Centre for International Forestry Research 1999. [ Links ]
48. Zhang Y, Sun D, Yu Y, Zhang Y. Genetic diversity and differentiation of Chinese domestic buffalo based on 30 microsatellite markers. Anim Genet 2007; 38:569-575. [ Links ]

