


Services on Demand
Journal
Article
 Spanish (pdf)
 Article in xml format
 Article references
 Send this article by e-mail
Indicators
-
 Cited by SciELO
 -
 Access statistics
Related links
-
 Cited by Google
 -
 Similars in
SciELO
Similars in
SciELO -
 Similars in Google
Share

 Permalink
Revista Colombiana de Ciencias Pecuarias
Print version ISSN 0120-0690On-line version ISSN 2256-2958
Rev Colom Cienc Pecua vol.25 no.2 Medellín Apr./June 2012
ARTÍCULO ORIGINAL
Genetic variability of Senepol cattle in Colombia using molecular markers¤
Variabilidad genética de bovinos Senepol en Colombia por marcadores moleculares
Variabilidade genética de gado Senepol na Colômbia por marcadores moleculares
Jeannie C Sepúlveda1, Zoot; Paula A Ángel–Marín1, Lic Biol, MSc; Alejandra Toro1, Zoot; Juan D Corrales1, Zoot, MS; Manuel A Moreno1, Biol, DrSc (c); Mario F Cerón–Muñoz1, Zoot, DrSc
* Corresponding author: Mario Fernando Cerón Muñoz. Facultad de Ciencias Agrarias. Universidad de Antioquia. Carrera 75 No. 65–87. Ciudadela de Robledo. Medellín, Colombia. Tel (574)2199140. E–mail: cerongamma@gmail.com.
1 Animal Genetic, Breeding and Modeling group (GaMMA), Facultad de Ciencias Agrarias e Instituto de Biología, Universidad de Antioquia, Medellín Colombia.
(Recibido: 10 diciembre, 2011; aceptado: 24 abril, 2012)
Summary
The Senepol beef cattle breed was introduced into Colombia through the use of artificial insemination and embryo transfer from a small nucleus of animals. Objective: to estimate the genetic variability of Senepol cattle in Colombia by heterologous microsatellites and to estimate gene and genotypic frequencies of single nucleotide polymorphic markers through calpastatin (CAST1), calpain (CALP316), and leptin (PB) genes. Methods: 412 blood samples from 28 herds were genotyped for population genetic structure with the STR: INRA32, BM2113, ETH10, BM1824, INRA037, ETH225, INRA064, SPS115, TGLA126, and TGLA122 microsatellite markers. Three SNPs of calpastatin, calpain, and leptin genes were used. Results: all microsatellites and SNP markers were polymorphic. The number of alleles ranged from 4 (BM1824) to 11 (INRA37), and the observed heterozygosity varied between 0.21 (INRA64) and 0.89 (BM2113). Combined probability of exclusion for the microsatellites was higher than 99.99%, indicating the usefulness of this set of markers for parentage testing in Senepol. Conclusions: despite being a small and closed population, this nucleus presents high genetic variability and low inbreeding.
Key words: beef cattle, genetic diversity, genetic structure, microsatellite marker.
Resumen
El ganado Senepol fue introducido en Colombia mediante el uso de la inseminación artificial y transferencia de embriones de un pequeño núcleo de los animales. Objetivo: estimar la variabilidad genética del ganado Senepol de Colombia por medio de marcadores microsatélites y estimar las frecuencias alélicas y genotípicas de SNPs en los genes que codifican para la calpastatina (CAST1), calpaína (CALP316) y leptina (PB). Métodos: 412 muestras de sangre de animales pertenecientes a 28 fincas fueron analizados para los STRs: INRA32, BM2113, ETH10, BM1824, INRA037, ETH225, INRA064, SPS115, TGLA126 y TGLA122 y los tres SNPs. Resultados: los microsatélites y los SNPs fueron polimórficos. El número de alelos de los microsatélites variaron entre 4 (BM1824) y 11 (INRA37), la heterocigosidad observada varió entre 0.21 (INRA64) y 0.89 (BM2113). La probabilidad de exclusión para el total de microsatélites fue mayor que 99.99%, indicando que el conjunto de microsatélites pueden ser usados para pruebas de filiación. Conclusiones: a pesar de ser una población pequeña y cerrada, este núcleo presenta una alta variabilidad genética y baja consanguinidad.
Palabras clave: diversidad genética, estructura genética, ganado carne, marcadores microsatélites.
Resumo
O gado Senepol foi introduzido na Colômbia mediante o uso da inseminação artificial e a transferência de embriões de um núcleo pequeno de animais. Objetivo: estimar a variabilidade genética do gado Senepol da Colômbia mediante marcadores microsatélites e estimar as frequências alélicas e genotípicas dos SNPs dos genes de calpastatina (CAST1), calpaina (CALP316) e leptina (PB). Métodos: 412 amostras de sangue de animais pertencentes a 28 rebanhos foram analisadas para os STRs INRA32, BM2113, ETH10, BM1824, INRA037, ETH225, INRA064, SPS115, TGLA126 e TGLA122 e os três SNPs. Resultados: os microsatélites e os SNPs foram polimórficos. O número de alelos dos microsatélites variaram entre 4 (BM1824) e 11 (INRA37), a heterocigosidade observada variou entre 0,21 (INRA64) e 0,89 (BM2113). A probabilidade de exclusão para o total de microsatélites polimórficos foi maior que 99.99%, indicando que o conjunto de microsatélites podem ser usados para testes de filiação. Conclusões: embora seja uma população pequena e fechada, o núcleo apresenta uma alta variabilidade genética e baixa consanguinidade.
Palavras chave: diversidade genética, estrutura genética, gado de corte, marcadores microsatélites.
Introduction
The Senepol beef cattle breed was first developed in 1918 in St Croix, US Virgin Islands located in the central Caribbean region, by crossing Red Poll and N Dama cattle. The purpose of this crossbreed was to satisfy specific needs such as adaptation to tropical conditions and to meet meat quality and production objectives (Thrift et al., 1986). Only two Red Poll sires were used to start this crossbred (López, 2002). Senepol entered Colombia from Brazil, The Virgin Islands, and Venezuela, becoming dispersed throughout the territory by means of embryo transfer from a small number of donor cows as well as artificial insemination (Sánchez, 2010).
Due to the small group of sires and cows used for breeding, it is probable that inbreeding would be found in the population. The use of microsatellite markers (STRs) allows for the study of the genetic diversity and population structure as well as the estimation of inbreeding coefficients (Parker et al., 1998).
The STR markers are characterized by having a highly variable DNA sequence, which allows for establishing differences among individuals within and between populations (Parker et al., 1998; Aranguren Méndez et al., 2005; Bowling, 2001). They are also useful for genetic population studies, individual identification, genetic diversity analysis, marker–assisted selection, and detection of genes responsible for economically important characteristics, such as calpain, calpastatin, and leptin (Motter et al., 2009; Casas, 2006; Giblin et al., 2010).
A variety of studies report that the calpastatin protein is an endogenous inhibitor that plays an important role in regulating calpains. These studies, conducted in beef cattle, aimed to determine the physiological role played by calpastatin in tenderness in addition to the genetic implications of this gene (Killefer and Koohmaraie, 1994; Koohmaraie, 1994; Lonergan et al., 1995; Boehm et al., 1998). Calpastatin is found throughout the tissues where calpains are expressed, including skeletal muscle. Its expression is even higher than that of calpains (Emori et al., 1987).
Previous mapping and association studies (Smith et al., 2000; Motter et al., 2009; Parra–Bracamonte et al., 2007) have shown changes in meat tenderness in Bos taurus associated to a cistein–specific calcium–dependent protein within the photolytic system of calpains (ì–calpain–CAPN1) as the underlying mechanism of postmortem proteolysis in association with its calpastatin inhibitor (Koohmaraie, 1996; Page et al., 2004).
On the other hand, leptin regulates energy intake in mammals (Hossner, 1998; Geary et al., 2003). It is released from fat tissue and can also regulate appetite, energy balance, and body mass in animals (Houseknecht et al., 1998). Several studies have reported an association between leptin and carcass quality in cattle (Wegner et al., 2001; Geary et al., 2003; Giblin et al., 2010; Ruiz et al., 2009).
The aim of this study was to conduct a geneticcharacterization of Senepol cattle by usingmolecular STR markers and determine the allelic and genotypic frequencies for calpain, calpastatin,and leptin SNPs.
Materials and methods
Population sample
Blood samples (B) from 412 cows and sires from 28 herds (H) located in Antioquia (B=81, H=9), Atlántico (B=6, H=1), Boyacá (B=8, H=1), Casanare (B=22, H=2), C rdoba (B=114, H=2), Cundinamarca (B=85, H=6), Meta (B=59, H=3), Santander (B=16, H=1), Sucre (B=4, H=1), and Tolima (B=17, H=2) provinces were analyzed. The DNA isolation was conducted using a salting– out protocol (Miller et al., 1998) and preserved at –20 C in Buffer TE and pH 8.0 (Tris–EDTA). Procedures took place in the Animal Genetics Laboratory, University of Antioquia, Colombia.
Genotyping
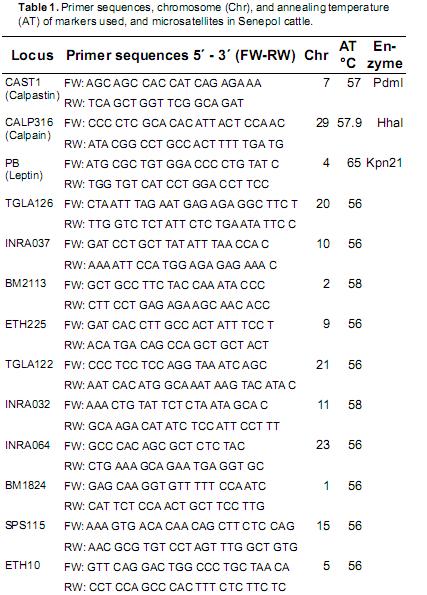
The INRA32, BM2113, ETH10, BM1824,INRA037, ETH225, INRA064, SPS115, TGLA126,and TGLA122 microsatellite markers were used in this study. They were taken from the InternationalSociety for Animal Genetic (ISAG) recommendedlist for studies on genetic variability (Table 1), andwere used applying multiplex systems (duplex ortriplex) according to each marker s amplificationconditions in 6% polyacrylamide gels followedby silver nitrate staining (Budowle et al., 1991).The SNP's products were separated and visualizedon 2% low–melting point agarose gels for calpainand calpastatin, while 3% low–melting pointagarose gels were used for leptin. All amplificationand restriction reactions were conducted in aThermocycler BioRAd C 1000®. The resultswere verified by sequencing at Macrogen® labs(Rockville, MD, USA).
Statistical analysis
The genetic diversity, mean number of alleles per locus (na), effective number of alleles per locus (ne), observed heterozygosity (Ho), expected heterozygosity (He), and Hardy–Weinberg equilibrium test (HWE) were estimated by the Popgene simulation program for population genetics (Yeh and Yang, 1999).
The percentage of polymorphic loci (Kallinowski et al., 2007), the polymorphic information content(PIC) for each marker (Botstein et al., 1980)and the non–exclusion parentage probabilities of first, second, and both parents (Ne–1p, Ne–2p, andNe–pp, respectively) by each microsatellite and bythe total were estimated using Cervus 3.0 software (Kallinowski et al., 2007). The population structurewas obtained with the RST index (Slatkin, 1995;modified by Goodman, 1997) assuming stepwisemutations –regarded as a more suitable index for microsatellites– and by using the Fstat software (Goudet, 2001). The above procedures were conducted to determine if these microsatellites are informative in studies to characterize populationgenetics and paternity testing.
Results
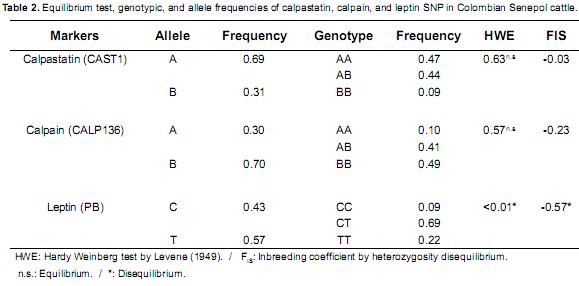
The SNP's favorable allelic and genotypicfrequencies were CAST1 (A=0.69 and AA=0.47),CALP316 (A= 0.30 and AA=0.10) and PB(T = 0.57 and TT = 0.23). Genotype AA was lowerthan heterozygote AB in the calpain gene. A higher frequency for the favorable genotypes AA and AB was observed for calpastatin gene. Leptin SNPshowed Hardy Weinberg disequilibrium and had thehighest heterozygote excess (Table 2).
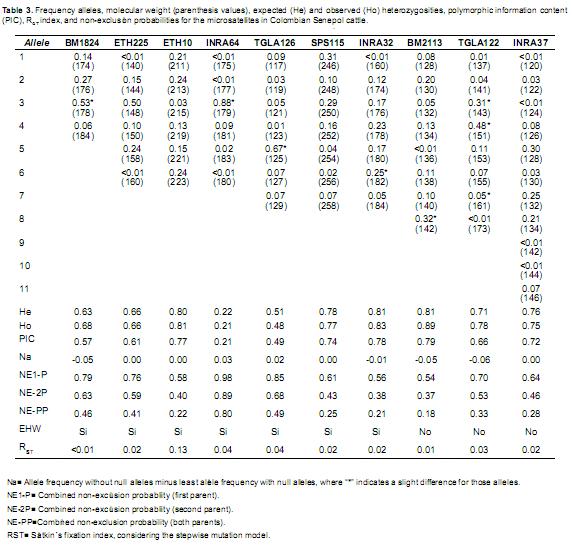
Regarding STR markers, the allele frequencies per locus, number of alleles, expected and observed heterozygosities (He and Ho, respectively), RST index, polymorphic information content (PIC), and non–exclusion pattern probabilities are presented in tables 3 and 4. The number of alleles varied between 4 and 11 (BM1824 and INRA37, respectively). The INRA64 and BM2113 STR showed the lowest and highest Ho (0.21 and 0.89, respectively). According to the Hardy Weinberg test results, seven microsatellites were in equilibrium (p>0.05), suggesting that these alleles are uniformly segregated in the studied population. Negligible differences were observed between allele frequencies, both with and without null alleles for nine microsatellites (–0.05 to 0.05), and a moderate to negligible difference (0.06) for TGLA122, which did not affect the analyses.
High He and Ho were observed (0.51 0.89) for nine microsatellites (except INRA64The polymorphic information content indexwere greater than 0.50 (0.57 to 0.79) for eigmicrosatellites (except for INRA64: 0.21 anTGLA126: 0.49). The RST indexes obtained were close to zero (<0.04) in nine microsatellites, whit reached 0.13 in ETH10, meaning that there ano differences between subpopulations (herdsThe RST index for the microsatellite sets was 0.0 (Table 4).
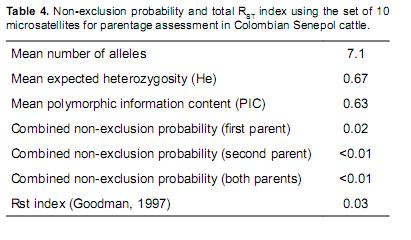
The probability for not excluding a false candidate parent of a tested offspring without genotype information of any true parent (NE–1P) varied between 0.54 (BM2113) and 0.98 (INRA64). The non–exclusion probability for one candidate parent, given the genotype of a known parent of the opposite sex (NE–2P), varied between 0.37 (BM2113) and 0.89 (INRA64), and the non– exclusion probability for both parents (NE–PP) varied between 0.18 (BM2113) and 0.80 (INRA64). The total non–exclusion probability for NE–1P, NE–2P, and NE–PP microsatellites was close to zero (Table 4). Therefore, a 98, 99, and 99% probability to exclude a first, second, and both false parents, respectively, could be expected by using the entire set of ten microsatellite loci.
Discussion
The heterozygote (CT) excess and the high frequency of the TT genotype for leptin in the analyzed population showed Hardy Weinberg deviations (p<0.05). The high frequency of the T allele is possibly due to selection procedures focused on reaching high body fat accretion. These results are similar to those from association studies conducted in Bos taurus, where carcasses from individuals having the T allele are fattier than animals with CC genotype (Buchanan et al., 2002, Kononoff et al., 2005).
The heterozygote's excess (CT) of the leptin gene offers the opportunity to design Senepol breeding programs using genotyped dams and sires intended for increasing the frequency of TT genotypes when the goals are selection for high feed efficiency and weight gain (Buchanan et al., 2002; Cer n–Muáoz et al., 2009; Giblin et al., 2010).
Calpain and calpastatin genes exhibited HW equilibrium (p>0.05) in the analyzed population, which indicates a possible lack of selection for meat tenderness. Nevertheless, the high frequency of animals carrying the favorable allele (A) for both genes could be useful for designing selection and breeding programs directed towards meat quality improvement (Lara et al., 2005; Chung et al., 2001) due to the fact that both enzymes are responsible for the meat tenderization process (Page et al., 2002; Delgado et al., 2001). The calpain gene in Charolais, Senepol, and Senepol x Charolais was associated with daily weight gain at 205 and 240 d, estimated live weight at 205 d, weaning age, trimming weight, individual muscle weight, and Warner Bratzler force (measured at 0 d post mortem), among other measurements (Bosques– Mendez, 2008).
Results from the microsatellite panel (Table 3) showed that Colombia s Senepol population has high genetic diversity. It is worth noticing that this basic panel (average He=0.67, Ho=0.69 and PIC=0.63) is informative and adequate for genetic population studies (Botstein et al., 1980; Bowcock et al., 1994).
The exclusion probability of the whole polymorphic microsatellite markers was higher than 98% (with NE–1P=0.02, N–2P<0.01, and N–PP <0.01), indicating the usefulness of this set of markers for parentage testing of Senepol breeds in Colombia.
The RST average for the ten microsatellites evaluated was 0.03 by the Goodman (1972) method, ndicating that 3% of the genetic variability could be due to genetic differences among herds, and to he fact that there is a high genetic flux between herds (genetic material exchange). The reason for his variability could be the high heterozygosis in he Colombian Senepol population, despite being conformed by a small nucleus and a small number of breeders.
Acknowledgements
This research was funded by the University of Antioquia (CODI menor–2009), the ColombianSenepol Cattle Breeders Association (Asosenepol)and by the Animal Genetics, Breeding, andModeling Research Group (GaMMA–UdeA).
References
1. Aranguren Méndez JA, Román Bravo R, Isea W, Villasmil YJordana J. Los microsatélites (STR's), marcadores moleculares de ADN por excelencia para programas de conservación: unarevisi n. Facultad de Ciencias Veterinarias, La Universidad de Zulia. Arch Latinoam Prod Anim 2005; 13:1–6. [ Links ]
2. Boehm ML, Kendall TL, Thompson VF, Goll DE. Changes in the Calpains and Calpastatin During Postmortem Storage of Bovine Muscle. J Anim Sci 1998; 76:2415–2434. [ Links ]
3. Bosques–Méndez JH. Segregación de polimorfismosidentificados en los genes de mu–calpaina y calpastatina y su relación con el crecimiento corporal y caracteristicas de la canalde bovinos para carne en Puerto Rico. University of Puerto Rico. Thesis. 2008. http://gradworks.umi.com/14/51/1451308.html [ Links ]
4. Botstein D, White RL. Construction of a genetic linkage map inman using restriction fragment length polymorphism. Am j hum genet 1980; 32:314–33. [ Links ]
5. Bowcock AM, Ruiz–Linares A, Tomfohrde J, Minch E, Kidd JR Cavalli–Sforza LL. High resolution of human evolutionary treeswith polymorphic microsatellites. Nature 1994; 368:455 457. [ Links ]
6. Bowling AT. Historical development and application of molecular genetic tests for horse identification and parentage control. Livest Prod Sci 2001; 72:11–116. [ Links ]
7. Buchanan FC, Fitzsimmons CJ, Van Kessel AG, Thue TD, Windkelman–Sim CD, Schmutz SM. Association of a missense mutation in the bovine leptin gene with carcass fat content and leptin mRNA levels. Genet Sel Evol 2002, 34:105–116. [ Links ]
8. Budowle B, Chakraborty R, Giusti AM, Eisenberg AJ, Allen RC. Analysis of the VNTR locus D1S80 by the PCR followed by high–resolution PAGE. Am J Hum Genet 1991; 48:137–144. [ Links ]
9. Casas E. Aplicación de la gen mica para identificar genes que influyen sobre caracter sticas econ micamente importantes en animales. Arch Latinoam Prod Anim 2006; 14:24–31. [ Links ]
10. Cerón–Muñoz MF, Montoya Atehortua AE, Trujillo Bravo E, Ramírez Toro EJ, Monsalve Fonnegra ZI. Marcadores del Gen Leptina en Bovinos Cruzados con Angus, Cebce, Romosinuano y Blanco Orejinegro. Rev Científica, FCV–LUZ 2009: 19: 371– 381. [ Links ]
11. Chung HY, Davis ME, Hines HC. Relationship of two PCR– RFLP in the bovine calpastatin gene with calpastatin activity, meat tenderness and carcass traits. Ohio Agricultural Research Development Center 2001; 181:7–34. [ Links ]
12. Delgado EF, Geesink GH, Marchello JA, Goll DE, Koohmaraie M. Properties of myofibril–bound calpain activity in longissimus muscle of callipyge and normal sheep. J Anim Sci 2001; 79:2097–2107. [ Links ]
13. Emori Y, Kawasaki H, Imajoh S, Imahori K Suzuki K. Endogenous inhibitor forcalcium–dependent cysteine protease contains four internal repeats that could be responsible for its multiple reactive sites. Proc Natl Acad Sci 1987; 84:3590–3594. [ Links ]
14. Geary TW, McFadin EL, MacNeil MD, Grings EE, Short RE, Funston RN, Keisler DH. Leptin as a predictor of carcass composition in beef cattle. J Anim Sci 2003, 81:1–8. [ Links ]
15. Giblin L, Butler ST, Kearney BM, Waters SM, Callanan MJ, Berry DP. Association of bovine leptin polymorphisms with energy output and energy storage traits in progeny tested Holstein–Friesian dairy cattle sires. BMC Genetics 2010, 11:73. [ Links ]
16. Goodman SJ. RST–calc: a collection of computer programs for calculating estimates of genetic differentiation from microsatellite data and determining their significance. Mol Ecol 1997, 6:881–887. [ Links ]
17. Goudet J. FSTAT: a program to estimate and test gene diversities and fixation indices (version 2.9.3). 2001, http:// www2.unil.ch/popgen/softwares/fstat.htm. [ Links ]
18. Hartl DL, Clark AG. Principles of population genetics. 2nd ed. Sinauer Associates, Sunderland, MA. 1989. [ Links ]
19. Hossner KL. Cellular, molecular and physiological aspects of leptin: Potential application in animal production. Can J Anim Sci 1998; 78:463–472. [ Links ]
20. Houseknecht KL, Baile CA, Matteri RL, Spurlock ME. The biology of leptin: a review. J Anim Sci 1998; 76:1405–1420. [ Links ]
21. ISAG/FAO. Secondary Guidelines for Development of National Farm Animal Genetic Resources Management Plans Measurement of Domestic Animal Diversity (MoDAD): Recommended Microsatellite Markers New Microsatellite marker sets Recommendations of joint ISAG/FAO Standing Committee. 2004 http://www.fao.org/ag/againfo/programmes/es/lead/toolbox/Indust/LossAgEA.htm [ Links ]
22. Jamieson A, Taylor C. Comparisons of three probability formulae for parentage exclusion. Anim Genet 1997; 28:397– 400. [ Links ]
23. Kalinowski ST, Taper ML , Marshall TC. Revising how the computer program CERVUS accommodates genotyping error increases success in paternity assignment. Mol Ecol 2007; 16:1099–1006. [ Links ]
24. Killefer J, Koohmaraie M. Bovine skeletal muscle calpastatin: cloning, sequence analysis, and steady–state mRNA expression. J Anim Sci 1994; 72:606–614. [ Links ]
25. Kononoff PJ, Deobald HM, Stewart EL, Laycock AD, Marquess FLS. The effect of a leptin single nucleotide polymorphism on quality grade, yield grade, and carcass weight of beef cattle. J Anim Sci 2005; 83:927–932. [ Links ]
26. Koohmaraie M. Muscle proteinases and meat aging. Meat Sci 1994; 36:93–104. [ Links ]
27. Koohmaraie M. Biochemical factors regulating the toughening and tenderization process of meat. Meat Sci 1996; 43:193–20. [ Links ]
28. Lara MAC, Nardon RF, Bufarah G, Demarchi JJAA, Sereno JR, Santos SA, Abreu UGP. Polimorfismo del Gen Calpa na en Razas Vacunas por la Técnica PCR–RFLP. Arch Zootec 2005; 54:305–310. [ Links ]
29. Levene H. On a matching problem in genetics. Ann Math Stat 1949; 20:91–94. [ Links ]
30. Lonergan SM, Ernst CW, Bishop MD, Calkins CR, Koohmaraie M. Relationship of restriction fragment length polymorphisms (RFLP) at the bovine calpastatin locus to calpastatin activity and meat tenderness. J Anim Sci 1995; 73:3608–3612. [ Links ]
31. López D. Senepo. Sitio Argentino de Producción Animal. 2002. http://www.produccionbovina.com/informacion_tecnica/raza_ senepol/01–senepol.pdf [ Links ]
32. Miller SA, Dykes DD, Poletsky HF. A simple salting out procedure for extracting DNA from human nucleated cells. Nucl Acid Res 1988; 16:1215. [ Links ]
33. Motter MM, Corva P., Krause M, Pérez C, Soria L. Rol de la Calpastatina en la variabilidad de la Terneza de la Carne Bovina. J Basic & Appl Genet 2009; 20:15–24. [ Links ]
34. Page BT, Casas E, Heaton MP, Cullen NG, Hyndman DL, Morris CA, Crawford AM, Wheeler TL, Koohmaraie M, Keele JW, Smith TP. Evaluation of single–nucleotide polymorphisms in CAPN1 for association with meat tenderness in cattle. J Anim Sci 2002; 80:3077–3085. [ Links ]
35. Page BT, Casas E, Quaas RL, Thallman RM, Wheeler TL, Shackelford SD, Koohmaraie M, White SN, Bennett GL, Keele JW, Dikeman ME, Smith TP. Association of markers in the bovine CAPN1 gene with meat tenderness in large crossbred populations that sample influential industry sires. J Anim Sci 2004; 82:3474–3481. [ Links ]
36. Parker PG, Snow AA, SCHUG MD, Booton GC, Fuerst PA. What molecules can tell us about populations: choosing and using a molecular marker. Ecology 1998; 79:361–382. [ Links ]
37. Parra–Bracamonte GM, Sifuentes–Rincón AM, Cienfuegos– Rivas EG, Tewolde–Medhin A, Martínez–González JC. Polimorfismo en el gen de la μ–calpaína en ganado Brahman de registro de México. Asociación Latinoamericana de Producción Animal 2007; 15: 32–37. [ Links ]
38. Ruíz B, Herrera JG, Rojas RI, Ru z H, Mendoza P, Oliva MA, Gutiérrez FA, Aguilar G, Bautiasta GU, Ibarra CE. Estimación de polimorfismos del gen de leptina de sementales en el sistema doble prop sito bovino, en villaflores, Chiapas México. REDVET 2009., 10:12. http://www.veterinaria.org/revistas/redvet/n121209.html [ Links ]
39. Sánchez R. Asosenepol, la alternativa para el tr pico bajo. 2010. Suganado.com URL:http://suganado.com/noticias_detalle. php?Id_Noticia=263 [ Links ]
40. Slatkin M. A measure of population subdivision based on microsatellite allele frequencies. Genetics 1995; 139:457–462. [ Links ]
41. Smith TP, Casas E, Rexroad CE, Kappes SM, Keele JW. Bovine CAPN1 maps to a region of BTA29 containing a quantitative trait locus for meat tenderness. J Anim Sci 2000; 78:2589–2594. [ Links ]
42. Thrift EA, Franke DE, Aaron DK. Preweaning breed–of–sire comparisons involving the senepol breed of cattle. J Anim Sci 1986; 62:1247–1254. [ Links ]
43. Wegner J, Huff P, Xie CP, Schneider F, Teuscher F, Mir PS, Mir Z, Kazala EC, Weselake RJ, Ender K. Relationship of plasma leptin concentration to intramuscular fat content in beef from crossbred Wagyu cattle. Can J Anim Sci 2001; 81:451–457. [ Links ]
44. Weir BS, Cockerham CC. Estimating F–Statistics for the Analysis of Population Structure. Evolution 1984; 38:1358– 1370. [ Links ]
Notas
¤ To cite this article: Sepúlveda JC, Ángel–Marín PA, Toro A, Corrales JD, Moreno MA, Cerón–Muñoz MF. Genetic variability of Senepol cattle in Colombia using molecular markers. Rev Colomb Cienc Pecu 2012; 25:183–190.

