Services on Demand
Journal
Article
Indicators
-
 Cited by SciELO
 -
 Access statistics
Related links
-
 Cited by Google
 -
 Similars in
SciELO
 -
 Similars in Google
Share
Revista Colombiana de Ciencias Pecuarias
Print version ISSN 0120-0690
Rev Colom Cienc Pecua vol.26 no.3 Medellín July/Sept. 2013
ORIGINAL ARTICLES
Estimation of genetic parameters for test-day milk yield in first calving buffaloes¤
Estimación de parámetros genéticos para producción de leche en el día de control en búfalas de primer parto
Estimação de parâmetros genéticos para produção do leite no dia do controle em búfalas de primeiro parto
Naudin A Hurtado-Lugo1,2, Zoot, PhD (c); Severino C de Sousa3, Zoot, PhD; Rúsbel R Aspilcueta1, Zoot, PhD; Swammy Y Gutiérrez2,Tec Pec, Est Zoot; Mario F Cerón-Muñoz2*, Zoot, PhD; Humberto Tonhati1, Zoot, PhD.
* Corresponding author: Mario Fernando Cerón Muñoz. Facultad de Ciencias Agrarias. Universidad de Antioquia. Carrera 75 No. 65-87. Ciudadela de Robledo. Medellín, Colombia. Tel (574) 2199140. E-mail: cerongamma@gmail.com
1 Universidade Estadual Paulista (UNESP), Faculdade de Ciências Agrárias e Veterinárias 14884900 Jaboticabal, São Paulo, Brasil.
2 Grupo de Genética, Mejoramiento y Modelación Animal (GaMMA), Facultad de Ciencias Agrarias, Universidad de Antioquia UdeA; Calle 70 No. 52-51, Medellín, Colombia.
3 Universidade Federal do Piauí (UFPI), Departamento de Zootecnia, Bom Jesus, Piauí, Brasil.
(Received: August 20, 2012; accepted: April 10, 2013)
Summary
Background: the milk yield records measured along lactation provide an example of repeated measures; the random regression models are an appealing approach to model repeated measures and to estimate genetic parameters. Objective: to estimate the genetic parameters by modeling the additive genetic and the residual variance for test-day milk yield in first calving buffaloes. Methods: 3,986 test-day data from 1,246 first lactations of crossbred buffalo daughters of 23 sires and 391 dams between 1997 and 2008 from five farms were used. The model included the genetic and permanent environment additive as the random effect and the contemporary group (year, month of test-day) and age at calving as covariable (linear) fixed effects. The fixed (third order) and random (third to ninth order) regressions were obtained by Legendre polynomials. The residual variances were modeled with a homogeneous structure and various heterogeneous classes. The variance components were estimated using the WOMBAT statistical program (Meyer, 2006). Results: according to the likelihood ratio test, the best model included four variance classes, considering Legendre polynomials of the fourth order for permanent environment and additive genetic effects. The heritabilities estimates were low, varying from 0.0 to 0.14. The estimates of genetic correlations were high and positive among PDC1 and PDC8, except for PCD9, which was negative. This indicates that for any of the selection criteria adopted, the indirect genetic gain is expected for all lactation curves, except for PCD9. Conclusion: heterogeneity of residual variances should be considered in models whose goal is to examine the alterations of variances according to day of lactation.
Key words: biomodeling, genetic correlations, Legendre polynomials, random regression models.
Resumen
Antecedentes: los registros de producción de leche medidos a lo largo de la lactancia son un ejemplo de medidas repetidas, los modelos de regresión aleatoria presentan un enfoque atractivo para modelar medidas repetidas y para estimar parámetros genéticos. Objetivo: estimar parámetros genéticos a través de la modelación de la varianza genética y residual para producción de leche en el día de control en búfalas de primer parto. Métodos: fueron analizados 3986 controles de producción de leche en la primera lactancia de 1246 búfalas, hijas de 391 hembras y 23 toros, durante los años 1997 hasta 2008 en 5 fincas. El modelo incluyó como efectos aleatorios genético aditivo y de ambiente permanente, como efectos fijos grupo contemporáneo compuesto por mes, año de control y la covariable de la edad de la búfala al parto (lineal). Las regresiones fijas (3er orden) y aleatorias (3er a 9no orden) fueron obtenidas mediante polinomios de Legendre. Las varianzas residuales fueron modeladas con una estructura homogénea y varias clases heterogéneas. Los componentes de varianza fueron estimados utilizando el programa WOMBAT. Resultados: de acuerdo con la prueba de la razón de verosimilitud, el mejor modelo fue con 4 clases de varianzas residuales, siendo considerado un polinomio de Legendre de cuarto orden para el efecto de ambiente permanente y genético aditivo. Las heredabilidades fueron bajas, variando desde 0,00 hasta 0,14. Las correlaciones genéticas fueron altas y positivas entre los PDC1 a PDC8, excepto en el PDC9 que fue negativo con respecto a los demás controles. Conclusiones: es necesario considerar la heterogeneidad de varianzas residuales en los modelos estudiados, con el fin de modelar los cambios en las variaciones respecto a los días en lactancia.
Palabras clave: biomodelación, correlación genética, modelos de regresión aleatoria, polinomios de Legendre
Resumo
Antecedentes: os registros da produção do leite medidos ao longo da lactação, apresentam um exemplo de medidas repetidas. Os modelos de regressão aleatória apresentam abordagem atraente para modelar medidas repetidas e estimar parâmetros genéticos. Objetivo: estimar parámetros genéticos mediante a modelação das variâncias genéticas e residual da produção do leite no dia do controle em búfalas de primeiro parto. Métodos: foram analisados 3986 controles de produção de leite em primeiras lactações de 1246 búfalas, filhas de 391 fêmeas e 23 touros, entre 1997 e 2008 em 5 fazendas. No modelo foram incluídos como efeitos aleatórios o genético aditivo e ambiente permanente, e como fixos o grupo contemporâneo (mês e ano de controle) e a covariável a idade da búfala ao parto (Lineal). As regressões fixas (3° ordem) e aleatórias (3° a 9° ordem) foram obtidas mediante polinômios ortogonais de Legendre. As variâncias residuais foram modeladas mediante estruturas homogêneas e diferentes classes heterogêneas. Os componentes de variância foram estimadas mediante o software WOMBAT. Resultados: de acordo com a prova da máxima verossimilhança, o melhor modelo foi com 4 classes de variâncias residuais, sendo considerado polinômios de Legendre de quarto ordem para o efeito de ambiente permanente e genético aditivo. As herdabilidades foram baixas, variando desde 0,00 até 0,14. As correlações genéticas foram altas e positivas entre o PDC1 e PDC8, a exceção do PDC9 que apresentou valores negativos com respeito aos outros controles. Conclusões:é necessário considerar heterogeneidade de variâncias nos modelos estudados, tentando modelar as mudanças nas variações respeito aos dias em lactação.
Palavras chave: biomodelagem, correlação genética, modelos de regressão aleatória, polinômios de Legendre.
Introduction
Random regression models (RRM) can be applied to test-day milk yield as an alternative to standard procedures used for the genetic evaluation of longitudinal traits in dairy cattle. According to Meyer (2006), RRM allow to fit random lactation curves for each individual expressed as deviations from the average lactation curve of the population or of groups of individuals. RRM allows the prediction of breeding values for the lactation curve as a whole; in other words, for any desired point on the curve (Kirkpatrick et al., 1990). Moreover, these models assume that the shape of the lactation curve is influenced by different random effects, such as genetic and permanent environmental effects. In addition, RRM consider the deviation of the lactation curve of animals in relation to the fixed curve for subclasses of effects to which it belongs (Araújo et al., 2007).
Studies on dairy cattle using RRM are based on orthogonal functions to model the (co)variance structure for random genetic effects and residual classes (Strabel and Misztal, 1999). Among these functions are orthogonal Legendre polynomials of different orders, which are used to analyze patterns of genetic variation and are influenced by environmental or management conditions across the curve. In general, the reliability of heritabilities obtained with RRM is greater than that obtained with finite dimensional models, indicating that RRM allow the detection of a greater genetic variability across lactation (Brotherstone et al., 2000; Pool et al., 2000). The goal of the present study was to estimate the genetic parameters by modeling the additive genetic and the residual variance for test-day milk yield in first calving buffaloes.
Materials and Methods
Location and animals
The information was collected in five farms located in the province of Cordoba. The province of Cordoba is located in Colombia's northeast, north of the western mountain range between the geographic coordinates 09°26'16''N to 07°22'05''N and 74°47'43''W to 76°30'01''W. Its climate is warm tropical, where the average annual rainfall ranges from 1300 mm in the coastal zone to approximately 3000 to 4000 mm in the upper area of the Sinu and San Jorge Rivers (Ballesteros et al., 2006); rainfall pattern is unimodal with a rainy season between May and November and a dry season from December to April (Corporación Autónoma Regional de los Valles del Sinú y San Jorge, 2005). Crossbred animals with high percentage of Brazilian and Bulgarian Murrah breeds were used. Animals grazed on native grass fields mixed with Brachiaria Spp grass and some forage legumes; females were milked once a day.
Study design
This study used 3986 test-day milk yield records (TDMY) from 1,246 females during their first lactation. These females were descendants of 23 sires and 391 dams born between 1997 and 2008. Buffalo cows younger than 22 months and older than 48 months at calving were removed from the study. TDMY was estimated between 5 and 270 days after calving and was divided into intervals of 30 days, corresponding to nine test-day records (TDMY1 to TDMY9) for first lactation cows. Only cows that had their first test-day record before 45 days after calving were considered in the analyses. TDMY was divided into nine classes (1 to 9) of days in lactation.
Statistical analysis
The characteristic of milk production was analyzed by means of single trait random regression models. All models included as random effect: the additive genetic, permanent environment and residuals effects of the animal; and as fixed effects: the contemporary group (year, month of test-day) and age at calving as covariable (linear). The fixed (third order) and random (third to ninth order) regressions were obtained by Legendre polynomials. The residual variances were modeled with a homogeneous structure and heterogeneous classes. The variance components were estimated using WOMBAT program (Meyer, 2006). In matrix form, the model can be represented by:
y = Xb + Za + Wp + e
Where:
y = vector of observations.
b = vector of fixed effects (CG, (co)variate age of dam at calving, and average curve of the population).
a = vector of solutions for additive genetic random regression coefficients.
ap = vector of solutions for permanent environmental random regression coefficients.
e = vector of different residual effects.
X, Z, W = incidence matrices for fixed and random additive genetic and permanent environmental effects, respectively.
The dimension of vector a consists of ka x Na coefficients, where:
ka corresponds to the order of the polynomial.
Na is the number of animals in the relationship matrix.
The dimension of vector ap consists of kap x Nd coefficients, where:
kap corresponds to the order of the polynomial and Nd is the number of animals with records.
For analysis, it was assumed that the records were distributed with mean Xβ. The following assumptions were made for additive genetic, permanent environmental and residual effects:

Where:
Ka and Kap are covariance matrices between additive genetic and permanent environmental random regression coefficients, respectively.
A is the relationship matrix between individuals.
INd is the identity matrix of dimension Nd.
 is the Kronecker product between matrices.
R is a block diagonal matrix containing residual variances. It was assumed that the residuals are independent.
The random additive genetic and permanent environmental effects were modeled using third- to sixth-order Legendre polynomials. A homogeneous (R) and a heterogenous (r) structure with nine classes (each month was considered to be a different class) were adopted for residual variances. In addition, heterogeneous variances with smaller classes were also considered, which were divided according to similarity between variances based on the nine residual classes. Thus, test-day records for milk yield were divided into four classes (1, 2 to 4, 5 to 8, and 9). The general RRM is given as LEGka.kap_R or LEGka.kap_r, where:
ka and kap correspond to the order of the covariance function for additive genetic and permanent environmental effects, respectively.
R or r is the structure of residual variances.
The covariance functions were estimated by the restricted maximum likelihood method using the WOMBAT statistical program (Meyer, 2006).
We assumed independence of the residuals. The citation of the RRM follows the pattern of LEGka.kap_r, referring to the order of the covariance function for the additive genetic effects (ka), permanent environmental effects (kap) and the residual variances structure (r). For example, the LEG4,6_4 model denotes an analysis fitting a fourth and sixth order Legendre polynomial for the additive genetic and the permanent environmental effects, respectively, and the residual variances modeled with a step function with four classes.
The different models were compared using the logarithm of the likelihood function (log L), the likelihood ratio test (LRT) at 1% probability, restricted maximum likelihood Akaike (AIC) and Schwarz Bayesian (BIC) information criteria, and examination of variances and correlations estimated for the traits. The information criteria can be described as: AIC = –2logL + 2p and BIC = –2logL + plog(N–r(X), where:
p is the number of parameters estimated.
N is the number of data.
r(X) is the rank of the incidence matrix of fixed effects in the model.
log L is the logarithm of the restricted maximum likelihood function (Wolfinger, 1993).
Results
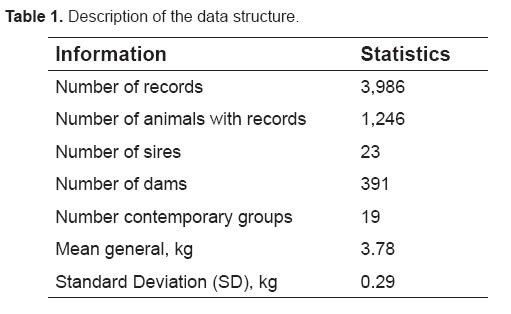
The phenotypic mean of TDMY was 3.78 ± 0.29 kg (Table 1). Milk production was 3.69 ± 0.09 kg at the beginning of the lactation curve and 4.01 ± 0.52 at peak lactation, declining thereafter to 2.25 ± 0.68 kg.
For the homogenous models (hom3,3_1), random additive genetic and permanent environmental effects were kept constant, assuming a homogenous residual variance structure (hom). For the heterogeneous models (het3,3_9, het3,3_4, het3,6_4, het4,4_4, het4,5_4, and het4,6_4), the random effects of residual variance were divided into four classes of heterogeneous variance (het).
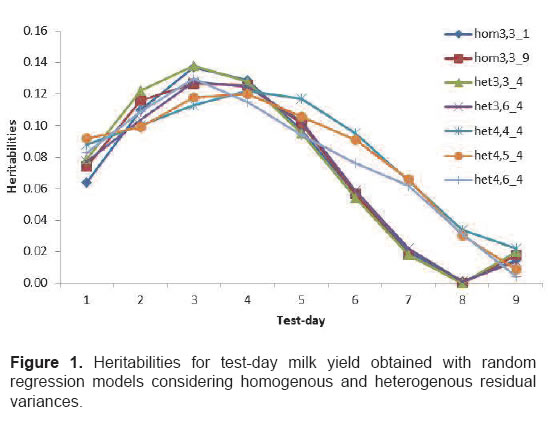
The heritabilities obtained by the models ranged from 0.00 to 0.14 (Figure 1). In general, the highest heritabilities were observed between TDMY2 and TDMY5 (0.09 to 0.14) and the lowest estimates on TDMY8 and TDMY9 (0.00 to 0.03). For all seven models tested, additive genetic, permanent environmental and phenotypic variances were greater at the beginning of lactation and lower at the conclusion, ranging from 0.38 kg2 to 0.04 kg2, from 1.65 kg2 to 0.20 kg2, and from 1.98 kg2 to 0.53 kg2, respectively. Residual variances were low (0.001 kg2) at the beginning of lactation and high (1.95 kg2) at the conclusion.
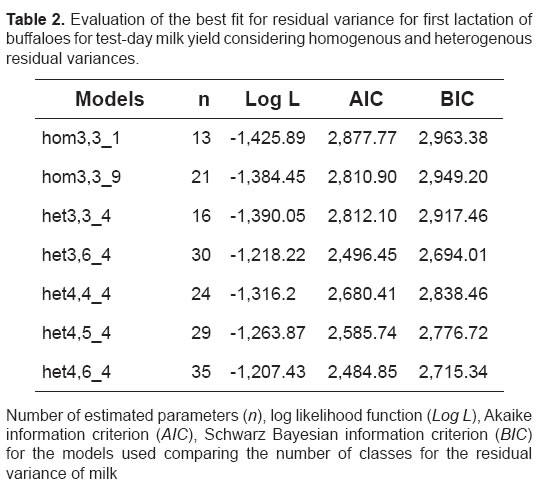
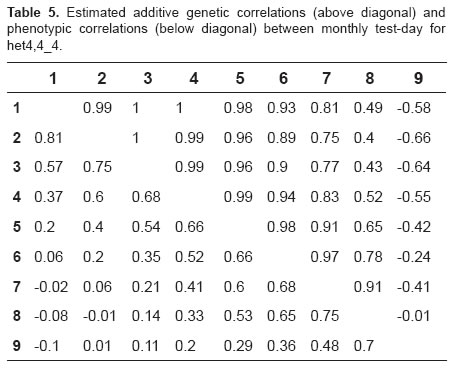
In general, the heterogeneous models presented lower log likelihood function (Log L), Akaike information criterion (AIC) and Schwarz Bayesian information criterion (BIC) values (Table 2). The BIC, which penalizes models with a larger number of parameters more rigorously, selected het3,6_4 and het4,4_4 as the best models for milk production. As a consequence, these models would be more adequate to describe the TDMY variation. Table 3 shows the eigenvalues associated with the matrix of random regression coefficients for additive genetic and permanent environmental effects obtained with the two best models (het3,6_4 and het4,4_4) for TDMY according to the BIC.
The models of lower order are sufficient to capture all the milk production variation, with a fourth coefficient for the additive part being associated with a zero eigenvalue, unlike the permanent environmental effect. For the two models, the fourth regression coefficient for additive genetic variance, but not for permanent environmental variance, was associated with an eigenvalue of zero. The first eigenvalue explained more than 70% of the variation in milk yield data. The variability in additive genetic and permanent environmental effects was primarily explained by the first eigenvalues (> 92%).
The genetic variances obtained with the selected models (het3,6_4 and het4,4_4) were greater at the beginning of lactation, with the highest values being observed on test days 3 and 1, respectively (Figure 2). The permanent environmental variances obtained with models het3,6_4 and het4,4_4 showed a similar trend, with values ranging from 1.20 kg2 to 0.49 kg2 and from 1.29 kg2 to 0.49 kg2, respectively. The phenotypic variances obtained with models het4,4_4 and het3,6_4 were greater at the beginning of lactation, with maximum values on test day 1 (1.37 kg2 and 1.45 kg2, respectively) (Figure 2). Conversely, residual variances ranged from 0.06 kg2 to 0.36 kg2 and from 0.03 kg2 to 0.48 kg2, respectively.
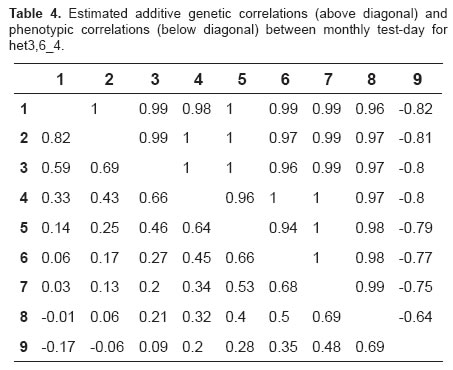
For the selected models, the correlations between regression coefficients for additive genetic effects ranged from -0.82 to 1.0 across lactation, with the observation of high and positive genetic correlations between consecutive test days (Tables 4 and 5), and low and positive correlations between more distant test days. For the two models, negative genetic correlations were observed between TDMY9 and the other test days, with high correlations (-0.82) at the beginning of lactation and low correlations (-0.01) at the end of lactation (Tables 4 and 5).
High and positive phenotypic correlations were observed between adjacent test days and low and negative correlations between more distant test days, ranging from -0.17 to 0.82 and from -0.10 to 0.81 for models het3,6_4 and het4,4_4, respectively (Tables 4 and 5).
Discussion
TDMY followed the typical shape of the lactation curve in dairy buffaloes (Araújo et al,. 2007; Hurtado-Lugo et al,. 2005). The models considering homogenous residual variances across lactation presented higher AIC and BIC values and consequent problems in the estimation of TDMY (Table 2). The results indicated that variances differ across lactation and residual variances therefore need to be modeled using heterogeneous variance structures (Table 2). Comparison of the models based on step functions showed that models including classes of residual variances provided better estimates than those considering homogeneity of variances. In addition, superparameterized models (n) were penalized rigorously by the BIC criterion when compared to the AIC criterion (Table 2). The difference in the estimates between models based on the AIC and BIC selection criteria might be related to the small number of test-day observations. In general, the heterogeneous models presented higher log L values (Table 2). In the study of Araújo et al. (2007), second order models were more efficient when the number of residual classes was high. However, fourth order polynomial models with four residual classes showed the highest log L value. In this investigation, models het3,6_4 and het4,4_4, presented the lowest log L, AIC and BIC values and were therefore the most efficient in describing the variation in milk production across the lactation curve.
According to Pool et al. (2000), the shape of the lactation curve can be modeled with sufficiently high precision using a third order Legendre polynomial for the additive genetic component and a fourth order polynomial for permanent environmental effects. On the other hand, Lopez- Romero and Carabaño (2003) suggested low order Legendre polynomials for additive and permanent environmental variances to be the most adequate to model milk production in first lactation cows. The eigenvalues obtained in the present study suggest that the dimension of random effects can be reduced without the loss of information, disagreeing with the log L and AIC values for additive genetic and permanent environmental effects and agreeing with the BIC value for additive genetic effects. However, according to Legarra et al. (2004), the reduction of the dimension of random effects as a result of eigenvalues close to zero is not indicated in all cases since the adoption of this criterion may lead to simplistic and inadequate models.
The heritability estimates obtained with the models tested ranged from 0.00 to 0.14. All models, except for those selected (het3,6_4 and het4,4_4), presented estimation problems at the end of the lactation curve (Figure 1). As a consequence of this fact, Meyer (2005) suggested that models using high order polynomials are more flexible and are able to model variances on a continuous scale. However, these polynomials tend to place greater emphasis on the extremes of the trajectory, causing estimation problems at these points.
Greater heritabilities at the beginning and at the end of lactation have been reported for dairy cattle (Brotherstone et al., 2000). The same trend at the beginning of lactation was observed in the present study. In contrast, heritabilities were lower at the end of the lactation curve. This finding might be due to the fact that buffalo farming is a recent activity in Colombia and that production data are limited due to the small number of animals and zootechnical records. Araújo et al. (2007), who studied milk production in buffaloes as a function of age using RRM with low order Legendre polynomials, estimated heritabilities of 0.08 to 0.40. These estimates are higher than those obtained in the present study.
The estimates obtained with model het4,4_4 presented higher AIC and BIC values than those obtained with model het3,6_4. However, the latter model included a larger number of parameters (n). Therefore, het4,4_4 was the best model. This model was selected based on the fact that less complex models (n) are easier to interpret from a biological standpoint. On the other hand, this fact indicates the need to include a larger number of zootechnical data from the herd. According to Meyer (2005), Legendre polynomials place greater emphasis on observations at the extremes of the lactation curve, generating estimation problems at these points. This fact may explain the difficulty in modeling TDMY since cows are affected by postpartum stress at the beginning of lactation, as well as by a negative energy balance. In addition, the number of production records is low at the end of lactation.
The phenotypic variances obtained with the two models showed a similar variation across lactation (Figure 2), with the observation of higher variances at the beginning of lactation and peak values on the first test day. Kettunen et al. (2000) reported higher phenotypic variances at the beginning and at the end of lactation for first lactating Holstein cows.
Using the models selected, the genetic correlations presented their greatest differences between TDMY6 and TDMY8 (Tables 4 and 5). The unexpected negative genetic correlations between TDMY9 and the other test days might be due to the lack of fit of polynomials at the end of lactation. In addition, the small number of zootechnical records from TDMY9 may cause estimation problems at these points.
Negative genetic correlations at the beginning and at the end of lactation have been reported for dairy cattle using RRM. These results might be explained by postpartum stress and the small number of records at the end of lactation (4,13). The genetic correlations obtained with model het3,6_4 differ from those reported by Araújo et al. (2007), suggesting that the genetic correlations between milk yields were close to unity in Murrah buffaloes.
The phenotypic correlations varied, with the observation of higher estimates between test days at the beginning of lactation and lower estimates between more distant test days. Similar results have been reported by Hurtado-Lugo et al. (2005), who used finite dimensional models and found higher phenotypic correlations between adjacent test days (0.64 to 0.84) and lower correlations between more distant test days (0.01 to 0.30). Kettunen et al. (2000) estimated phenotypic correlations of 0.20 to 0.74, with the highest estimates being observed between adjacent test days and the lowest correlations between test days at the beginning and at the end of lactation.
In conclusion, the present results demonstrate the need to consider heterogeneity of residual variances in the models tested in order to describe variations in days of lactation. The function with four residual variance classes was the best to model milk production across lactation. However, all model selection criteria used indicated het3,6_4 to be the best model (lowest AIC and BIC values), whereas model het4,4_4 was the most parsimonious because of its lower complexity at the time of biological interpretation.
Notas
¤ To cite this article: Hurtado-Lugo NA, De Sousa SC, Aspilcueta RR, Gutiérrez SY, Cerón-Muñoz MF, Tonhati H. Estimation of genetic parameters for test-day milk yield in first calving buffaloes. Rev Colomb Cienc Pecu 2013; 26:177-185.
Acknowledgements
This research was financially supported by the Colombian Ministry of Agriculture and Rural Development, Colombian Cattle Breeders Federation (FEDEGAN), Fundação de Apoio à Pesquisa do Estado de São Paulo (FAPESP-Process N º 2009/53773-1), the University of Antioquia, CODI/UdeA sustainability 2011-2012 and the Colombian Buffalo Breeders Association. Project title: ''Consolidation of the registration system in buffaloes and milk control, and Impact on production and improvement of Colombian herds''.
References
Araújo C, Ramos A, Araújo S, Chaves C, Schierholt A. Buffaloes milk yield analysis using random regression models. Ital J Anim Sci 2007; 6 Sup 2:279-282. [ Links ]
Ballesteros J, Fernández C, Dueñas R. Introducción a la Diversidad Faunística del Departamento de Córdoba. Informe técnico. Montería-Colombia: Universidad de Córdoba, Facultad de Ciencias Básicas e Ingenierías; 2006. [ Links ]
Brotherstone S, White IMS, Meyer K. Genetic modeling of daily yield using orthogonal polynomials and parametric curves. J Anim Sci 2000; 70:407-415. [ Links ]
Corporación Autónoma Regional de los Valles del Sinú y San Jorge-CVS, Recuperación de la vegetación relictual de áreas prioritarias de la zona de vida BS-T en el departamento de Córdoba. Bogotá, 2005. [ Links ]
Hurtado-Lugo N, Cerón-Muñoz M, Gutiérrez-Valencia A, Tonhati H, Henao A. Producción de leche en búfalas de la Costa Atlántica Colombiana. Liv Res Rur Dev 2005; 17 (139). [access date March 10, 2012] URL: http://www.lrrd.org/lrrd17/12/hurt17139.htm [ Links ]
Kettunen A, Mäntysaari E, Pösö J. Estimation of genetic parameters for daily milk yield of primiparous Ayrshire cows by random regression test-day models. Livest Prod Sci 2000; 66:251-261. [ Links ]
Kirkpatrick M, Lofsvold D, Bulmer M. Analysis of the inheritance, selection and evolution of growth trajectories. Genetics 1990; 124:979-993. [ Links ]
Legarra A, Misztal I, Bertrand JK. Constructing covariance functions for random regression models for growth in Gelbvieh beef cattle. J Anim Sci 2004; 82:1564-1571. [ Links ]
López-Romero P, Carabaño M. Comparing alternative random regression models to analyse first-lactation daily milk yield data in Holstein-Friesian cattle. Livest Prod Sci 2003; 82: 81-86. [ Links ]
Meyer K. Random regression analyses using B-splines to model growth of Australian Angus cattle. Genet Sel Evol 2005; 37:473-500. [ Links ]
Meyer K. ''WOMBAT'' - Digging deep for quantitative genetic analyses by restricted maximum likelihood. Proceedings of the 8th world congress on genetics applied to Livestock Production; 2006 Ago 13-18; Belo Horizonte. [ Links ]
Pool M, Janss L, Meuwissen T. Genetic Parameters of Legendre polynomials for first parity lactation curves. J Dairy Sci 2000; 83:2640-2649. [ Links ]
Strabel T, Misztal I. Genetic parameters for first and second lactation milk yields of Polish Black and White cattle with random regression test-day models. J Dairy Sci 1999; 82:2805- 2810. [ Links ]
Wolfinger R. Covariance structure selection in general mixed models. Commun Stat Simul Comput 1993; 22:1079–110 [ Links ]


