


Serviços Personalizados
Journal
Artigo
 Inglês (pdf)
 Artigo em XML
 Referências do artigo
 Enviar este artigo por email
Indicadores
-
 Citado por SciELO
 -
 Acessos
Links relacionados
-
 Citado por Google
 -
 Similares em
SciELO
Similares em
SciELO -
 Similares em Google
Compartilhar

 Permalink
Revista Colombiana de Ciencias Pecuarias
versão impressa ISSN 0120-0690
Rev Colom Cienc Pecua vol.26 no.4 Medellín out./dez. 2013
ORIGINAL ARTICLES
Using the distributed-delay model to predict egg production in laying hens¤
Uso del modelo de distribución con retardo para predecir la producción de huevos en gallinas ponedoras
Uso do modelo de distribuição com atraso para predizer a produção de ovos de galinhas poedeiras
Luis Galeano-Vasco1*, MSc; Mario Cerón-Muñoz1, PhD; Daniel Rodríguez2, MSc; José M Cotes3, PhD.
* Correspondig author: Luis Fernando Galeano-Vasco. Grupo de investigación en Genética, Mejoramiento y Modelación Animal (GaMMA), Facultad de Ciencias Agrarias, Universidad de Antioquia UdeA, Calle 70 No. 52-21, Medellín, Colombia. Email: lf.galeano.vasco@gmail.com
1Grupo de investigación en Genética, Mejoramiento y Modelación Animal (GaMMA), Facultad de Ciencias Agrarias, Universidad de Antioquia UdeA, Calle 70 No. 52-21, Medellín, Colombia.
2Universidad Militar Nueva Granada, Facultad de Ciencias Básicas, Carrera 11 # 101-80, Bogotá.
3Universidad Nacional de Colombia, Departamento de Ciencias Agropecuarias, Calle 59a # 63-20, Bloque 11, Oficina 101-7.
(Received: June 14, 2012; accepted: May 27, 2013)
Summary
Background: using mathematical models to characterize and estimate egg production curves is of great importance for assessing the productive efficiency of hens. These models can be used in identifying and modeling real-time factors affecting animal production and implementing corrective measures to minimize its effect. Objective: we compared the ability to model and adjust the egg production curve in hens using the distributed-Delay model versus the Adams-Bell and Lokhorst models. Methods: 225 records of weekly production of Hy Line Brown (62 data), Lohmann LSL (54 data), Isa Brown (54 data), and Lohmann Brown (55 data) were used. All analyzed flocks were raised at Hacienda La Montaña Farm, owned and managed by the University of Antioquia (Colombia). Models used were Adams-Bell, Lokhorst and Delay; all were validated and contrasted by Durbin-Watson statistic, MAD, determination (R2) and correlation (r) coefficients. Results: the Delay and Lokhorst models resulted in R2 values greater than 0.8 and r-values greater than 0.9 (p<0.01). For the Lohmann Brown curve, the Adams-Bell model had the lowest R2 value (0.81), while the Lokhorst and Delay models resulted in the highest R2 value for the Isa Brown curve (1.0). The Delay model fit the curve (28 and 40 for the k parameter; 63 and 64 for the DEL parameter). The Hy Line Brown curve presented a high number of irregularities, generating great difficulty for adjustment with the evaluated models. Conclusion: Delay and Lokhorst models are efficient for predicting egg production curve of the bird strains tested. Unlike the Adams-Bell and Lokhorst models, goodness of fit of the Delay model could be increased by including physiological relationships and supply/demand of resources as input variables, which would allow the model to fit the fluctuations observed in the production curves.
Key words: mathematical model, modeling, regression analysis.
Resumen
Antecedentes: los modelos matemáticos permiten caracterizar y estimar las curvas de producción de huevos, siendo de gran importancia para la evaluación de la eficiencia productiva de las gallinas, posibilitando identificar factores que afecten la producción animal y aplicar correctivos para minimizar su efecto. Objetivo: se comparó la capacidad para ajustar la curva de producción de huevos utilizando el modelo de distribución con retardo (Delay) y los modelos Adams-Bell y Lokhorst. Métodos: se utilizaron 225 datos de registros semanales de producción de cuatrolíneas: Hy Line Brown (62 datos), Lohmann LSL (54 datos), Isa Brown (54 datos), y Lohmann Brown (55 datos). Los lotes analizados pertenecieron a la Hacienda La Montaña, de la Universidad de Antioquia (Colombia). Los modelos fueron validados y contrastados con MAD, el coeficiente de determinación (R2) y de correlación (r), y el estadístico Durbin-Watson. Resultados: los modelos Delay y Lokhorst presentaron valores de R2 superiores a 0,8 y valores de r superiores a 0,9 (p<0,01). El modelo Adams-Bell para la curva Lohmann Brown obtuvo el menor valor de r (0,81), mientras que los modelos Delay y Lokhorst presentaron el valor más alto de R2 (1,0) para la curva de Isa Brown. El modelo Delay se ajustó a la curva, con valores de 28 y 40 para el parámetro k, y de 63 y 64 para el parámetro DEL. La curva de la línea Hy line Brown presentó gran cantidad de irregularidades (altibajos), generando mayor dificultad para ser ajustada con los modelos evaluados. Conclusión: los modelos Delay y Lokhorst son eficientes para predecir la curva de producción de huevos de aves de las estirpes probadas. La bondad de ajuste del modelo Delay podría aumentarse mediante la inclusión de otras variables de entrada tales como las relaciones fisiológicas, relaciones de oferta y demanda de recursos, y variables ambientales, posibilitando que el modelo Delay se ajuste a las fluctuaciones de las curvas.
Palabras clave: análisis de regresión, modelación, modelo matemático.
Resumo
Antecedentes: os modelos matemáticos para caracterizar e estimar curvas de produção de ovos são de grande importância para avaliar a eficiência produtiva de galinhas poedeiras. Estes possibilitam identificar os fatores que afetam a produção animal e aplicar os corretivos para minimizar seus efeitos. Objetivo: comparar a capacidade de ajustar a curva de produção de ovos utilizando o modelo de distribuição com atraso (Delay) e os modelos Adams-Bell e Lokhorst. Métodos: foram utilizados 225 dados de registros de produção semanal de quatro linhas de galinhas poedeiras: Hy Line Brown (62 dados), Lohmann LSL (54 dados), Isa Brown (54 dados) e Lohmann Brown (55 dados). Os lotes testados pertenceram à Fazenda La Montaña da Universidade de Antioquia (Colômbia). Os modelos foram validados e comparados com MAD, coeficiente de determinação (R2) e de correlação (r), e estatística de Durbin-Watson. Resultados: os modelos Delay e Lokhorst tiveram valores de R2 superiores a 0,8 e de r superiores a 0,9 (p<0,01). O modelo de Adams-Bell para a curva na linha Lohmann Brown teve o menor valor de r (0,81), enquanto os modelos Delay e Lokhorst apresentaram o maior valor de R2 (1,0) para a curva na linha Isa Brown. O modelo de atraso foi ajustado para a curva, com valores de 28 e 40 para o parâmetro k, e 63 e 64 para o parâmetro DEL. A curva da linha Hy line Brown apresentou muitas irregularidades (solavancos) gerando maior dificuldade para ser ajustada pelos modelos. Conclusão: os modelos Delay e Lokhorst são eficientes na previsão de curvas produção de ovos de aves das linhas testadas. A bondade de ajustar com o modelo de atraso pode ser melhorada com a inclusão de variáveis de entrada adicionais, tais como relações fisiológicas, relações de oferta, demanda de recursos e as variáveis ambientais. Permitindo que o modelo Delay ajuste as flutuações da curva.
Palavras chave: análise de regressão, modelação, modelo matemático.
Introduction
The onset of egg production is conditioned by several factors, including sexual maturity, weight, nutritional profile, and environmental conditions such as luminosity (Abad, 2003). The egg-laying curve begins at approximately 18 weeks of age, followed by peak production eight to nine weeks later, and subsequent persistence, defined as the number of weeks when production is constant post-peak. Next comes the declining phase, which extends until the exit of the batch (Grossman et al., 2000). Some of the factors influencing egg production are body weight (Álvarez and Hocking, 2007), environmental conditions (i.e., temperature and humidity) (Abiodun et al., 2006; Hester, 2005) especially thermoneutral or comfort zone for chickens (Rozenboim, 2007; Mashaly et al., 2004), bacterial diseases (Peebles et al., 2006), viral diseases (Sun et al., 2009), respiratory or intestinal problems (Yegani et al., 2008), and nutritional balance (Safaa et al., 2008; Jewers, 1990; Flores, 1994; Gerber, 2006).
The use of mathematical modeling in animal production has allowed farmers and researchers to describe and understand biological processes and prioritize the aims of production research from identifying the study's components to evaluating the response variable's effects.
This mathematical abstraction of biological events helps identify problems and generate solutions without incurring the costs of experimenting or animal manipulation, while decreasing the time to find solutions according to the production system. But the efficiency and accuracy of the simulation depends on the actual knowledge of the system's situations and quality of information incorporated into the model (Bindya, 2010; Spedding, 1988).
The purpose of modeling the production curve in poultry eggs is to achieve a more detailed analysis of the egg production cycle and describe the curve phases and duration (Fialho, 2001). The curve also facilitates the production prediction, the long-term projection of eggs yield, and economic planning of production and decision-making, among others (Yang et al., 1989; Groen et al., 1998; Gavora et al., 1982).
The egg production curve has been modeled using weekly production information (Miyoshi et al., 1996) and logistic functions (Adams and Bell, 1980; Cason and Britton, 1988), polynomial functions (Bell and Adams, 1992), exponential functions (Foster et al., 1987), segmented polynomials (Lokhorst, 1996; Narushin and Takama, 2003), and nonlinear models (Savegnago et al., 2011).
The Adams-Bell and Lokhorst models have been compared to other models, such as the compartmental or McMillan model (McMillan, 1981), based on a logistic growth curve and modified compartmental models, by several researchers (Narushin and Takama, 2003; Lokhorst, 1996; Cason and Britton, 1988). These studies have concluded that both models have the best fit and suggest that the Adams- Bell and Lokhorst models can be used for describing and predicting the egg production curve (Lokhorst, 1996; Narushin and Takama, 2003; McMillan, 1981; Cason and Britton, 1988).
The Delay model has been successfully used to simulate population dynamics in various living organisms (Gutierrez et al., 1984; Gutierrez et al., 1988a; Gutierrez et al., 1988b; Gutierrez et al., 1991; Wermelinger et al., 1992; D'Oultremont and Gutierrez, 2002). The Delay model, developed by Manetsch (1976) and modified by VanSickle (1977), could be used as an alternative model to predict egg production.
The Delay model can estimate the productive performance of a batch of birds by creating a population structure based on the number of individuals, age, or even changes in production, and by including therates of production decline (mortality) and increase (fecundity). Variations in production rates generate continuous entry and exit of individuals from each of the subsystem states. These variations are associated with the animal's physiological condition, changes in supply and demand of resources, and environmental factors. Therefore, the Delay model, structured by age, can be used to model egg production by considering eggs as the individuals in the system, and rate change in the number of eggs produced during a time period as the substates flow.
The aim of this study was to compare the Delay model with the Lokhorst (1996) and Adams-Bell (1980) mathematical models for their ability to model the egg production curve of Hy line Brown, Lohmann LSL, Isa Brown, and Lohmann Brownhen strains.
Materials and methods
Data
Weekly yield information, composed of 255 data (%), was used to fit the production curves. The weekly egg production rates (%) were calculated as the ratio between the number of eggs laid per week and the average number of hens per week. For comparing the capacity of model fit, four curves of egg production with different shapes such as age at start of egg production, increase rate of the curve, maximum number of eggs, length after the peak of production, and total weeks of production were selected. The strains selected were: Hy Line Brown (HB), Lohmann LSL (LSL), Isa Brown (IB), and Lohmann Brown (LB). All birds were raised in the University of Antioquia's (Colombia) Hacienda La Montaña Farm, located at 6°19'19''N and 1°37'40''W, at 2,350 m above sea level, with 15 °C average temperature (22 °C maximum and 7 °C minimum temperature).
During the production period hens were housed in cages, ensuring 750 cm2 per bird. Hens were fed according with the dietary recommendations of each line. Water was supplied ad libitum, and the environmental conditions (temperature and humidity) were not controlled.
Models
The Delay and the Adams-Bell (1980) and Lokhorst (1996) models were used for modeling the laying behavior of hens. According to Narushin (2003), Adams-Bell and Lokhorst can be used to accurately describe daily egg production.
According to Gutierrez (1996), the Delay model can be stated as:
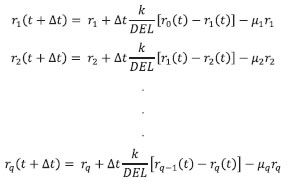
Where: r0 (t) is the number of eggs at the beginning of the production phase of the flock at time t. Now, rq (t) is the number of eggs produced at the end of the system at time t. The duration of each substate is Δt. Variables r1 (t), r2 (t), ... , rq (t) are termed ''intermediate production rates'' of the model, and refer to the increase in the number of eggs, according to the specific loss rate μi (t), with i= 1,2,3,.. ,q; where μi (t) takes values between 1< μi <1 for time t. Exchange rates between states are based on the number of laid eggs entering from the previous intermediate flow, and the ones laid towards the end that pass to the next state. The DEL value is defined as the optimum length of the egg production period estimated by the model. The k parameter was obtained from the Erlang frequency distribution (Van Sickle, 1977). The k and DEL values allow the model to more accurately replicate the properties of the process being modeled (Manetsch, 1976).
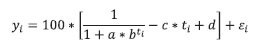
The Adams-Bell model is shown below (Adams and Bell, 1980):
The Lokhorst model is shown below (Lokhorst, 1996):
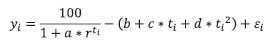
Where: yi is the production percentagefor the ith week. Parameters a and b allow the model to adjust for initiation of production. The time period between the start of production and the peak of the curve is influenced by the r parameter. The weekly post-peak production decline rate (%) is determined by the value of parameter c. The slope of the final decrease is given by factor d. Variable ti refers to the ith age of the flock (weeks), and εi is the residual effect associated with the ith time.
For both models (Adams-Bell and Lokhorst), production was expressed in percentage terms, calculated as the ratio between the number of eggs laid per week and the average number of hens per week. The percentage of eggs was multiplied by a theoretical population of 1000 hens in order to compare the Delay with the mathematical models.
Statistical analysis
The accuracy of the models was determined by:
1. Spearman correlation coefficient (r), which measures the strength of the linear relationship between each model's actual and estimated values. The r coefficient has values between -1 and 1, and values approaching zero show no relationship of dependence between variables. The correlation between actual and predicted number of eggs was performed using the CORR procedure (SAS Institute Inc., Cary, NC, USA) (2004).
2. Determination coefficient (R2), which describes how well a regression line fits a set of data. R2, in percentage values (0-100), is interpreted as the percentage change in the dependent variable due to changes in the independent variable, valuing the causal relationship between the two (explained and explanatory). To calculate the R2 coefficient for each model a linear regression analysis was performed, with the number of eggs predicted as the dependent variable and the number of eggs observed as the independent variable.
3. Mean Absolute Deviation (MAD), which measures average absolute deviation of forecast from actual values:
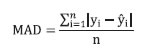
Where yi equals to the observed value at time i, ŷi equals the estimated value, and n equals the number of observations.
In addition, the Durbin-Watson statistic (DW) was calculated to assess for auto-correlation, using the following equation:
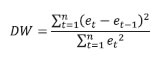
Where n is the number of observations, and et is the residual value for time t; while et-1 is the residual value for time t-1 (Durbin and Watson, 1951). The SAS 9.1 (SAS Institute Inc., 2004) and Microsoft Excel Solver® (Microsoft, 2010) was used for fit and compared the models.
Results
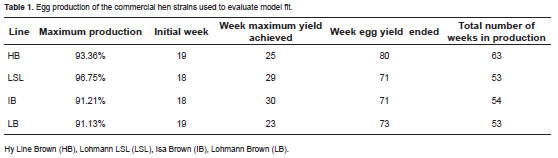
Egg production parameters of the commercial hen strains used to evaluate model fit appear in the table 1.
For the Delay model, parameter k value for HB was 28, while it was 40 for the other hen strains. Parameter DEL, which expresses the estimated mean duration of the productive period, was between 63 and 64 weeks. The decrease factor allows quantifying the extent to which productivity is steadily reduced after reaching the maximum weekly production, before the fast-decreasing phase starts (towards the end of the flock). The LSL had the highest decrease rate of productivity, with a daily proportion of 0.00737, which is roughly equivalent to 83 eggs/day/flock, followed by HB, whose rate was 0.004835, corresponding to 45 eggs/day/flock. The lowest rates occurred in LB and IB, corresponding to reductions of 39 and 31 eggs/day/flock, respectively (Table 2).
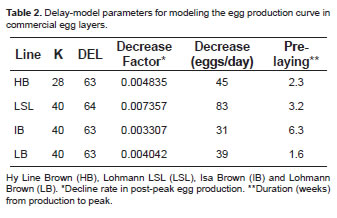
For each hen line, the initial phase of rapid increase in productivity was modeled considering some of the initial compartments of the model as a pre-laying period (Table 2). This period was shorter for LSL, followed by LB, and finally by the HB. The longest period was for IB. Thispre-laying value generated by the model coincides with the time periods between the week when production started and the week of peak production, presented in table 1 for each hen line.
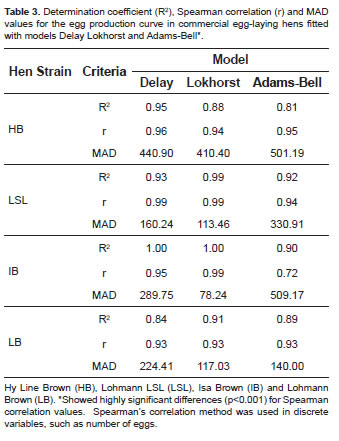
The values of all the coefficients of determination (R2) were greater than 0.8, and Spearman correlation (r) values exceed 0.9 in eleven of twelve results (Table 3). The Delay and Lokhorst models had correlation values above 0.9, allowing us to conclude that both are efficient to model all bird strains tested. Delay and Lokhorst models had the highest values of R2 and minimum values of MAD, except for Isa Brown strain, where the Delay model was exceeded by Lokhorst and Adams-Bell in both criteria.
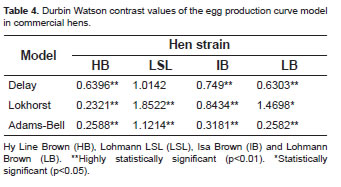
According to the Durbin Watson (DW) test results in table 4, all models showed positive autocorrelation of residuals with DW values below 2. The ideal DW value is 2 (Grossman, 2000). For the HB flock, the highest DW value was the Delay model (0.64), and for the LSL, IB and LB strains, the highest values of DW were for the Lokhorst model with values of 1.85, 0.84 and 1.47, respectively.
Discussion
All four flocks exceeded 90% production, an optimal response in commercial egg-laying hens. The production difference was related to the precocity of the LB flock, which reached full production before the other flocks. Another difference is associated with production length, which is determined by management decisions. Production cycle of LSL, IB, and LB lasted 53 weeks on average, while HB averaged 63 weeks (Table 1). Based on these indicators, it can be seen that production curves for the four commercial strains were different, allowing us to evaluate the ability of the models to fit the data.
Goodness of fit criteria indicated that the models provided a better fit to egg production data; R2 and r were higher, and MAD was lower, but DW was not always closest to 2.
The DW criteria results can be explained by the time-series data often exhibiting positive autocorrelation, noncompliant with the independence of errors assumption. Therefore a positive error (negative) tends to be followed by another error positive (negative), generating a cyclical pattern.
The calculation of the parameters of Delay model is performed by linear and nonlinear optimization algorithms, from the change in the values of the parameters DEL and k, with the objective function of minimize the sum of the differences between observed and estimated values (error) using Microsoft Solver tool developed for mathematical simulation, optimization, and modeling. For this reason, estimation of the Delay model does not need to check the variance of the disturbance term assumptions (autocorrelated data), which is a functional advantage compared to Lokhorst and Adams-Bell models.
Due to age differences at production onset, maximum number of eggs, and persistence in decay phase of egg production curves, the models showed different performances in each line of birds evaluated. To show this, first the Lokhorst, Adams- Bell, and Delay models were sorted according to R2 values within each hen strain. The models were sorted as follows: HB (Delay, Lokhorst, and Adams-Bell), IB and LSL (Lokhorst, Delay, and Adams-Bell), and LB (Lokhorst, Adams-Bell, and Delay). After averaging R2 and r-values of the four lines evaluated, Lokhorst ranked first (R2= 0.95, r = 0.96), followed by Delay (R2= 0.93, r =0.96) and finally Adams-Bell (R2= 0.88, r = 0.89). In both analyses, the Lokhorst and Delay models were ranked first or second; these results showed the Delay model performance was similar to Lokhorst in the production curve estimation process of the four lines evaluated, and evidence the effect of each curve on prediction ability of all models.
The prediction of models is shown in figure 1, where the Delay model yielded higher estimated values compared to the recorded data, especially during the post-peak production phase. This model underestimated the starting point of the curve for LB, whereby the MAD value for Delay model was higher than the other models. The model had its best performance in IB and HB curves, especially the best fit in the final production phase of HB line (weeks 49 to 63), compared with the other two models.
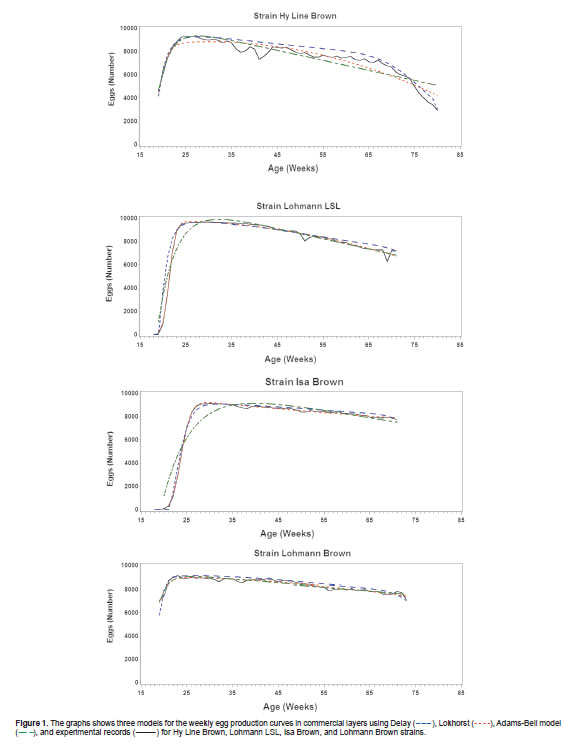
The Lokhorst model showed the best fit for LB and LSL curves, accurately describing the increase of the curve, the peak of production, and the downward trend near the end of the curve. However, the model underestimated peak production and failed to predict the irregularities in the HB production curve.
The Adams-Bell model had the best fit in LB strain. However, in the other three lines of hens this model failed to fit the start, the raising phase or peak of egg production curve, and thus achieved the highest MAD values. Regarding the fit flaws of Adams-Bell model, Lokhorst (1996) claims they are due to the assumption of 100% maximum production along with the linear decrease in egg production.
Despite the good overall performance of all models in estimating number of eggs per week, none of the models were able to reproduce the fluctuations between the maximum and the final production stages in HB strain due to the lack of accurate production fluctuation cause records.
In conclusion, based on the values of r, R2 and MAD, both Lokhorst and Delay model have similar prediction ability. This indicates there are several models that fit egg production curves of the four lines of birds evaluated.
On this basis, Delay and Lokhorst are the models recommended to adjust the egg production curve, although the first model has advantages, such as biological interpretation of the parameters, in that it does not require assumption validation for parameter estimates. Most important is the possibility of including other biological characteristic variables, such as environmental factors (temperature, relative humidity, etc.), or the relationship of supply/demand for resources in the system, allowing the model can estimate the fluctuations and variability in the egg production curve.
¤ To cite this article: Galeano-Vasco, L. Cerón-Muñoz M, Rodríguez D, Cotes JM. Using the distributed-delay model to predict egg production in laying hens. Rev Colomb Cienc Pecu 2013; 26:270-279.
Acknowledgments
The authors wish to thank Departamento de Formación Académica de Haciendas de la Universidad de Antioquia for data collection. This research was funded by Universidad de Antioquia (CODI Sostenibilidad 2013 Código E01727, and Mediana cuantía Código E01533) and Departamento Administrativo de Ciencia, Tecnología e Innovación (COLCIENCIAS) (Convocatoria Nacional para Estudios de Doctorados en Colombia año 2011).
References
Abad M. Reproducción e incubación en avicultura. Real Escuela de Avicultura. España; 2003. [ Links ]
Abiodun OE, Adedapo A. The effect of climate on poultry productivity in Ilorinkwara state, Nigeria. Int J Poult Sci 2006; 5:1061-1068. URL: http://www.pjbs.org/ijps/fin728.pdf [ Links ]
Adams CJ, Bell DD. Predicting poultry egg production. Poult Sci 1980; 59:937-938. [ Links ]
Álvarez R, Hocking PM. Stochastic model of egg production in broiler breeders. Poult Sci 2007; 86:1445-1452. [ Links ]
Bell DD, Adams CJ. First and second cycle egg production characteristics in commercial table egg flocks. Poult Sci 1992; 71:448-459. [ Links ]
Bindya LA, Murthy HNN, Jayashankar MR, Govindaiah MG. Mathematical models for egg production in an indian colored broiler dam line. Int J Poult Sci 2010; 9:916-919. [ Links ]
Cason JA, Britton WM. Education and production comparison of compartmental and Adams-Bell models of poultry egg production. Poult Sci 1988; 67:213-218. [ Links ]
D'oultremont T, Gutiérrez AP. A multitrophic model of a rice-fish agroecosystem II: Linking the flooded rice-fishpond systems. Ecol Model 2002; 155:159-176. [ Links ]
Durbin J, Watson GS. Testing for serial correlation in least squares regressions II. Biometrika 1951; 38:159-178. [ Links ]
Fialho FB, Ledur MC, Avila VS. Mathematical model to compare egg production curves. Rev Bras Cienc Avic 2001; [Accessed April 21, 2013] URL: http://www.scielo.br/scielo.php?script=sci_arttextpid=S1516-635X2001000300002lng=ennrm=iso. [ Links ]
Flores A. Programas de alimentación en avicultura: ponedoras comerciales. In: Documentos FEDNA - X curso de especialización FEDNA, Madrid, España 1994; [Accessed December 2012] URL: http://www.ucv.ve/fileadmin/user_upload/facultad_agronomia/Alimentaci%C3%B3n__Gallinas_Ponedoras.pdf. [ Links ]
Foster WH, Robertson DV, Belyavin CG. Fore-casting egg production in commercial flocks. Br Poult Sci 1987; 28:623- 630. [ Links ]
Gavora JS, Liljedahl LE, McMillan I, Ahlen K. Comparison of three mathematical models of egg production. Brit Poult Sci 1982; 23:339-348. [ Links ]
Gerber N. Factors affecting egg quality in the commercial laying hen: A review. Egg Producers Federation of New Zealand Inc. 2006; [Accessed December 10, 2012] URL: http://eggfarmers.org.nz/eggfarmers/wp-content/uploads/2012/04/factors_affecting_egg_quality.pdf [ Links ]
Groen AF, Jiang X, Emmerson DA, Vereijken A. A deterministic model for the economic evaluation of broiler production systems. Poult Sci 1998; 77:925-933. [ Links ]
Grossman M, Gossman TN, Koops WJ. A model for persistency of egg production. Poult Sci 2000; 79:1715-1724. [ Links ]
Gutiérrez AP, Dos Santos WJ, Pizzamiglio MA, Villacorta Am, Ellis CK, Fernandez CAP. Tutida I. Modelling the interaction of cotton and the cotton boll weevil. ii. Cotton boll weevil (Anthonomus grandis) in Brazil. J Appl Ecol 1991; 28:398-418. [ Links ]
Gutierrez AP, Pizzamiglio MA, Dos Santos WJ, Tennyson R, Villacorta AM. A general distributed delay time varying life table plant population model: Cotton (Gossypiumhirsutum) growth and development as an example. Ecol Model 1984; 26:231-249. [ Links ]
Gutierrez AP, Wermelinger B, Schultess F, Baumgärtner JU, Herren HR, Ellis CK, Yaninek JS. Analysis of biological control of cassava pests in Africa. I. Simulation of carbon, nitrogen and water dynamics in cassava. J Appl Ecol 1988a; 25:901-920. [ Links ]
Gutierrez AP, Yaninek JS, Wermelinger B, Herren HR, Ellis CK. Analysis of biological control of cassava pests in Africa. III. cassava green mite Mononychellustanajoa. J Appl Ecol 1988b; 25:941-950. [ Links ]
Gutierrez AP. Applied population ecology: A supply-demand approach. New York: John Wiley & Sons Inc.; 1996. [ Links ]
Hester PY. Impact of science and management on the welfare of egg laying strains of hens. Poult Sci 2005; 84:687-696. [ Links ]
Jewers K. Mycotoxins and their effect on poultry production. Options Mediterraneennes-L'aviculture en Méditerranee (N° 7) 1990; [Accessed December 10, 2012] URL: http://www.2ndchance.info/goutjewersmycotoxins.pdf [ Links ]
Lokhorst C. Mathematical curves for the description of input and output variables of the daily production process in aviary housing systems for laying hens. Poult Sci 1996; 75:838-848. [ Links ]
Manetsch TJ. Time-varying distributed delays and their use in aggregate models of large systems. IEEE transactions on systems, IEEE International Conference on Systems, Man, and Cybernetics. 1976; 6:547-553. [ Links ]
Mashaly MM, Hendricks GL, Kalama MA, Gehad AE, Abbas AO, Patterson PH. Effect of heat stress on production parameters and immune responses of commercial laying hens. Poult Sci 2004; 83:889-894. [ Links ]
McMillan I. Compartmental Model analysis of poultry egg production curves. Poult Sci 1981; 60:1549-1551. [ Links ]
Microsoft. Microsoft Excel Solver. Redmond, Washington, USA, 2010; [Accessed December 10, 2012] URL: http://office.microsoft.com/es-es/excel-help/solver-HP005198368.aspx [ Links ]
Miyoshi S, Luc KM, Kuchida K, Mitsumoto T. Application of non-linear models to egg production curves in chickens. Jpn Poult Sci 1996; 33:178-184. [ Links ]
Narushin VG, Takma C. Sigmoid model for the evaluation of growth and production curves in laying hens. Biosystems Engineering 2003; 84:343-348. [ Links ]
Peebles ED, Basenko EY, Branton SL, Whitmarsh SK, Maurice DV, Gerard PD. Effects of S6-strain Mycoplasma gallisepticum inoculation at ten, twenty-two, or forty-Five weeks of age on the egg yolk composition of commercial egg-laying hens. Poult Sci 2006; 85:1502-1508. [ Links ]
Rozenboim I, Tako E, Gal-Garber O, ProudmanJA, Uni Z. The effect of heat stress on ovarian function of laying hens. Poult Sci 2007; 86:1760-1765. [ Links ]
Safaa HM, Serrano MP, Valencia DG, Frikha M, Jiménez- Moreno E, Mateos GG. Productive performance and egg quality of brown egg-laying hens in the late phase of production as influenced by level and source of calcium in the diet. Poult Sci 2008; 87:2043-2051. [ Links ]
SAS Institute Inc. SAS/STAT User's Guide: Version 9.1.3. SAS Institute Inc., Cary, North Carolina, USA. 2004. [ Links ]
Savegnago R, Nunes BN, Caetano SL, Ferraudo AS, Schmidt GS, Ledur MC, Munari DP. Comparison of logistic and neural network models to fit to the egg production curve of White Leghorn hens. Poult Sci 2011; 90:705-711. [ Links ]
Spedding CRW. An introduction to agricultural systems. 2nd ed. London and New York: Elsevier App Sci Publisher; 1988. [ Links ]
Sun Q, Li W, She R, Wang D, Han D, Li R, Ding Y, Yue Z. Evidence for a role of mast cells in the mucosal injury induced by Newcastle disease virus. Poult Sci 2009; 88:554-561. [ Links ]
Van Sickle J. Attrition in distributed delay models. IEEE Tras Syst Manag Cybern. 1977; 7:635-638. [ Links ]
Wermelinger B, Candolfi MP, Baumgärtner J. A model of the european red mite (Acari:Tetranychidae) population dynamics and its linkage to grapevine growth and development. J Appl Entomol 1992; 114:155-166. [ Links ]
Yang N, Wu C, McMillan I. New mathematical model of poultry egg production, Poult Sci 1989; 68:476-481. [ Links ]
Yegani M, Korver DR. Factors affecting intestinal health in poultry: Review Poult Sci 2008; 87:2052-2063. [ Links ]
