


Services on Demand
Journal
Article
 English (pdf)
 Article in xml format
 Article references
 Send this article by e-mail
Indicators
-
 Cited by SciELO
 -
 Access statistics
Related links
-
 Cited by Google
 -
 Similars in
SciELO
Similars in
SciELO -
 Similars in Google
Share

 Permalink
Revista Colombiana de Ciencias Pecuarias
Print version ISSN 0120-0690
Rev Colom Cienc Pecua vol.28 no.1 Medellín Jan./Mar. 2015
ARTICLE
A simple methodology to measure ammonia flux generated in naturally ventilated poultry houses¤
Una metodología simple para medir el flujo de amoniaco generado en instalaciones avícolas sometidas a ventilación natural
Uma metodologia simples para quantificação do fluxo de amônia gerada em aviários submetidos à ventilação natural
Jairo Alexander Osorio Saraz1*, Ing, Msc, DS; Ilda de Fátima Ferreira Tinoco2, Ing, Msc, DS; Richard S Gates3, Ing (PE), Msc, PhD; Keller Sullivan Oliveira Rocha1, Ing, Msc, DS; Olga Lucía Zapata Marín2, Adm Gest Amb, Msc.
1Departamento de Ingeniería Agrícola y de Alimentos, Universidad Nacional de Colombia, Sede Medellín.
2Departamento de Engenharia Agrícola, Universidade Federal de Viçosa, Brasil.
3Department of Agricultural and Biological Engineering, University of Illinois, Urbana Champaign, USA.
*Corresponding author: Jairo Alexander Osorio Saraz. Departamento de Ingeniería Agrícola y de Alimentos, Facultad de Ciencias Agrarias, Universidad Nacional de Colombia, AA 565, Medellín. Email: aosorio@unal.edu.co
Received: April 8, 2013; accepted: March 30, 2014
Summary
Background: quantifying the rate of pollutant emissions, such as ammonia (NH3), from naturally ventilated animal production buildings in structures, such as those used in South America, is challenging mainly due to the challenge of determining building ventilation rate. Some methods have been developed to reduce this difficulty, but most are costly and complex, preventing their implementation.. Objective: the present work aimed to adapt and validate the Saraz method for the determination of ammonia emissions (SMDAE) from naturally ventilated poultry houses. Methods: to validate the proposed method, the ammonia emission rate (ER; NH3 mass emitted per unit time) was computed using the adjusted equation proposed by Wheeler et al.(2006; ER2). For evaluation purposes, the data obtained from the two measuring methods (SMDAE and ER2)were statistically analyzed. Results: the proposed method was considered adequate for use under conditions of natural ventilation with wind speeds greater than 0.1 m/s-1 and NH3 concentrations greater than 1 ppm. Conclusion: the method demonstrated a good correlation between its values and those obtained by the standard equation for calculating emissions based on NH3 concentration, air speed and temperature, which makes the Saraz method a reliable approach to develop ammonia inventories for naturally-ventilated poultry facilities.
Keywords: air pollution, gas, NH3 flux, poultry facilities, SMDAE method.
Resumen
Antecedentes: la cuantificación de la tasa de emision de contaminantes tales como el amoniaco (NH3) en instalaciones de producción animal con ventilación natural como las utilizadas en América del Sur es un reto, en parte debido a la dificultad para determinar la tasa de ventilación. Algunos métodos han sido desarrollados para reducir esta dificultad, pero la mayoría de ellos son costosos y complejos, lo que impide su aplicación. Objetivo: el presente trabajo tuvo como objetivo adaptar y validar el método Saraz para calcular el flujo de amoniaco (SMDAE) generado en galpones avícolas con ventilación natural. Métodos: para validar el método propuesto, el flujo de amoniaco (ER; masa de NH3 emitida por unidad de tiempo) fue comparado con los resultados obtenidos por medio de la ecuación ajustada propuesta por Wheeler et al. (2006; ER2). Para su evaluación, los valores obtenidos con los dos métodos (SMDAE y ER2) fueron comparados mediante análisis estadístico. Resultados: el método propuesto se considera adecuado para ser utilizado en las condiciones de ventilación natural con vientos superiores a 0,1 m/s-1 y concentraciones de NH3 superiores a 1 ppm. Conclusión: el método presentó una buena correlación entre los valores determinados y los obtenidos mediante la ecuación estandar para el cálculo de emisiones basada en la concentración de NH3, velocidad del aire y temperatura, lo que lo convierte en una alternativa confiable para hacer inventarios de amoníaco en instalaciones avícolas con ventilación natural.
Palabras clave: galpones avícolas, gas, método SMDAE, polución del aire, tasa de NH3.
Resumo
Antecedentes: a quantificação da taxa de emissão de poluentes, tais como a amônia (NH3) em instalações animais abertas e com ventilação natural, como são usadas na América do Sul, é um desafio, em parte devido a dificuldade de determinação da taxa de ventilação. Assim, alguns métodos têm sido desenvolvidos para reduzir esta dificuldade, mas a maioria deles são onerosos e complexos, inviabilizando a sua aplicação. Objetivo: o presente trabalho objetivou-se adaptar e validar o método Saraz para determinar o fluxo de NH3 (SMDAE) emitida dos galpões avícolas submetidos à ventilação natural. Métodos: para fazer a validação do método proposto, o fluxo de amônia (ER; massa de NH3 gerada por unidade de tempo) foi comparada com os resultados obtidos por meio de equação ajustada proposta por Wheeler et al. (2006; ER2). Para a avaliação proposta, os valores obtidos com os dois métodos usados (SMDAE e ER2) foram comparados mediante analise estadística. Resultados: o método proposto mostrou poder ser usado com confiabilidade em condições de ventilação natural com ventos maiores que 0,1 m/s-1 e concentrações de NH3 maiores que 1 ppm. Conclusão:o método apresentou uma boa correlação entre os valores encontrados pelo método proposto e aqueles obtidos na equação característica para o cálculo de emissões a qual é baseada no conhecimento da concentração de NH3, velocidade e temperatura do ar, o que torna o método como uma alternativa viável para fazer inventários de amônia em instalações aviárias com ventilação natural.
Palavras chave: fluxo de NH3, galpões avícolas, gás, método SMDAE, poluição atmosférica.
Introduction
It is very important to understand ammonia emission rate (ER) in poultry facilities not only because of ammonia's effect on the environment, but also because of the direct impact of gas concentration upon the health and productivity of both chickens and workers. The ER is approximately proportional to the product of gas concentration and building ventilation rate. This approximation is reasonable when minimal temperature differences and background NH3 concentrations exist between the interior and exterior; otherwise, a more comprehensive equation should be used, as suggested by Moody et al. (2008), which requires continuous monitoring. However, although the concept is quite simple, both concentration and ventilation rates are difficult to be accurately measured (Gates et al., 2005; Gates et al., 2008; Reidy et al., 2008). A comprehensive assessment of the measurement uncertainty for ER was provided from mechanically ventilated structures (Moody et al., 2008; Gates et al. 2008), from mechanical ventilation rate by Gates et al. (2004), and from both mechanically and naturally ventilated structures by Calvet et al. (2013). The latter analysis clearly demonstrated the substantial challenges of measuring naturally ventilated structures and urged further development in this field.
Wheeler et al. (2006) calculated ammonia ER as the mass of NH3 emitted by poultry houses per unit of time. Some methods have been developed to measure NH3 emissions in naturally ventilated facilities where manure is stored. The most commonly used methods are based on external and internal tracer gases, passive diffusion ''ferm tube'' portable monitoring unit (PMU), mobile air emissions monitoring unit (MAEMU), and model-based approach that uses mass balance (Demmers et al., 2000; Phillips et al., 2000; Demmers et al., 2001; Phillips et al., 2001; Scholtensa et al., 2004; Gates et al., 2005; Mosquera et al., 2005; Osorio et al., 2013).
One of the most important aspects of ammonia emissions testing is calculating the facility's interior ventilation rate. Determining this rate in naturally ventilated buildings can be very difficult due to the instability of this ventilation generated by differing air direction and velocities. In the case of Brazilian broiler houses, it is even more difficult to measure ventilation rates due to the strong, natural air currents countering the direction of the fans, thereby generating continuous variations flow rates (Xin et al., 2003).
Thus, the ammonia emissions assessment methods, including calculating tracer gases, monitoring continuously and using mass balances can be used with different levels of precision and accuracy (Calvet et al., 2013), and can be found in reports by Arogo et al. (2003), Blunden et al. (2008), Faulkner et al. (2008), and Osorio et al. (2009). However, it is difficult to apply these methods in conventional broiler houses located in tropical climates due to the non-uniformity of ammonia emissions caused by the behavior of ventilation openings that generate different air flows in each exhaust point of the building.
This study aimed to adapt and validate the Saraz method to calculate ammonia ER (Saraz method for determination of ammonia emissions-SMDAE). It is a simple and low cost method to determine the rate of ammonia flux in poultry houses subjected to natural ventilation conditions.
Materials and methods
This project was developed at the Department of Agricultural Engineering of Federal University of Viçosa in Brazil and implemented at a conventional commercial broiler house integrated with Pif (Paf Alimentos S.A. Company), located in Viçosa, Minas Gerais, Brazil (20°45'14'' S and 42°52'54'' W, elevation 703 m).
According to the Köppen classification, the region is a high altitude tropical climate (Cwb), with rainy summers and pleasant temperatures. This study was performed during the summer months, with 22 °C daily average temperature and relative humidity ranging between 50% and 70%.
Characteristics of the building
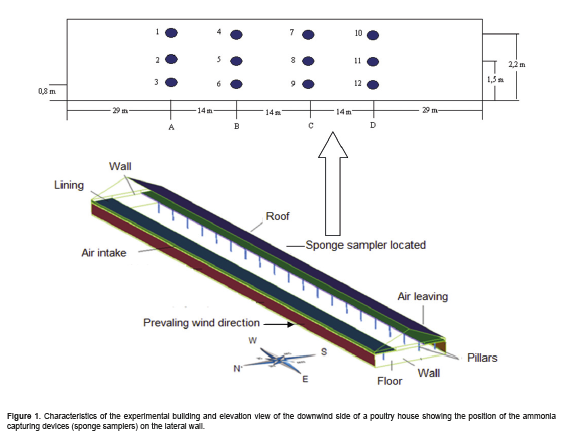
The commercial poultry house used in this experiment had the following dimensions: 100 m (length) x 13.5 m (width), 3 m (height), with a 0.50 m overhang and 20° roof slope (Figura 1.), and featured lateral air openings that remained open during the day and could be closed using curtains, if necessary. A total of 14,000 Cobb broiler chickens were housed at a density of 12 birds per m2.
The poultry house, with minimal thermal insulation typical in Brazil, was opened during the experimental period and relied completely on natural ventilation. The bedding was composed of fresh coffee hulls.
Quantification of ammonia flux using the Saraz method (SMDAE)
The operating principle of the SMDAE technique consists of establishing uniformly distributed sampling points, using polyurethane sponge samplers (20 cm in diameter and 2 cm thick) to form a homogeneous mesh organized at the lateral (sidewall) openings of the building in the opposite direction of the predominant wind (i.e., downwind side of building). At these equidistant sampling points, the sponges were positioned along the sidewall, near the air outlets on lines A, B, C, and D, at heights of 0.80, 1.50 and 2.20 m from the floor (Figura 1.). A total of 12 sampling points were used as depicted in Figura 1..
To capture volatilized ammonia leaving the building, each sponge was impregnated with 80 ml of a solution composed of sulfuric acid (1 mol/L) and glycerine (3%). Ammonia in the air was captured by diffusion into the sponge and quantified by acidbase titration using the Kjeldhal method (AOAC, 1970). To extract the NH3 captured in the sponge, an 80 mL solution of potassium chloride (KCl) with a concentration of 0.5 mol/L was added to 40 mL of water. This solution, mixed with the sponge, was prepared in a Tecnal model TE-0363 nitrogen distillation column. After distillation, the condensed sample was titrated with hydrochloric acid (HCl) at a concentration of 0.5 mol/L.
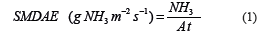
The NH3 concentration (g of NH3) captured in the sponge was obtained from the volume of the titrating solution (mL), solution concentration (mol/L), and number of NH3 moles (17). Then, the SMDAE ammonia flux was obtained using Equation 1.
Where:
SMDAE: ammonia flux (g NH3 m2/s).
NH3: NH3 mass of building output air (g NH3) as measured by average of all sponges.
A: area of the sponge at that location (m2).
t: exposure time of the sponge(s).
Validation of the method
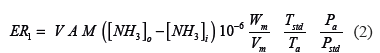
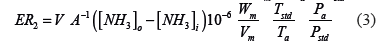
To validate the proposed method, the ammonia flux (NH3 mass emitted in the poultry house per unit time) was computed using the adjusted equation (Equation 3) reported by Wheeler et al. (2006; Equation 2).
Where:
ER1: emission rate (g NH3 h/bird).
ER2: ammonia flux (g NH3 m2/s).
V: air velocity inside the confinement and immediately outside the building at atmospheric temperature and pressure (m/s).
M: average body weight of the birds (kg/bird).
NH3i: NH3 concentration of air at the building inlet (ppm).
NH3e: NH3 concentration of air at the building exhaust (in this case near the internal lateral wall of the poultry house; ppm).
Wm: molar mass of NH3 (17.031 g/mole).
Vm: molar volume of NH3 at standard temperature (0 °C) and pressure (101.325 kPa), STP (0.022414 m3/ mol).
Tstd: standard temperature (273.15 K).
Ta: absolute temperature (K).
Pstd: standard barometric pressure (101.325 kPa).
Pa: atmospheric barometric pressure at the experimental site (kPa).
A: area of the sponge at that location (m2).
Appropriate time for ammonia capturing and gathering of experimental data
The ammonia flux was not evaluated during the first three weeks of life of birds because studies completed by Gates et al. (2005), Wheeler et al. (2006), and Gates et al. (2009) showed that ammonia emissions in the first 21 days are minimal, especially on new litter such as the one used in this study. According to the same authors, emissions increase linearly after this period.
Acquisition of experimental data
Air velocity (m/s) was measured with a digital wind gauge (Testo 425 Thermal Anemometer, Testo, Lenzkirch, Germany) with a 0 to 20 m/s range and ± 0.5 °C precision, positioned five centimeters upwind of each sponge. Air velocity data collection was performed in 20-minutes intervals. The airflow Q2 (m3/h) was computed as the product of air velocity and sponge area. The air direction was measured with a weather vane.
Air temperature was measured at the sampling height (DS1820, Dallas Semiconductor). Energy was provided to the 1-wireTM system by a parasitic feed derived from the data transmission conductor, where only two conductors are necessary. Temperature was measured every five minutes.
Background ammonia concentration data in the environment were obtained with an electrochemical detector (Gas alert, Extreme Ammonia Detector, Zefon International Inc, Ocala, FL, USA) measurements ranging from 0 to 100 ppm, temperature ranging from -4 to +40 °C, relative humidity ranging from 15% to 90%, with ± 2% accuracy (at 25 °C, between 5 and 95% RH). Measurements were performed at 20-minutes intervals.
Relative humidity of the poultry house interior and exterior air was obtained at diverse points throughout the entire poultry house, using 12 independent datalogger systems (Hobo H8-032) with accuracy ± 0.7, at 21 °C. Data collection was performed every second.
The atmospheric barometric pressure at the experimental site was obtained from a meteorological station located close to the experimental poultry house.
Statistical design
Three sponges were placed on the wall at each location and treated as subsamples. Data were collected during three consecutive days at three different weeks (4, 6, and 9 weeks of age), when they were between 22 to 28, 29 to 35, and 36 to 48 days old. Samples were collected twice per day, from 8:00 to 10:00 a.m and 2:00 to 4:00 p.m, yielding a total of 216 collected samples.
The ER calculated with Equation 3 was compared with the results obtained with the SMDAE method (Equation 1). A non-parametric, one-way analysis of variance (Kruskal-Wallis test) with method as treatment was conducted.
Further assessments were also made on the effects of morning vs. afternoon periods, wind direction and location of NH3 sponges on the wall. A one-way analysis of variance was applied for each assessment, with SMDAE as treatment.
Subsamples were collected once a day two days per week during three weeks (n = 72 per periods) per each of the 12 points in the lateral wall. A nonparametric, one-way analysis of variance (Kruskal- Wallis test) with period as treatment was conducted to compare the SMDAE results during the morning (a.m) and the afternoon (p.m).
The results obtained from SMDAE were compared according to wind direction at the lateral opening and were used as subsamples of n = 21 for each angle. A non-parametric, one-way analysis of variance (Kruskal-Wallis test), with angle as treatment, was conducted.
Three sponges per location were used during the morning (from 8:00 to 10:00 a.m) and the afternoon (from 2:00 to 4:00 p.m) to compare NH3 ER calculated by SMDAE according to sampler location on the lateral wall, being exposed for two days a week for three weeks (n = 18 per location and per period). A non-parametric, one-way analysis of variance (Kruskal-Wallis test) with location as treatment was conducted.
Results
It was previously observed that samplers absorb volatilized ammonia emitted in the building via lateral openings for more than eight hours since saturation did not occur (Osorio et al., 2013). This suggests that this type of sampler can probably be used continuously during an entire day for the determination of total ammonia flux during the period in which the confinement is opened.
Ammonia gas was captured for two hours in order to validate this methodology. The shorter sampling time was used to limit large variations in climatic factors, mainly wind speed and direction, thus allowing for validation of the method with mass flux data obtained from ER2.
A boxplot of SMDAE and ER2 measurements is shown in Figura 2.. No significant differences were found between the experimental data obtained by SMDAE and those obtained by ER2 (p = 0.219).
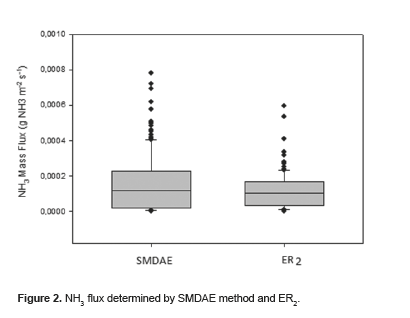
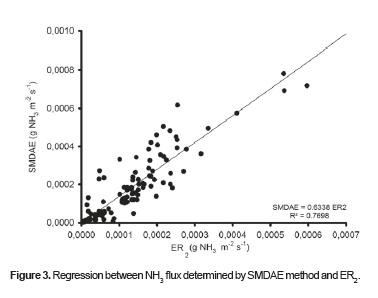
Figura 3. shows the regression of experimental ammonia flux data obtained by SMDAE and those obtained by ER2 at p<0.05 significance level. The SMDAE values underestimate ER2, as demonstrated in Figura 3.
A boxplot of ammonia flux values determined by SMDAE according to the time of day is shown in Figure 4. There were significant differences (p = 0.012) between NH3 flux determined by SMDAE method from 8:00 to 10:00 a.m when compared with the values obtained from 2:00 to 4:00 p.m, with higher rates in the morning compared with the afternoon.
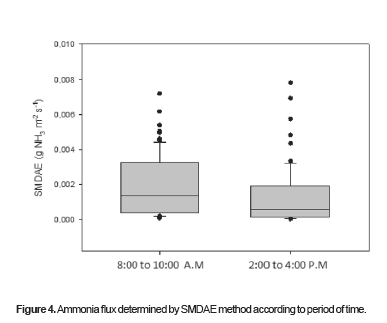
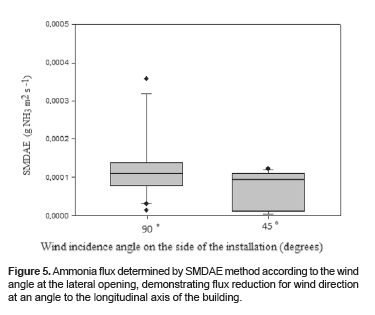
Figure 5 displays the range of ammonia flux values obtained by SMDAE according to the wind entrance angle measured on the lateral wall opposite to the wall where the sponge samplers were located. Two predominant wind directions were observed during the experimental period referred to the angle between the wind and the building wall plane, which were 90° and 45.
There was a significant difference between NH3 flux values determined by SMDAE method with winds at 90° and 45° (p<0.001). When the dominant wind was at 90° the ammonia flux values were higher than when winds were at 45°.
Figures 6 and 7 show the average ammonia flux obtained with SMDAE according to sampler location and time of day. No significant differences were observed among sampler locations between 8:00 to 10:00 a.m (p = 0.992) and 2:00 to 4:00 p.m (p = 0.733).
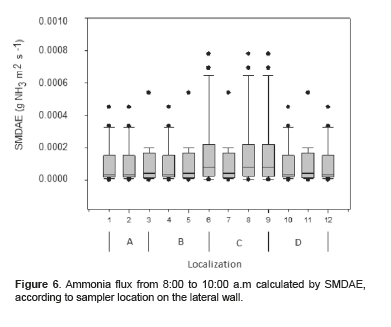
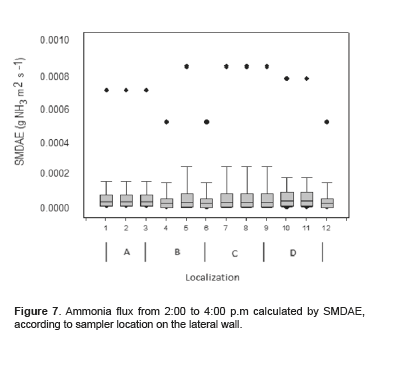
Figure 8 presents the typical ammonia flux distribution from 8:00 to 10:00 a.m and 2:00 to 4:00 p.m by SMDAE at the lateral wall where sampler sponges were located. Ammonia flux distribution is more uniform between 8:00 and 10:00 a.m than from 2:00 to 4:00 p.m.
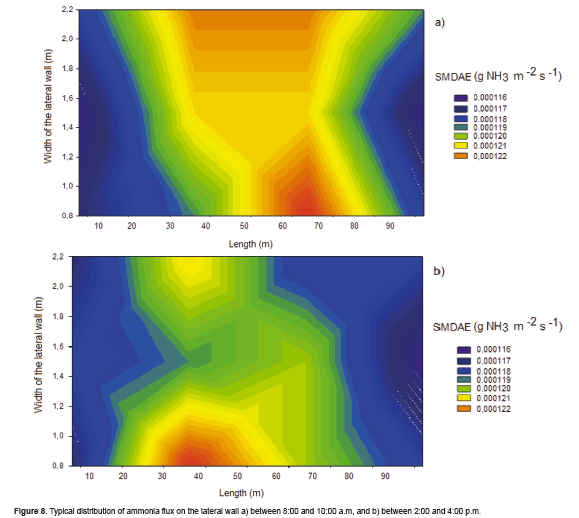
This can be explained by the fact that curtains are opened early in the morning and NH3 concentration and air velocity distribution are almost uniform in the whole area for the lateral wall. Air movement tends to stabilize in the afternoon when curtains have already been opened for hours, generating lower concentrations than those obtained in the morning.
Discussion
Figure 2 shows that data on NH3 ER obtained by SMDAE and those obtained by ER2 emitted from the lateral openings of the building were comparable with the ranges found by other researchers (from 10-7 to 10-4 g NH3 m2 s-1). The Ammonia Emission Factors (fNH3) estimated in this study (0.32 ± 0.08 g bird-1 day-1, with 12 birds/m2 stocking density) is comparable to those reported by Nicholson et al. (2004), Hayes and Curran (2006), Faulkner et al. (2008), Gates et al. (2008), Liu et al. (2009), and others.
Figure 3 shows that although SMDAE underestimated values obtained with ER2, the R2 coefficient was 0.77, which reveals a good correlation between ER2 and SMDAE. Therefore, SMDAE could be used under the conditions in which this experiment was performed, and the SMDAE values obtained can be adjusted with the equation in Figure 3 showing the correlation between SMDAE and ER2.
Figures 4 to 8 show the behavior of NH3 ER from naturally ventilated poultry houses during the morning and afternoon periods in function of variables such as wind direction. Facilities that are naturally ventilated for most of the day show different NH2 ER ranges at all times and at any point on the lateral wall, which means that gas inventories in these facilities must locate several sampling points, which would be too costly by using direct measuring methods such as passive diffusion ''ferm tube'', PMU, or MAEMU. By contrast, the SDMAE method utilizes low-cost sponges. The primary cost involved is the preparation and processing of sponges, similar in principle to the ferm tube method, although less expensive.
Thus, the use of SMDAE was deemed reasonable for use under conditions of natural ventilation with wind speeds higher than 0.1 m/s-1 and NH3 concentration higher than 1 ppm, which are the minimum values registered under these conditions. The SMDAE is a promising alternative for determining ammonia flux emitted by lateral openings of poultry houses submitted to natural ventilation, and it is cheaper compared to other methods.
Although SMDAE is less precise than other methods, such as continuous monitoring with external and internal tracer gases, it may be a viable and reliable alternative to do ammonia inventories in animal facilities due to its simplicity and low cost.
Acknowledgements
The authors wish to thank Universidad Nacional de Colombia for this great opportunity, Colciencias, Colombia, FAPEMIG Brazilian State Government Agency, the National Council of Technological and Scientific Development (CNPq, Brazil), CAPES Federal agency for their financial support, and also to Universidade Federal de Viçosa (UFV, Brazil).
Conflicts of interest
The authors declare they have no conflicts of interest with regard to the work presented in this report.
Notes
¤To cite this article: Osorio JA, Ferreira IF, Gates RS, Oliveira KS, Zapata OL. A simple methodology to measure ammonia flux generated in naturally ventilated poultry houses. Rev Colomb Cienc Pecu 2015; 28:3-12.
References
Arogo PW, Heber AJ. A review of ammonia emissions from confined animal feeding operations. ASAE 2003; 46:805-817. [ Links ]
Association of Official Analitical Chemists. Official methods of analysis. Association of Official Analytical Chemists. 11th ed. Washington: AOAC; 1970. [ Links ]
Blunden J, Viney PA, Phillip WW. Measurement and analysis of ammonia and hydrogen sulphide emissions from a mechanically ventilated swine confinement building in North Carolina. Atmos Environ 2008; 42:3315-3331. [ Links ]
Calvet S, Gates RS, Zhang G, Estelles F, Ogink NW, Pedersen S, Berckmans D. Measuring gas emissions from livestock buildings: a review on uncertainty analysis and error sources. Biosyst Eng 2013; 116:221-231. [ Links ]
Demmers TG, Burgess LR, Phillips VR, Clark JA, Wathes CM. Assessment of techniques for measuring the ventilation rate, using an experimental building section. J Agric Eng Res 2000; 76:71-81. [ Links ]
Demmers TG, Phillips VR, Short S, Burgess LR, Hoxey RP, Wathes CM. Structure and environment: validation of ventilation rate measurement methods and ammonia emission from naturally ventilated dairy and beef buildings in the United Kingdom. J Agric Eng Res 2001; 79:107-116. [ Links ]
Faulkner WB, Shaw BW. Review of ammonia emission factors for United States animal agriculture. Atmos Environ 2008; 42:6567-6574. [ Links ]
Gates RS, Casey KD, Wheeler EF, Xin H, Pescatore AJ. U.S broiler housing ammonia emissions inventory. Atmos Environ 2008; 42:3342-3350. [ Links ]
Gates RS, Casey KD, Xin H, Burns RT. Building emissions uncertainty estimates. ASABE 2009; 52:1345-1351. [ Links ]
Gates RS, Casey KD, Xin H, Wheeler EF, Simmons JD. Fan assessment numeration system (FANS) design and calibration specifications. ASAE 2004; 47:1709-1715. [ Links ]
Gates RS, Xin H, Casey KD, Liang Y, Wheeler EF. Method for measuring ammonia emissions from poultry houses. JAAR 2005; 14:622-634. [ Links ]
Hayes ET, Curran TP, Dodd A. Odour and ammonia emissions from intensive poultry units in Ireland. Bioresour Technol 2006; 97:933-939. [ Links ]
Liu Z, Wang DB, Beasley S, Shah B. Modeling ammonia emissions from broiler litter at laboratory scale. ASABE 2009; 52:1683-1694. [ Links ]
Moody LB, Li H, Burns RT, Xin H, Gates RS, Hoff SJ, Overhults DG. Southeastern broiler gaseous and particulate matter emissions monitoring quality assurance project plan. ASABE 2008; [access date: October 10, 2012] URL: http://asae.frymulti.com/ aqap_handbook.asp?confid=aqap [ Links ]
Mosquera J, Monteny GJ, Erisman JW. Overview and assessment of techniques to measure ammonia emissions from animal houses: the case of the Netherlands. Environ Pollut 2005; 135:381-388. [ Links ]
Nicholson FA, Chambers BJ, Walker W. Ammonia emissions from broiler litter and laying hen manure management systems. Biosyst Eng 2004; 89:175-185. [ Links ]
Osorio JA, Tinoco IFF, Ciro HJ. Ammonia: a review about concentration and emission models in livestock structures. Dyna 2009; 76:89-99. [ Links ]
Osorio JA, Tinoco FF, Gates RS, Oliveira MP, Mendes LB. Evaluation of different methods for determining ammonia emissions in poultry buildings and their applicability to open facilities. Dyna 2013; 178:51-60. [ Links ]
Phillips VR, Lee DS, Scholtens R, Garland JA, Sneath RW. A review of methods for measuring emission rates of ammonia from livestock buildings and slurry or manure stores. Part 1: assessment of basic approaches. J Agric Eng Res 2000; 77:355-364. [ Links ]
Phillips VR, Lee DS, Scholtens R, Garland JA, Sneath RW. A review of methods for measuring emission rates of ammonia from livestock buildings and slurry or manure stores. Part 2: assessment of techniques for measuring flux rates, concentrations and air flow rates. J Agric Eng Res 2001; 78:1-14. [ Links ]
Reidy B, Mmgen DA, Hler H, Eurichmenden B, Van Evert FK, Hutchings NJ, Luesink HH, Menzi H, Misselbrook TH, Monteny GJ, Webb J. Comparison of models used for national agricultural ammonia emission inventories in Europe: liquid manure syst. Atmos Environ 2008; 42:3452-3464. [ Links ]
Scholtensa R, Doreb CJ, Jonesb BMR, Leeb DS, Phillips VR. Measuring ammonia emission rates from livestock buildings and manure stores. Part 1: development and validation of external tracer ratio, internal tracer ratio and passive flux sampling methods. Atmos Environ 2004; 38:3003-3015. [ Links ]
Wheeler EF, Casey KD, Gates RS, Xin H, Zajaczkowski JL, Topper PA, Liang Y, Pescatore AJ. Ammonia emissions from twelve U.S.A. broiler chicken houses. ASABE 2006; 49:1495-1512. [ Links ]
Xin H, Tanaka A, Gates RS, Wheeler EF, Casey KD, Heber AJ, Ni JQ, Li H. Ammonia emissions from U.S. poultry houses. Part I: measurement system and techniques. ASAE 2003; [access date: October 20, 2012] URL: http://lib.dr.iastate.edu/ abe_eng_conf/132/ [ Links ]
