Introduction
Marker-assisted selection (MAS) is based on identifying the most reliable genetic markers to predict the increase of muscle mass in farm animals, as well as to use those markers to select the most productive individuals for breeding. Therefore, new candidate genes whose products function in the development of muscle fibers in sheep should be identified (Moradi et al., 2012; Miao and Luo, 2013).
The mRNA expression profile reflects the activity of the individual genes and characterizes the synthetic processes in muscles, which may differ between sheep breeds. Induction of high gene expression levels may indicate the significant impact of a particular gene on growth and development of muscle tissue in sheep, as previously shown by Hamill et al. (2012) in pigs.
Using the Affymetrix Bovine Expression Array technique, Fleming-Waddell et al. (2007) identified a particular gene expression profile in skeletal muscle of sheep carrying the callipyge mutation. Studies of gene expression profiles in sheep muscles by Lobo et al. (2012) revealed differential expression of MyoD1 and IGFBP4 genes associated with breed and productive qualities. In addition, Zhang et al. (2013) studied gene expression in two sheep breeds by RNA sequence analysis and revealed significant differences in more than 1,300 genes. Continued research has allowed these researchers to describe 34 genes with differential expression related to the development and differentiation of muscle cells (Zhang et al., 2014).
A number of sheep breeds are bred by local breeders in the Russian Federation. The “Dzhalginsky Merino” breed is well adapted to the dry conditions of the Stavropol Krai steppes. This breed is specialized in wool and meat production. Live weight of rams is 122.8± 2.91 Kg, dams are 55.6 ± 0.89 Kg, yearling rams are 79.5 ± 1.16 Kg, and ewes are 41.3 ± 0.71 Kg, which is significantly higher than the standard requirements for wool-breed sheep (Dunin et al., 2013).
To the best of our knowledge, studies on gene structure related to meat productivity and evaluation of muscle gene expression in Russian sheep breeds have not been carried out. In the present study, reverse transcription-quantitative real-time PCR (RT-qPCR) was used to evaluate gene transcription in the loin muscle of Dzhalginsky Merino sheep.
Materials and methods
Sample collection
The study was conducted in the Genetic Laboratory of Science-Diagnostic and Veterinary Care Center (Stavropol State Agrarian University, The Russian Federation). We used 17 one-year-old Dzhalginsky Merino rams from a livestock breeding farm located in Stavropol Krai (The Russian Federation). We selected 12 animals with maximum height and weight, and five animals from the same mRNA collection and cDNA preparation RNA was isolated from a 0.1 g sample using phenol-chloroform extraction with TRIzol Reagent (ThermoFisher, Waltham, MA, USA) following the manufacturer’s protocol. For normalization, RT-qPCR of all samples was performed with 25 ng/ml RNA.
Reverse transcription was performed with the Reverse Transcription Master Mix Kit (Fluidigm, South San-Francisco, CA, USA) using a set of preamplification PreAmp Master Mix and TaqMan Assays (Fluidigm, South San-Francisco, CA, USA). Amplification was carried out in a T100 Thermal Cycler (BioRad, Hercules, CA, USA).
Quantitation of cDNA in samples was performed with a fluorimeter Qubit 2.0 and reagents Qubit ds DNA HS Assay (Invitrogen, Waltham, MA, USA). A qualitative assessment of cDNA (value equal to 1.8) was performed with a NanoDrop spectrophotometer 2000C (ThermoScientific, Waltham, MA, USA) at A260/A280 wavelength.
Reverse-transcription quantitative real-time PCR (RT-qPCR)
Primers to 48 target genes were developed by Fluidigm company (Fluidigm, South San-Francisco, CA, USA). Real-time PCR was performed using a 96.96 Dynamic Array Gene Expression Integrated Fluidic Circuit (IFC) (Fluidigm, South San-Francisco, CA, USA). The preparation array was performed on the IFC Controller (Fluidigm, South San-Francisco, CA, USA) for real-time PCR and results were quantified using a Biomark™ HD System (Fluidigm, South San-Francisco, CA, USA) with negative controls in accordance with the manufacturer protocols and reagents. PCRs were carried out in duplicate samples.
The cycle threshold (C ) was taken into account if the population with a minimum height and weight to gather information about the maximum differential parameter was at Value of 0.65.of gene expression patterns. All animals were healthy and kept in optimal conditions with ad libitum feed. After slaughter, samples from the center of the loin muscle (1 x 1 x 1 cm) were transported (for 4 hours at 4 °C in a cooling box) to the laboratory, and RNA was immediately isolated.
Analysis of gene expression was performed using Real-Time PCR Analysis Software (Fluidigm, South San-Francisco, CA, USA). Efficiencies of real-time PCRs were calculated using BioMark™ analysis software (Fluidigm, South San-Francisco, CA, USA) in a 0.95-0.97 range.
Statistical analysis
The Student’s t-test in Excel for Windows statistical plugin was used. Significant differences were set at p<0.05.
Results
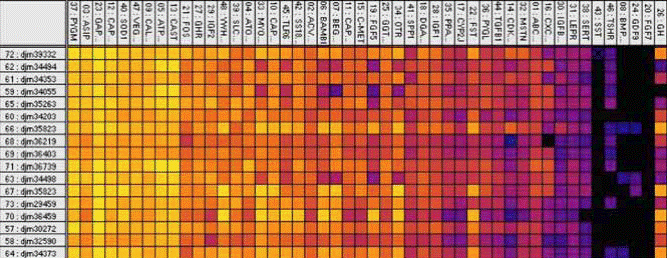
Results of RT-qPCR in the form of individual gene expression profiles are shown in Figure 1. The data showed that intensity of the same gene expressed in individual animals may be sufficiently. Candidate genes were divided into three groups based on digital analysis of gene expression levels in animals with high live weight: genes with high expression (Ct from 8 to 13), genes with an average expression level (Ct from 13 to 16), and those with low expression (Ct above than 16; Tables 1-3).
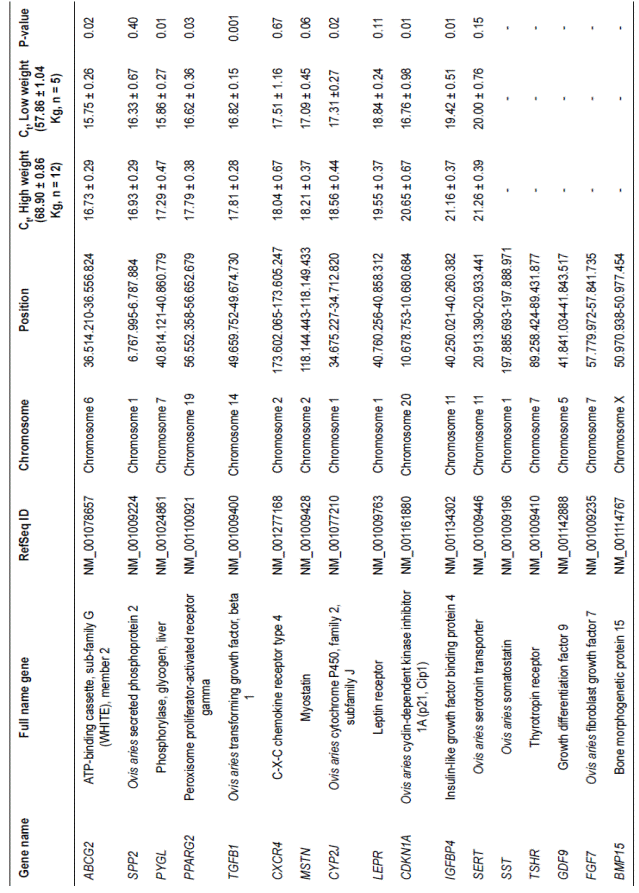
The SST, TSHR, GDF9, FGF7, and BMP15 genes showed the lowest trace levels of mRNAs (maximum values Ct>22 or absence of luminescence in probes), indicating that they were practically not transcribed. The LEPR, CDKN1A, IGFBP4, and SERT genes showed the lowest expression values, in which Ct was higher than 19. Two of these genes, IGFBP4Figure 1, highly expressed genes (located on the left side of the image) did not differ ignificantly between individuals. Genes with average expression levels (middle of the image) showed marked heterogeneity in transcription rates. Genes with low expression levels showed even more pronounced variation in mRNA expression levels between various animals (located on the right side of the image).
Animals were divided into two groups of high (12 individuals) and low (five individuals) weight to assess the expression relation of individual genes as integral indicators of meat productivity (as live weight). The average live weight with high reliability (p<0.001) differed between groups at 11.04 Kg (19.08%).
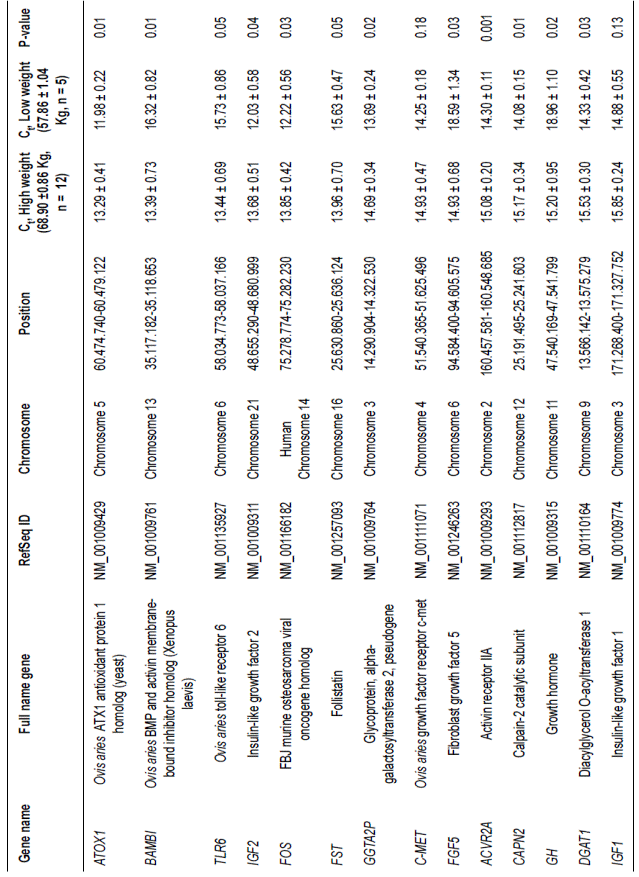
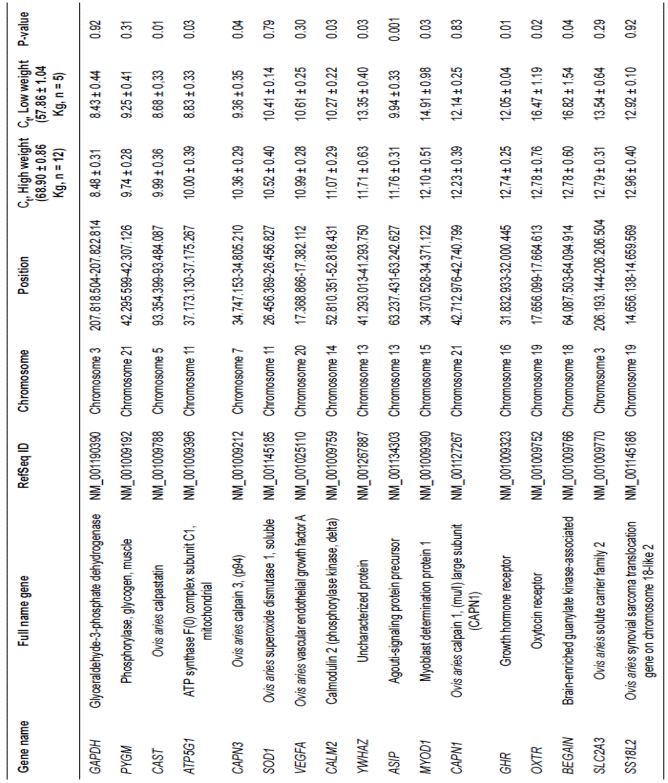
Candidate genes were divided into three groups based on digital analysis of gene expression levels in animals with high live weight: genes with high expression (Ct from 8 to 13), genes with an average expression level (Ct from 13 to 16), and those with low expression (Ct above than 16; Tables 1-3).
The SST, TSHR, GDF9, FGF7, and BMP15 genes showed the lowest trace levels of mRNAs (maximum values Ct>22 or absence of luminescence in probes), indicating that they were practically not transcribed.
The LEPR, CDKN1A, IGFBP4, and SERT genes showed the lowest expression values, in which Ct was higher than 19. Two of these genes, IGFBP4and SERT are on chromosome 11. Expression of the CDKN1A gene in animals with low live weights was significantly higher at 23.21% than in rams with high weights. The IGFBP4 gene showed a similar expression pattern in which the level of mRNA was greater at 8.95% in animals with low weights.
CYP2J gene expression was significantly higher at 7.20% in the low live weight group. A significant difference in expression levels was also found for ABCG2, PYGL, PPARG2, and TGFB1 genes. All of these genes were more intensely transcribed in animals with low live weights; the differences in expression levels of ABCG2, PYGL, PPARG2, and TGFB1 were 6.21, 9.03, 7.04, and 5.88%, respectively.

Figure 1 Individual expression profiles of 17 rams (Dzhalginsky Merino breed). Lighter cells indicate higher expression. In columns (genes); in rows (individual rams).
Table 1 Lowly expressed genes in loin muscle of Dzhalginsky Merino sheep in different live weight parameters (M ± m, Ct - cycle threshold).

Table 2 Medium expressed genes in loin muscle of Dzhalginsky Merino sheep in different live weight parameters (M ± m, Ct - cycle threshold).

Table 3 Highly expressed genes in loin muscle of Dzhalginsky Merino in different live weight parameters (M ± m, Ct - cycle threshold).

The MSTN gene showed relatively low expression levels that were directly related to the regulation of the intensity of muscle fiber growth, while there was not a significant difference in the amount of mRNA between groups. In addition, the expression of genes with low amounts of mRNA did not show a significant difference, including SPP2, CXCR4, LEPR, and SERT, in rams with different weights.
Only two of the genes with average mRNA expression levels, C-MET and IGF1, did not show significant differences in their expression intensities between ram groups. The ATOX1, IGF2, FOS, GGTA2P, ACVR2A, CAPN2, and DGAT1 genes
were transcribed with greater intensities in animals with low weight. The significant differences in gene expression intensity between animals with high and low weights for ATOX1, IGF2, and FOS were 10.93, 13.7, and 13.32%, respectively. There were also significant differences in gene expression levels (albeit lower values) between the high and low live weight groups for genes GGTA2P (7.28%), ACVR2A (5.43%), CAPN2 (7.68%), and DGAT1 (8.41%).
Expression levels of BAMBI, TLR6, FST, FGF5, and GH for the average transcription intensity group were significantly higher in animals with high live weight. Differences in expression between the two groups for BAMBI, TLR6, FST, and FGF5 were 17.99, 14.55, 10.66, and 19.70%. The GH gene showed the highest difference in expression among genes, with 19.84% average expression intensity.
For the group of genes with the highest expression indexes, the number of genes with a transcription intensity that did not correlate with live weight (GAPDH, PYGM, SOD1, VEGFA, CAPN1, SLC2A3, and SS18L2)
was almost equal to the number of genes showing reliable differences between groups of animals.
Among genes with the highest transcription indexes, several genes including CAST, ATP5G1, CAPN3, CALM2, ASIP, and GHR showed significantly higher expression levels in animals with low live weight. The difference in the expression intensity was the highest for CAST (15.09%), ATP5G1 (13.21%) and ASIP (18.23%). The remaining genes CAPN3, CALM2, and GHR showed 10.70, 7.78, and 5.74% expression level differences, respectively.
The YWHAZ, MYOD1, OXTR, and BEGAIN genes in animals with high live weights showed a significant increase in expression levels. The significant differences in expression intensity for YWHAZ, MYOD1, and OXTR were 12.30, 18.81, and 22.38%. The BEGAIN gene showed the greatest difference in expression levels of all the studied genes. Its expression in animals with high live weight was 24.01% higher than that of the low weight group.
Discussion
This study showed heterogeneity in gene expression patterns in the loin muscle of Dzhalginsky Merino sheep. This heterogeneity reflected gene expression differences of multiple genes within one individual and of one gene in different examined animals. It should be noted that the focus of this investigation was to use differential gene expression patterns indicating involvement of a particular gene in muscle fiber growth regulation, without determining the underlying mechanisms. Furthermore, sequence analysis of candidate genes will reveal new molecular markers for genomic sheep breeding.
The main task of the study was to evaluate gene expression in loin muscle, to define a number of parameters that characterize sheep meat quality. We hypothesized that genes with high expression levels have the greatest impact on growth and structure of muscle fibers.
Weakly expressed genes may have a different effect on myocytes. For example, the low expression of genes encoding enzymes involved in energy metabolism may be rate limiting to muscle fiber development. At the same time, low expression of regulatory genes or genes encoding different hormones and growth factors may be enough to indicate major impact on muscle size and structure, thus, reflecting meat quality (Braun and Gautel, 2011).
We also based our choice of candidate genes on known data from farm animal studies about their impact on meat quality (Kogelman et al., 2011). Relevant information of the impact on muscle growth in humans and laboratory animals from studies of genes in various pathologies and muscular aging processes was also considered (Braun and Gautel, 2011; Garatachea and Lucía, 2013).
A large number of the candidate genes in this study encoded growth factors, activins, chemokines and their receptors, including MSTN, VEGFA, TGFB1, FGF5, IGFBP4, FGF7, GDF9, IGF1, IGF2, MYOD1, C-MET, BMP15, PPARG2, BAMBI, CAPN1, CAPN2, CAPN3, CAST, ASIP, CXCR4, CDKN1A. In addition, we investigated the expression of a number of genes encoding hormones and their receptors, including FST, TLR6, ACVR2A, GH, GHR, SST, TSHR, SERT,OXTR, CALM2, and LEPR. To evaluate the effect of genes on energy metabolism and the transport of substances, we investigated the expression of PYGL, SPP2, CYP2J, ATOX1, GGTA2P, DGAT1, ABCG2, BEGAIN, SLC2A3, GAPDH, PYGM, ATP5G1, and SOD1.
Mutations in several of the investigated genes, such as FOS, YWHAZ, and SS18L2, have been associated with the growth and development of muscles in a number of pathological processes in humans and animals. This suggests that they may be useful candidate genes to assess meat quality.
There are several methods to study gene expression, including sequencing cDNAs obtained by reverse transcription (Wang et al., 2014; Zhang et al., 2014), estimating the number of cDNAs by hybridization on biochips (Lobo et al., 2012), and reverse transcription-quantitative real-time PCR (Sun et al., 2014). The latter method is the most accurate and is used to validate the results obtained with microarray hybridization (Lobo et al., 2012). Therefore, we used reverse transcription-quantitative real-time PCR on a 96.96 Dynamic Array Gene Expression system (Fluidigm, USA). This reaction was run at the same time for all the samples we studied, minimizing the impact of variability in terms of PCR standardization.
During the study of gene expression, we have assumed that the maximum intensity of transcriptional performance will be in genes encoding proteins involved in energy metabolism and transport systems, as previously established by Zhu et al. (2015), while investigating the variability of gene expression encoding the enzyme glyceraldehyde-3- phosphate dehydrogenase (GAPDH) in the musculus longissimus dorsi of goats. Our results are consistent with those of Zhu et al. (2015) as GAPDH showed the maximum expression levels in our study.
The PYGM gene, encoding a muscle glycogen phosphorylase, showed expression levels similar to those of GAPDH in loin muscle. In addition, the mRNA expression levels of calpain 3 (CAPN3) and calpastatin (CAST), which encode regulatory proteins of muscle fibers, were two units less than that of the GAPDH Ct value. Since they belong to the gene regulatory peptides group, we expected lower rates of expression intensities, however, the results were consistent and confirm the importance of the calpain- calpastatin system in the development of muscle fibers in sheep, as shown in several previous studies (Azari et al., 2012; Ranjbari et al., 2012).
In general, the group of genes with high expression is paramount in the identification of molecular markers of sheep meat productivity. The magnitude of individual gene expression variation within a muscle may be associated with the presence of allelic variants of genes that have different functional activities. Therefore, future studies should focus on the structure of the ATP5G1 gene, which encodes the ATP synthase enzyme with a key role in energy metabolism. The level of mRNA expression of ATP5G1 is identical to that of CAST, which is a proven indicator of meat sheep productivity.
Gene expression analysis in muscle tissue of sheep (Jeanplong et al., 2015) revealed higher expression levels of MSTN than those of IGF1. However, our data showed higher IGF1 mRNA levels than those of MSTN. These differences may be explained by the breed characteristic of the animals or the fact that the authors used the semitendinosus muscle tissue for analysis instead of loin muscle. Nevertheless, the expression of these genes should be continued in other breeds of sheep to gather an overall indication of their use in predicting meat quality.
The expression of the majority of the investigated genes correlated with the live weights of the animal. This is supportive evidence of the involvement of a selected list of genes in the productive qualities of the Dzhalginsky Merino breed. Moreover, at this stage of the investigation, it is not important to increase or decrease the expression of a gene in the group of animals with greater weights. In any case, it is necessary to characterize the structural features of these genes to select new genetic markers of meat productivity.
The growth hormone (GH) gene is of interest in these studies. Despite the fact that the main products of growth hormone in animals under the age of one year takes place in the anterior pituitary, our data of extrapituitary production of growth hormone does not contradict the results of other researchers. The presence of growth hormone gene expression in muscle has already been demonstrated in a number of animals (Moria and Devlinb, 1999), and we have confirmed it in sheep. In the group of genes with average expression intensity, GH showed the greatest difference in the magnitude of expression between the different weight groups of animals, which indicates a greater probability of its use as a marker of high meat quality in sheep. In addition, it is worth noting the inverse relationship between the levels of GH gene expression and that of the gene encoding its receptor GHR. This may be due to a compensatory increase in the synthesis of hormone receptor at a lower production of the hormone itself.
Very low trace expression of genes SST, TSHR, GDF9, FGF7, and BMP15 are identified in the loin muscle of sheep. However, they should not be excluded from the list of gene candidates affecting sheep meat quality. It is possible that they may have a remote action after being produced in other tissues. In addition, growth differentiation factor 9 (GDF9) belongs to the same group as myostatin (MSTN, GDF8), which together with somatostatin (SST) have a direct and proven impact on the growth and development of muscle tissue in mammals.
Analysis of the expression of 48 genes in the loin muscle of Dzhalginsky Merino rams has allowed the initial genetic characterization of this breed. The results are relevant to understanding the key regulatory processes of muscle growth and performance of enzyme systems in the energy metabolism. The results showed some differences in gene expression levels in rams with different live weights. These data reveal general genetic aspects of the development of muscle fibers of sheep and of all mammals. The muscle expression of several genes has been studied for the first time, and the results will be used in future work on the genetic analysis of animals and humans. The main result is the justification of the need for additional investigations on the molecular nature of the investigated genes and to identify mutations associated with superior meat quality of sheep and other animals.


