Introduction
Guilan sheep is a fat-tailed breed in Iran, numbering some 400,000 animals in the north of the country, and distributed in the northern and western parts of Guilan Province in the mountains between Assalem, Khalkhal, Oshkourat, and Deilaman. This breed can also be found in some areas of the Guilan- Zanjan border. Mean adult live weight in this breed is 35 Kg (77 lbs) for rams and 31 Kg (67 lbs) for ewes. The coat is yellowish-white to pure white, with brown patches on the head, face, and the bottom of the legs. This breed is valued mainly due to its ability to live in mountainous areas with rain-fed foothills and foothill steppes with 1300 mm (51 inches) annual rainfall. Young ewes are randomly exposed to the rams for the first time at approximately 1.5 years of age. Ewes are kept in the flock up to 7 years of age. Ewes are supplemented, depending upon requirements, for a few days after lambing. Rams are kept until a male offspring is available for replacement. During the breeding season, single-sire pens are used allocating 20-25 ewes per ram. Lambs remain with their dam until weaning. Lambs are ear-tagged and weighted immediately after lambing. During the suckling period, lambs are fed dry alfalfa after three weeks of age. Lambs are weaned at approximately 90 days of age. Animals are kept on natural pasture during spring, summer and autumn. Since environmental conditions are adverse, the animals are kept indoors during the winter months. The flock is mainly kept on pasture and fed cereal pasture, with supplemental feed, including alfalfa and wheat straw, provided especially around the mating season (Eteqadi et al., 2014).
Growth is defined as increase in live weight or dimension against age. Changes in live weight or dimension for a period of time are explained by growth curves (Keskin et al., 2010). Analysis of animal growth performance through the life span is helpful to establish appropriate feeding strategies and the best age for slaughtering. Studies focusing on growth curves have increased in recent years due to the development of new computational methods for faster and more accurate analyses as well as the availability of new models (Souza et al., 2013). Slow growth rates resulting in low market weight has been identified to be one of the factors limiting profitability in production system (Noor et al., 2001; Abegaz et al., 2010). Growth rate is related to rate of maturing and mature weight and these latter traits have been suggested to be related with other lifetime productivity parameters in sheep (Bedier et al., 1992; Abegaz et al., 2010).
Non-linear mathematical models, empirically developed by plotting body weight against age, are suitable to describe the growth curve in different animal groups (Malhado et al., 2009). The use of mathematical growth models provides a good way of condensing the information into a few parameters with biological meaning, to facilitate both the interpretation and the understanding of the phenomenon (Fitzhugh, 1976; Malhado et al., 2009). Growth curve parameters provide potentially useful criteria for modifying the relationship between body weight and age through selection (Kachman and Gianola, 1984) and an optimum growth curve can be obtained by selection for desired values of growth curve parameters (Bathaei and Leroy, 1998). Growth curves provide several applications to animal production, such as (1) evaluation of the response to treatments over time; (2) analysis of the interaction between subpopulations (or treatments) and time; and (3) identification of heavier animals at younger ages within a population (Bathaei and Leroy, 1996; Freitas, 2005; Malhado et al., 2009).
No previous studies have been conducted on growth curve characteristics of the Guilan sheep. Therefore, the objective of this study was to describe the growth pattern in Guilan sheep using non-linear models. For this purpose, six mathematical models (Brody, Negative exponential, Logistic, Gompertz, von Bertalanffy, and Richards) currently used to fit the growth pattern of animals were examined to evaluate their efficiency in describing the growth curve of Guilan sheep.
Material and methods
The data set used in this study was obtained from the Agricultural Organization of Guilan Province (Rasht, Iran) and comprised 42,257 weight records, which were collected on 18,972 lambs from birth to 240 days of age from years 1994 to 2014. The data were screened several times and defective and out of range records were deleted. After editing the initial data set, 41,894 body weight records (made up of 19,879 for males and 22,015 for female lambs) were used for statistical analysis.
Non-linear growth functions used to describe the growth curves of Guilan sheep are presented in Table 1. The Brody, Negative exponential, Logistic, Gompertz, Von Bertalanffy and Richards functions were fit to the data to model the relationship between weight and age. Each model was fitted separately to body weight records of all lambs, male and female lambs using the NLIN and MODEL procedures in SAS (SAS Institute Inc., Cary, NC, USA; 2002) and the parameters were estimated. The NLIN procedure produces least squares or weighted least squares estimates of the parameters of a non-linear model. For each non-linear model to be analyzed, the model (using a single dependent variable) and the names and starting values of the parameters to be estimated must be specified. When non-linear functions were fitted, the Gauss-Newton method was used as the iteration method. To begin this process the NLIN procedure first examines the starting value specifications of the parameters. If a grid of values is specified, NLIN procedure evaluates the residual sum of squares at each combination of parameter values to determine the set of parameter values producing the lowest residual sum of squares. These parameter values are used for the initial step of the iteration. The MODEL procedure analyzes models in which the relationships among the variables comprise a system of one or more nonlinear equations. Primary uses of the MODEL procedure are estimation, simulation, and forecasting of nonlinear simultaneous equation models (Ghavi Hossein-Zadeh, 2014).
Table 1 Functional forms of equations used to describe the growth curve of Guilan sheep.
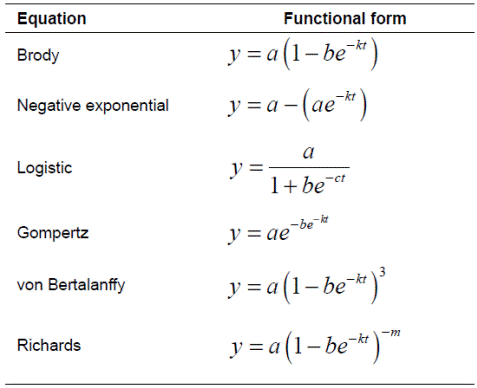
y = body weight at age t (day); a = asymptotic weight, which is interpreted as mature weight; b = is an integration constant related to initial animal weight.The value of b is defined by the initial values for y and t; k = is the maturation rate, which is interpreted as weight change in relation to mature weight to indicate how fast the animal approaches adult weight; m = is the parameter that gives shape to the curve by indicating where the inflection point occurs.
The models were tested for goodness of fit (quality of prediction) using adjusted coefficient of determination ( R adj ), residual standard deviation or root means square error (RMSE), Durbin-Watson statistic (DW), Akaike’s information criterion (AIC) and Bayesian information criterion (BIC).
 was calculated using the following formula:
Where:
 = is the multiple coefficient of determination
TSS = is the total sum of squares.
RSS = is the residual sum of squares.
n = is the number of observations (data points).
p = is the number of parameters in the equation.
The R value is an indicator measuring the proportion of total variation about the mean of the trait explained by the growth curve 2 model. The coefficient of determination lies always between 0 and 1, and the fit of a model is satisfactory if R is close to unity.
RMSE is a sort of generalized standard deviation and was calculated as follows:
Where.
RSS = is the residual sum of squares.
n = is the number of observations (data points).
p = is the number of parameters in the equation.
RMSE is one of the most important criteria to compare the suitability of growth models. Therefore, the best model is the one with the lowest RMSE.
DW was used to detect the presence of autocorrelation in the residuals from the regression analysis. In fact, the presence of autocorrelated residuals suggests that the function may be inappropriate for the data. The Durbin-Watson statistic ranges in value from 0 to 4. A value near two indicates no autocorrelation; a value toward 0 indicates positive autocorrelation; a value toward 4 indicates negative autocorrelation (Ghavi Hossein-Zadeh, 2014). DW was calculated using the following formula:
Where:
et = is the residual at time t.
 = is the residual at time t-1.
AIC was calculated as using the following equation (Burnham and Anderson, 2002):
AIC is a good statistic to compare models of different complexity because it adjusts the RSS for the number of parameters in the model. A smaller numerical value of AIC indicates a better fit when comparing models.
BIC combines maximum likelihood (data fitting) and choice of model by penalizing the (log) maximum likelihood with a term related to model complexity, as follows:
A smaller numerical value of BIC indicates a better fit when comparing models.
Results
Estimated parameters of non-linear growth functions for Guilan sheep are presented in Table 2. Also, goodness of fit statistics for 2 the six growth models fitted to body weight records are presented in Table 3. R2 adj values had little differences among the models 2 for all lambs, males and females, but Brody model and Richards equation provided the greatest R2 adj values for all lambs, males 2 and females, and Negative exponential provided the lowest values of R2 adj for males, females and all lambs (Table 3).
Table 2 Parameter estimates for the different growth models in Guilan sheep (standard errors are in parentheses)
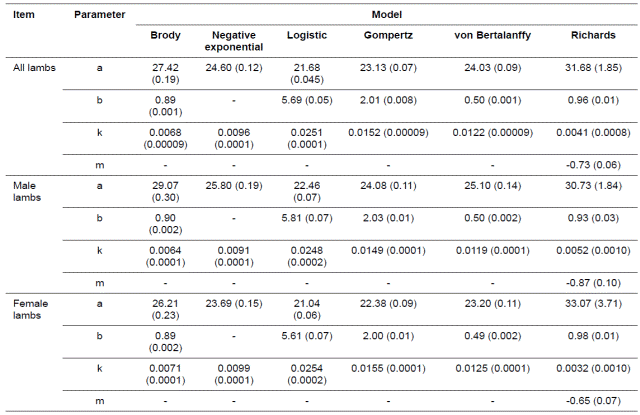
Also, Negative exponential function had the lowest values of DW for males, females and all lambs, but other functions had little differences in this regard. In general, DW values were relatively low for different models and the Negative exponential model provided the lowest value for males, females and all lambs. The Richards equation provided the lowest values of AIC and BIC for females and all lambs, but the Brody model provided the lowest values of AIC and BIC for male lambs. Richards and Brody equations provided the lowest values of RMSE for females and all lambs. Also, Richards, Brody and von Bertalanffy equations provided the lowest values of RMSE for male lambs. But, Negative exponential model provided the greatest values of RMSE, AIC and BIC for all lambs, males and female lambs. Therefore, the Brody model was selected as the best model for fitting the growth curve in males, and the Richards model provided the best fit of growth curve in females and all lambs. The Negative exponential model provided the worst fit of growth curve for males, females and all lambs. The parameter a is considered as an estimate of asymptotic weight. For the data set studied here there were low asymptotic weight estimates for Brody and Richards equations as the best fitted growth models (Table 2).
Table 3 Goodness of fit for different growth curves in Guilan sheep.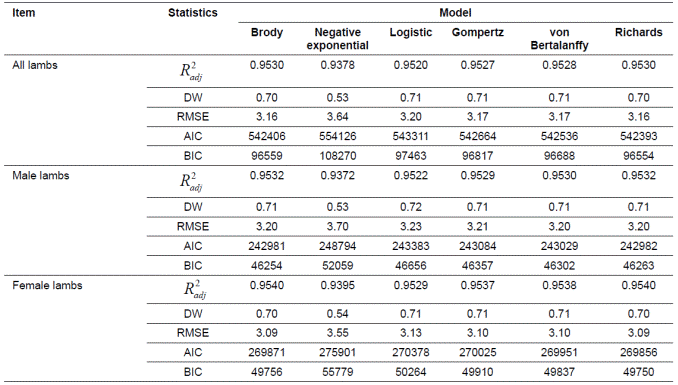
R 2 adj : Adjusted coefficient of determination; RMSE: Root means square error; DW: Durbin-Watson; AIC: Akaike information criteria; BIC: Bayesian Information Criteria.
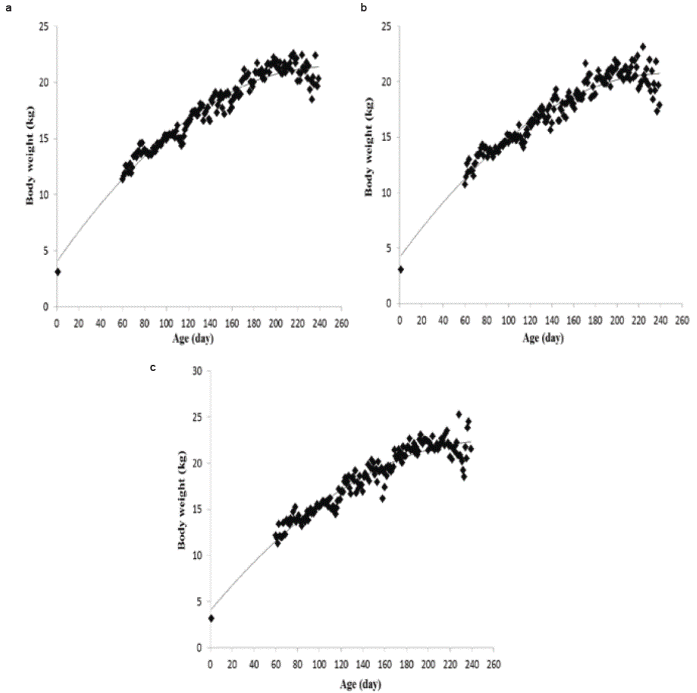
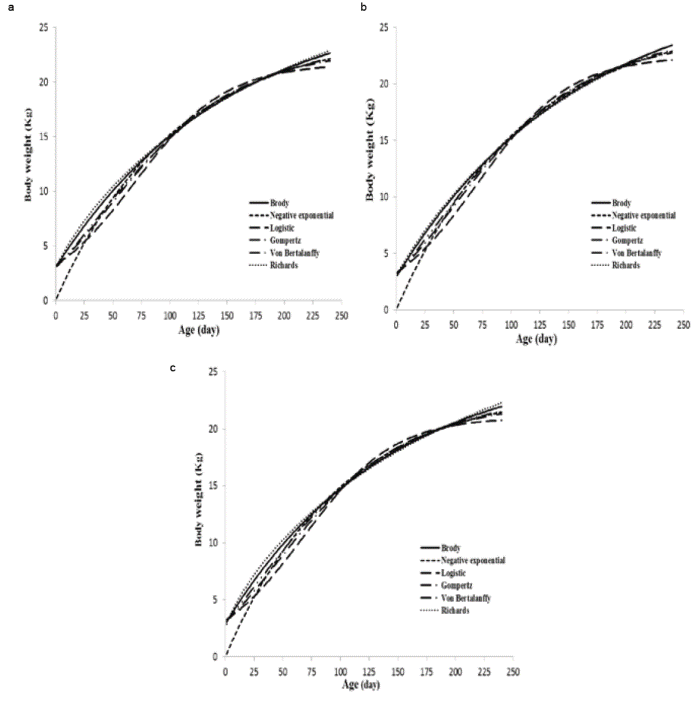
The k parameter, which represents maturation rate, is another important trait to be considered, since it indicates the growth speed to reach the asymptotic weight. In this study, females generally showed higher values for this parameter than males. The negative correlation of -0.99 to -0.98 between a and k parameters obtained, was based on the best model for males, females and all lambs. Observed body weights of animals from 1 to 240 days of age are depicted in Figure 1. As shown, there was a sigmoidal trend for body weights along with increase in age. Also, predicted body weights (Kg) as a function of age (days) obtained with different growth models for all lambs, males and females, are presented in Figure 2. The estimated growth curves were typically sigmoid.
Discussion
Once an appropriate model of the growth curve is selected, selection emphasis can then be directed exclusively to the level of the growth curve. It is important to develop an optimal strategy to achieve a desired growth shape through changing the growth model parameters. In previous studies, a broad range of growth models have been selected, depending on how accurately they fit the data. Tariq et al. (2013) selected the Morgan-Mercer-Flodin model as the best fitted equation for growth curve in Mengali sheep breed of Balochistan. Similar to the results of this study, Gbangboche et al. (2008) selected the Brody model as the best function to fit the growth curve of the African Dwarf sheep. On the other hand, Freitas (2005) reported that Logistic, Von Bertalanffy and Brody functions were more versatile to fit growth curves in sheep. In the Bergamasca sheep in Brazil (McManus et al., 2003), among the fitted growth models (Brody, Richards, and Logistic), the Logistic model showed the goodness of fit. Lambe et al.(2006) selected the Richards and Gompertz models for their accuracy of fit among four competing models (Gompertz, Logistic, Richards and the Exponential model). The Gompertz and von Bertalanffy models showed the best fit in Morkaraman and Awassi lambs (Topal et al., 2004); Gompertz model in Suffolk sheep (Lewis et al., 2002). Malhado et al. (2009) reported that both Gompertz and Logistic functions presented the best fit of growth curve in Dorper sheep crossed with the local Brazilian breeds Morada Nova, Rabo Largo, and Santa Inês. Bathaei and Leroy (1996), evaluating growth in Mehraban Iranian fat-tailed sheep, selected the Brody function because of simplicity of interpretation and ease of estimation. Sarmento et al. (2006) observed that the Gompertz function presented the best adjustment when compared to the other models in studies of growth curves of Santa Inês sheep herds in the state of Paraíba, Brazil. Akbas et al. (1999) studied the fitting performance of Brody, Negative exponential, Gompertz, Logistic and von Bertalanffy models to data on weight-age of Kivircik and Daglic male lambs and found that the Brody model was the best equation for describing the growth of lambs. Similar to the current results, Goliomytis et al. (2006) and Ghavi Hossein-Zadeh (2015) reported the excellent fit of the Richards function to the weight-age data of Karagouniko and Shall sheep, respectively. On the other hand, da Silva et al. (2012) observed that Richards model was problematic during the process of convergence in Santa Inês sheep.
According to the low DW values obtained in the current study from fitting the non-linear models of the growth curve, it was concluded that there was positive autocorrelation between residuals for all models. The Negative exponential model provided the most positive autocorrelation among different models. It seems that residual autocorrelation presented no problem, or only a very slight one in the current study. Positive autocorrelation is a serial correlation in which a positive error for one observation increases the chances of a positive error for another observation (Ghavi Hossein-Zadeh, 2014). The lower estimates of a parameter, obtained from the best fitted models in this study, may indicate that animals are lighter as adults and may be considered fast-growing, as these sheep require less time to reach maturity compared to other breeds (da Silva et al., 2012).
The definition of an optimum adult weight is controversial as it depends on the species, breed, selection method, management system and environmental conditions (Malhado et al., 2009). It was reported that average adult live weight in Guilan sheep is 35 Kg (77 lbs) for rams and 31 Kg (67 lbs) for ewes (Eteqadi et al., 2014). These values were generally consistent with the estimates of the a parameter obtained from the best fitted models in this study.
Contrary to the current results, da Silva et al. (2012) reported high asymptotic weight estimates in Santa Inês sheep, but their animals were between 120 and 774 days of age. Lôbo et al. (2006) evaluated the growth curve of Santa Inês sheep from birth to 550 days of age and obtained greater a value than the current study. Also, McManus et al. (2003) in the study of growth curve from birth to 2,000 days of age in Bergamácia sheep obtained a greater estimate of a parameter compared with this study. Generally, consistent with the current results, Malhado et al. (2008) studied the growth curve of Texel×Santa Inês crossed sheep from birth up to 365 days of age and obtained a values ranging from 29.14 to 32.16 Kg. Also, Malhado et al. (2009) reported a values of 29.35 to 32.41 in the fit of different growth functions for the Morada Nova, Rabo Largo, and Santa Inês Brazilian sheep breeds. These Brazilian breeds were weighted from birth up to 210 days of age in the study by Malhado et al. (2009). Toral (2008) warned that inferences about estimated parameters may often be subject to errors because the datasets that are used to fit nonlinear growth functions do not include animal growth until maturity. Similarly, Garnero et al. (2005) stated that when the available data cover only growth before reaching maturity, these data can produce erroneous a and k estimates. Animals with high k values show precocious maturity in relation to those with lower k values and similar initial weight. The greater values of k for female lambs in this study indicates higher maturity rates (i.e., they reached mature weight earlier).
Because of the narrow deviation range in the weight at birth, the variation among the k values becomes a reliable predictor of the growth rate (Malhado et al., 2009). Therefore, animals with higher k values reach asymptotic weight earlier. Bathaei and Leroy (1996) estimated much higher k values for body weight than the current study, for males and females of the Mehraban Iranian fat tailed sheep, when applying the Brody growth model over a 48-month period. This difference could be attributed to the time unit (month) and time period (four years) they used compared with the present study, and the different growth function used (Goliomytis et al., 2006). Goonewardene et al. (1981), Rogers et al. (1987) and Perotto et al. (1992) obtained different k values when applying different growth functions to the same weight-age data, indicating that the model of choice affects parameter estimates.
The most important biological correlation for a growth curve is between a and k parameters. The negative correlation between these parameters in the current study implies that the earliest animals are less likely to exhibit high adult weight; i.e., animals that have higher adult weights generally present lower growth rates than animals with a lower adult weight (da Silva et al., 2012). Also, similar to the sigmoidal patterns of growth curves in this study were obtained by other studies (Goliomytis et al., 2006; Malhado et al., 2009; da Silva et al., 2012).
The six non-linear functions investigated in the present study were adequate in describing the growth pattern in Guilan sheep.
However, the Brody model provided the best fit of growth curve in males, and the Richards model for females and all lambs due to 2 the lower values of RMSE, AIC, and BIC and greater values of R adj than the other models. The results of this study show that current growth curve models would be very helpful in genetic breeding programs, flock nutritional management, and decision making on culling of animals with slow growth rate. In this condition, selection could be made for animals with faster growth rate and or that are early-maturing after observing their individual growth curve. After selecting a desired model of the growth curve for this breed of sheep, it is worth noting to develop appropriate genetic selection and management strategies along with the provision of good environmental conditions in the flock to achieve a suitable shape of growth curve via modifying the model parameters.
Acknowledgements
The corresponding author would like to acknowledge the University of Guilan for financial support of this research (Project No.
989).


