


 English (pdf)
 Article in xml format
 Article references
 Send this article by e-mail
 Cited by SciELO
  Cited by Google
  Similars in
SciELO
Similars in
SciELO  Similars in Google
 Permalink
Introduction
Sheep play an important role in food production systems and are frequently recognized as a multi- purpose species capable of improving the rural economy. Rusticity, high fertility, and adaptability to harsh conditions are noticeable traits of these animals (Radhikag et al., 2015).
Sheep farming represents a profitable production system in Colombia due to the favorable conditions of the market, in which the demand for products from these animals has increased over time. This situation makes sheep one of the most promising livestock species in the rural sector of the country (Barrios, 2005).
According to the national inventory of Instituto Colombiano Agropecuario (ICA), for 2016 Colombia had a population of 1,423,466 sheep across the country. However, Guajira, Boyacá, Córdoba, and Cesar provinces concentrate 74% of the total sheep population.
The origins of Colombian sheep date back to the indigenous wool sheep resulting from crosses between European breeds and indigenous hair sheep breeds which, in turn, descended from African breeds. These animals were introduced to the country 500 years ago during the conquest and have experienced a process of adaptation to Colombian tropics (Delgado et al., 2009).
Other foreign breeds such as Katahdin, Santa Inés, Dorset, Dorper, and Hampshire are also present in Colombia. These breeds have been extensively used because of their higher productive performance compared with local indigenous breeds, however, the former do not have the adaptation level of the latter (Egito et al., 2002). On the other hand, the use of only a few genetic superior males for intensive mating might cause a reduction of the effective population size, higher levels of inbreeding and finally, decreased genetic diversity within breeds (Pastrana et al., 1996).
The increasing interest in the conservation of genetic resources has encouraged studies to characterize the genetic diversity of several livestock species and breeds (Sodhi et al., 2006). Microsatellite molecular markers have been extensively used with this purpose by several authors (Kugonza et al., 2011; Dixit et al., 2012; Souza et al., 2012; Awobajo et al., 2015; Jiang et al., 2015) taking advantage of their high polymorphism, codominant inheritance, abundant presence with wide dispersion in the genome, and high repeatability (Dodgson et al., 1997).
The objective of this study was to estimate the genetic diversity of three Colombian sheep breeds using a panel of 10 microsatellite markers and to determine the genetic structure between these populations.
Materials and methods
Ethical considerations
The protocol used to obtain blood samples was approved by the ethics committee for animal experimentation of the Universidad de Antioquia (Act 71, June, 2012).
Animals and samples
Blood samples were collected from 362 sheep of the following Colombian breeds: ovino de pelo colombiano (OPC), criollo de lana (CRL), and Mora Colombiana (MORA). The animals were located in 43 farms in 11 Colombian provinces (Antioquia, Boyacá, Caldas, Cesar, Córdoba, La Guajira, Magdalena, Nariño, Santander, Sucre, and Valle del Cauca). The samples were taken following recommendations by the MoDAD (FAO, 1996).
DNA extraction and genotyping
Genomic DNA was extracted from white blood cells using MOBIO commercial kit (Ultra Clean DNA Blood Isolation Kit, Calalog # 12000-100, Los Ángeles, California, USA). The quantity and quality of the extracted DNA was measured with a NanoDrop 2000 spectrophotometer (Thermo Scientific, Wilmington, Delaware, USA).
The panel used for genotyping the animals contained 10 microsatellites (Table 1) recommended by the Food and Agriculture Organization (FAO, 2011), and the International Society of Animal Genetics (ISAG) for diversity studies in sheep. The markers were chosen according with their polymorphism level detected in previous studies (Bozzi et al., 2009; Zhong et al., 2010; Álvarez et al., 2012; Ben Sassi et al., 2014) and their location in different chromosomes.
Microsatellites were amplified in two multiplex PCR assay: Multiplex 1 (SRCRPS9, MCM140, OARCB226, MAF214, ILSTS5, SRCRSP1) and Multiplex 2 (MAF33, ILSTS28, SRCRSP5, ILSTS11). Each PCR tube with a final volume of 10 μL contained ?120 ng genomic DNA, 0.2 mM of each dNTP, 1.85 U Taq Hot Start polymerase (ABM), 0.2 μM fluorolabeled forward primer and unlabeled reverse primer, 1.14 µL GC Enhancer (Applied Biosystems, Foster City, California), 1.5 mM MgCl2 and miliQ water up to adjust the final volume.
Amplification was carried out in a PTC 100 thermocycler (MJ Research Inc., Waltham, Massachusetts, USA) and PCR cycling conditions were as follows: initial denaturation at 95°C for 5 min followed by 35 cycles of denaturation at 95°C for 75 sec, annealing at 55°C for 45 sec, and extension at 72°C for 60 sec, and a final extension at 72°C for 10 min.
The fluorescent labelled PCR products were mixed with Hi Di formamide and Liz 500 TM internal size standard, denatured at 95°C for 5 min and genotyped on a capillary electrophoresis ABI PRISM® 310 DNA analyser (Applied Biosystems). The analysis for allele identification was performed using GENEMAPPER 4.1 software (Applied Biosystems).
Statistical analysis
The allele frequencies for all loci, number of alleles (NA) and the effective number of alleles (ENA) observed per locus, observed (OH) and expected (EH) heterozygosities were estimated for each marker with GenAIEx 6.5 software (Peakall y Smouse, 2012). The polymorphic information content (PIC) was calculated with the Excel Microsatellite Toolkit V 3.1.1 (Park, 2001).
The tests to obtain the deviations from the Hardy- Weinberg (HW) were estimated for each breed using Markov Chain Monte Carlo simulations with Genepop 4.2 software (Rousset, 2008). The population genetic structure was analysed by obtaining the Wright F-statistics (FIS, FST, and FIT) following the methods described by Weir y Cockerham (1984) and using Fstat 2.9.3.2 software (Goudet, 2002).
The genetic differentiation was examined in two steps. First, the genetic distances between breeds were determined using the method of Nei (1987) with GenAIEx 6.5 and Genepop 4.2. Software. These values were used to create a consensus tree through the un-weighted pair group method with arithmetic mean (UPGMA) included in MEGA 6 software (Tamura et al., 2013).
Subsequently, the population genetic structure was calculated with a Bayesian iterative algorithm using STRUCTURE software (Pritchard et al., 2000), which randomly assigns individuals to a pre- determined number of genetic groups K, according with the genotype of the multiple loci evaluated, measuring the admixture levels within individuals and

determining the K value for the parental populations. The analysis of the present study included a correlated allele frequencies model, assuming a level of non- independence (Pritchard et al., 2000; Zuccaro et al., 2008; Ciani et al., 2013).
A representative K value for the sample set was obtained by running three independent simulations for three pre-selected K values (1 ≤ K ≤ 3). All runs were performed with 200,000 burn-in period and 1,000,000 MCMC iterations after burn-in. Finally, the most appropriate K value in the populations was calculated with the ΔK algorithm used by Evanno et al. (2005).
Results
Population genetic variability
In total, 134 alleles were identified in the 362 genotyped individuals. The NA ranged from 9 to 21 for loci SRCRSP1 and ILSTS28, respectively, with an average NA of 13.4. Parameters evaluating population genetic variability by locus are presented in Table 2.
The EH ranged between 0.615 (ILSTS 5) and 0.855 (OarCB2256), with a population mean of 0.63, indicating high levels of genetic variability in the breeds.
The OH ranged between 0.428 (SRCRSP5) and 0.831 (ILSTS 28), with an average of 0.672 for all the loci.
The average PIC for the 10 markers was 0.742 with no values lower than 0.5, suggesting that all loci were highly polymorphic. The average FIS value was different from zero (0.102; p<0.05). Several microsatellites such as SRCRSP 5, ILSTS 11, MAF 214, and OarCB2256 showed FIS values higher than 0.1, indicating an excess of homozygote individuals for these markers in the populations.
The FIT, which measures individual heterozygosis respect to that of the total population was 0.151 (p<0.05), indicating a 15.1% general deficit of heterozygote individuals in these populations. The FST, which measures the genetic variability explained by differences between breeds was 0.054. Therefore, most of the total genetic variability comes from differences among individuals (94.6%), while only 5.4% is due to differences between breeds. This suggests a very low level of genetic differentiation between the populations studied.
Genetic variability within breeds
The MNA for all breeds was 9.6. The OPC sheep had the highest MNA (12.40), while MORA showed the lowest MNA (7.90). Different parameters to evaluate genetic variability for each breed are presented in Table 3.
Table 2 Summary statistics in Colombian indigenous sheep population analysed by 10 microsatellite loci.
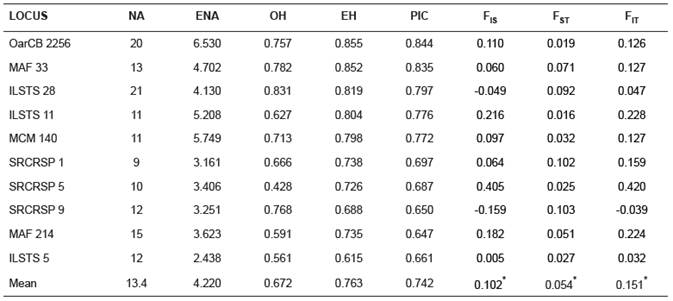
*p<0.05. NA: number of alleles. ENA: effective number of alleles. OH: observed and EH: expected heterozygosities. PIC: polymorphic information content. F-statistics (FIS, FST, FIT).
Table 3 Summary statistics for three Colombian indigenous sheep breeds analysed by 10 microsatellite loci.
N: number of animal sampled. MNA: mean number of alleles. MENA: mean effective number of alleles. OH: observed and EH: expected heterozygosities. FIS: F-statistic. OPC: ovino de pelo colombiano. CRL: criollo de lana
The lowest values of OH and EH were observed in MORA breed (0.606 and 0.671, respectively), while the highest OH and EH were obtained for the CRL breed (0.689 and 0.762, respectively). There were no large differences between EH and OH, with the CRL and MORA breeds showing the highest and lowest differences, respectively. In general, all breeds showed high genetic diversity.
Inbreeding parameters (FIS) for each breed had a mean of 0.107. All breeds showed FIS levels higher than zero, indicating a general deficit of heterozigote individuals.
From a total of 30 tests to evaluate HW equilibrium in each breed (Table 4), 15 showed significant deviations (p<0.05), which is explained by the heterozygosity deficit.
Figure 1 shows the phylogenetic tree constructed from the matrix of Nei standard genetic distances.
The CRL and MORA breeds are grouped in the same node, separated from the OPC individuals.
Population structure was analyzed using STRUCTURE program with the expected number of clusters (K) ranging from 1 to 3. According with the method proposed by Evanno et al. (2005), it was assumed that K = 3 is the most likely number of ancestral populations that contribute to the genetic diversity observed in Colombian sheep breeds. There was no clear differentiation between populations under any of the K values tested (Figure 2), which indicates high admixture levels.
Table 4 Hardy Weinberg equilibrium test by breed.
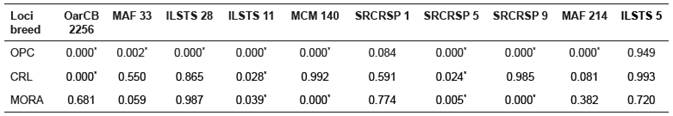
* Significant deviation from Hardy Weinberg equilibrium (p<0.05). OPC: ovino de pelo colombiano. CRL: criollo de lana.
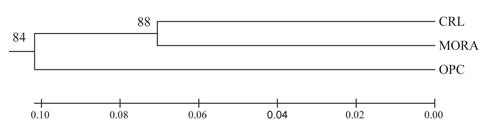
Figure 1 Phylogenetic tree (UPGMA) representing Nei’s standard genetic distances between CRL (criollo de lana), MORA and OPC (ovino de pelo colombiano) breeds.

Discussion
We studied the genetic diversity of three Colombian indigenous sheep breeds by using microsatellite molecular markers. According with reference values reported by ISAG/FAO (2011) for the minimum number of alleles using this panel of microsatellites, all loci were highly polymorphic. The average NA found in this study (13.4) is higher than that obtained by Nanekarani et al. (2010) using 15 microsatellites in a population of 360 sheep of four breeds in Iran. The EH, best estimator of the genetic diversity present in a population (Kim et al., 2002), had a value of 0.63, indicating that the indigenous sheep population in Colombia has a high genetic variability. Except for SRCRSP 9 and ILSTS 28 loci, the OH was always lower than the EH. Similar results were found by Bozzi et al., (2009), Arora et al., (2010), Zhong et al. (2010), and Gornas et al., (2011) in sheep populations of Sudan, India, China, and Italy, respectively.
Polymorphic information content (PIC), a parameter indicative of the degree of informativeness of a marker, ranged from 0.647 (MAF214) to 0.844 (OarCB2256). In the present study all markers were highly informative (PIC>0.5; Arora et al., 2006). These observations suggested the additional utility of these markers for population assignment (Arora et al., 2010) in indigenous sheep and gene mapping (Kayang et al., 2002).
On the other hand, it is important to note the low level of differentiation observed among breeds (FST = 0.054). Similar results were found by Bozzi et al. (2009), Zhong et al. (2010), Álvarez et al. (2012), and Ben Sassi et al. (2014), who reported FST ranging between 0.09 and 0.3. Genetic similarity between Colombian sheep breeds could be explained by a high flow of genes between farms that borrow or lease rams and also because of the poor control in breeding programs within sheep farms.
All three breeds showed high MNA. The OPC breed had the highest MNA (12.40), which in turn is higher than the value reported in Mexican indigenous sheep (7.8 alleles/locus; Quiroz et al. (2007), Paraguayan indigenous sheep (7.25 alleles/locus; Ochipinti et al. (2012), American indigenous sheep (7.71 alleles/locus; Blackburn et al. (2011), Kenyan indigenous sheep (6.16 alleles/locus; Muigai et al. (2009), and Indian indigenous sheep (5.48 alleles/locus; Arora et al. (2010). It is important to note that OPC individuals represented 80.66% of the total population sampled, however, this percentage is similar to the proportion of this breed in the sheep national inventory (Martinez et al., 2009).
The significant deviations found in the HW tests and the high values of FIS found in each breed indicate a general deficit of heterozygote individuals. This could have been caused by nonrandom mating (Arora et al., 2010), selection (Álvarez et al., 2012) and the Wahlund effect which means the presence of substructures in the sheep populations (Nei, 1987).
Nevertheless, it is highly probable that the main origin of this heterozygosity deficit is the high levels of endogamy in the flocks, which is caused by mating individuals with closely related ancestors, which in Colombia is related with poor animal identification, lack of mating control (Martínez et al., 2009), and the lack of clear breeding objectives. Moreover, most sheep farms in Colombia only have one or two rams, which must be mated with all the females of the flock, thus increasing endogamy and reducing genetic diversity (Tolone et al., 2012).
The standard genetic distances allowed grouping CRL and MORA breeds in a same node. It is essential to highlight that MORA breed was developed 50 years ago by ICA by crossing CRL (50%), Hampshire (23%), Romney Marsh (19%), and Corriedale individuals (8%) to obtain animals for meat production but also recessive homozygotes for black coloured wool (Pastrana et al., 1996). On the other hand, these are wool sheep breeds with a common geographical origin, since they are descendent of Churra and Manchega Spanish sheep breeds. In addition to this, CRL and MORA breeds are closely bred in the high tropics of Colombia, and the crossing between individuals of these breeds is frequent. Therefore, the results of the distance matrix and the phylogenetic tree can be explained by the common geographical location, the origin of these breeds and the breeding practices to obtain genetically improved individuals through crossbreeding strategies.
The Bayesian analysis using STRUCTURE program assumed a value of K = 3 as the most likely number of ancestral populations to explain the genetic diversity and structure of the Colombian sheep populations. As Figure 2 showed, none of the clusters had a clear differentiation, which suggests the presence of high admixture levels in these sheep breeds. This could be considered as a phenomenon of introgressive hybridization in which there is a gene flow from one population into the gene pool of another, but in this case, this introgression would occur between different proportions of the genetic material of three ancestral breeds, as showed by the most likely K value. The group of wool sheep imported from Europe 500 years ago (Churra and Manchega breeds, mainly) would make up the first ancestral population, from which the current Colombian sheep are descendants (Pastrana and Calderon, 1996). African sheep brought to America after the colonization would make up the second ancestral population, and from which breeds like OPC, Black Belly, and Pelibuey would be descendants. European breeds introduced to the region long after the conquest times with the aim of genetically improving wool sheep could make up the third ancestral group.
In conclusion, all three Colombian sheep breeds showed high genetic variability, evidenced by high polymorphism and number of alleles per locus for the molecular markers used for genotyping. However, a heterozygosity deficit was present to some extent in all breeds, something mainly attributed to endogamy within sheep flocks. In order to maintain the existing genetic diversity, breeding strategies (i.e. seed stock exchange oriented) aiming to maintain effective population size while minimizing inbreeding and genetic drift, should be implemented, especially for MORA and CRL. Besides, a conservation program is recommended for MORA and CRL breeds, including in vitro (e.g. germplasm bank) and in situ (e.g. maintenance of flocks) approaches.
Acknowledgements
The authors thank the committee for research development CODI, Universidad de Antioquia (Project code 2012-5019), the Grupo de Investigación GaMMA from the Universidad de Antioquia (Project code E01808), and CORPOICA (Colombia) for financial support of this research. We also thank all the farmers who facilitated the sampling process necessary for conducting this study.

