


 English (pdf)
 Article in xml format
 Article references
 Send this article by e-mail
 Cited by SciELO
  Cited by Google
  Similars in
SciELO
Similars in
SciELO  Similars in Google
 Permalink
Introduction
The global population of Buffaloes (Bubalus bubalis) reaches approximately 195 million, with India as the country with the largest number (110 million; Food and Agriculture Organization-FAO, 2014). Buffalo milk production has shown a significant increase since the emergence of industrial units dedicated to production of milk derivatives. One of the main reasons for this remarkable growth has probably been the unique quality and flavor of these products, particularly, mozzarella cheese. In addition, buffalo milk has greater content of major constituents and more nutritional advantages compared to bovine milk (Aspilcueta et al., 2010).
The economic return of buffalos depends on milk production and reproductive efficiency of the animals, and both are affected by the calving interval (Ramos et al., 2006). Although there is a collective effort towards registering all the productive and reproductive information, a large portion of the world’s buffalo farming does not have suitable data control for estimating the accurate breeding value of the buffaloes. The lack of appropriate data banks hinders the implementation of selection programs, which are essential for achieving genetic improvement. This study proposes a method to assist the ranking of buffaloes, despite having a compromised pedigree data structure.
In general, data sets from the animals are evaluated using univariate analysis. This type of analysis is limited since it does not consider possible correlations between traits in the study (Fraga et al., 2015). Multivariate analysis, including principal components and cluster, is an efficient method for sorting buffaloes according to productive and reproductive potential to assist in the selection and culling of animals, and to allow adjusting the management. It is important to note that these techniques have been used in livestock production and genetic improvement to decrease the sample space of the traits, and to assemble homogeneous groups as well as for other purposes (Kadegowda et al., 2008; Neser et al., 2008; González et al., 2011; Ventura et al., 2012; Vohra et al., 2015).
This study proposes a method to assist the ranking of buffaloes despite a compromised pedigree data structure. Therefore, the objective of this study was to jointly evaluate milk yield per lactation (MP), lactation length (LL), and calving interval (CI) in a herd of crossbred Murrah buffaloes to support the clustering according to their potential.
Materials and methods
Data and management of buffaloes
The survey was conducted with milk production information from a herd of crossbred Murrah buffaloes from Castanha Grande Farm, located in the city of São Luiz do Quitunde, in the northern coast of Alagoas state, Brazil, with geographic coordinates: Latitude 9° 10’ 06” and longitude 35° 33’ 40”. Milk yield from 109 female buffaloes was analyzed. The data bank included 543 milk production records obtained between 2000 and 2014. The number of lactations per female buffaloes varied between 2 and 14. The following characteristics were evaluated: Milk production/lactation (MP) in litters, lactation length (LL), and calving interval (CI) in days for crossbred Murrah buffaloes. Buffaloes were milked twice a day (in the morning and afternoon) with a mechanical bucket milker using a piped vacuum line, and restrained in tandem (capacity: 24 individual buffaloes). Buffaloes were bathed before milking, which is important to stimulate intestinal evacuation. This procedure contributes to keeping the milking room clean. In addition to contributing to milk quality, this practice reduces stress. Buffaloes were bred during lactation in a semi-intensive system. The animals were kept in Braquiária humidícula pastures and received urea-enriched silage of sugarcane plants (Saccharum officinarum), including the aerial part. In addition, mineral supplementation and balanced concentrate were provided.
Feed was offered in the following proportions: Buffaloes yielding between 5 to 7.5 L of milk/d received 1 Kg of ration/d; buffaloes yielding between 8 to 10.5 L of milk/d received 2 Kg/d of ration.
Statistical analysis
Principal component analysis. Standardized phenotypic values of all traits from the 105 buffaloes were used in the PCA. Phenotypic values were standardized with the following formula:

Where:
z: Is the standardized value of.
: Is the average of a trait.

s: Is the standard deviation of the trait.
Principal Components (PC) are calculated through linear combinations of the original variables with eigenvectors. The absolute value of an eigenvector determines the importance of the traits in a principal component. Each eigenvector is calculated from an eigenvalue of the correlation matrix of the data (p<0.001), where eigenvalues are related to the variance of each principal component (Rencher, 2002). The first principal component (PC1) explains the highest percentage of the total variance, the second principal component (PC2) explains the second highest, and so on, until all variances are explained. In a data bank with p variables, the random vector:
Having correlation matrix R with eigenvalue- eigenvector pairs (), for i = 1,2,...,p, Rencher (2002).
Where:
The i th principal component is given by:

Where:
e ip : Is the p th eigenvector;
x p : Is the p th value of the original variable.
The criterion of Jolliffe (1972, 1973) was used to select the main components that explain most of the variation in the data bank. This criterion discards PC with eigenvalues less than 0.7 because it only explains a small part of the total data variability.
Previous group division by hierarchical clustering
Hierarchical cluster analysis using the Ward’s criterion was performed by finding a suitable number of groups within the population. The Ward’s method consists of aggregating two clusters such that growth of within-inertia is minimized (minimizing the reduction of the between-inertia) at each step of the algorithm. Within-inertia characterizes the homogeneity of a cluster. The hierarchy is represented by a dendrogram which is indexed by the gain of within-inertia. As previously mentioned, the hierarchical clustering is performed on the principal components (Lê et al., 2008).
Choice of number of clusters from a dendrogram
The choice of the number of clusters was performed using the “FactorMineR” package (Husson et al., 2016). This choice is a fundamental issue and several approaches have been proposed. The number of groups can then be chosen according to the overall look of the dendrogram, the bar graph, the variance within groups and other criterions. These rules are often based on, implicitly or not, the growth of inertia. They suggest a division into Q groups when the increase of variance between (Q-1) and Q cluster is larger than Q and (Q+1) cluster. All analyses were implemented with computational algorithms available in the R software 3.0.1 (R core team, 2016).
Results
The average (± standard deviation -SD) of milk yield per lactation, lactation length, and calving interval were 2,197.30 Kg (± 410.96), 277.01 d (± 37.21) and 438.35 d (± 66.41), respectively. The MP/LL, MP/CI, and LL/CI correlations (p value) were 0.72 (p<0.00), 0.10 (p<0.32), and 0.35 (p<0.00), respectively. Based on these results obtained for the main components, their respective eigenvalues and percentages of the variance explained by each, the first two components were responsible for more than 92.32% total data variation (Table 1). The first PC was responsible for approximately 61.45% and the second was responsible for 30.87% of the total variation.
Table 1 Principal components and percentage of variance explained by the components of milk yield, lactation length, and calving interval of Murrah breeding Buffaloes.
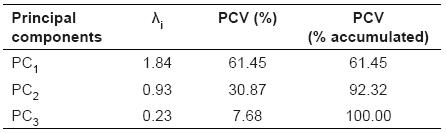
PC1: First principal component; PC2: Second principal component; PC3: Third principal component; λi: Eigenvalues; PCV: Percentage of variance explained by the components.
The 1st and 2nd equations were assembled using the first two principal components: (1st equation; 2nd equation). The main component in the 1st equation is the result of the linear combination of all the variables studied with the weighting coefficients, MP and LL, those which presented highest coefficients. Therefore, the first component is called productive component. The 2nd equation shows that the CI is the most important trait for the second main component, which is called the reproductive component (Table 2).
Table 2 Weighting coefficients for milk production, lactation length and calving interval of Murrah breeding Buffaloes and correlation with the first two principal components.
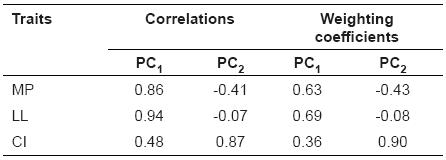
Figure 1 shows the major explanation of the total variation of the data by two main components represented in a cartesian plane. Figure 2 presents information from two multivariate analysis techniques: Main components and cluster analysis. The dendrogram (Figure 3) was obtained by hierarchical cluster analysis with the grouping of the Ward method based on the Euclidean distance, separating the buffaloes into 3 groups according to the studied traits.
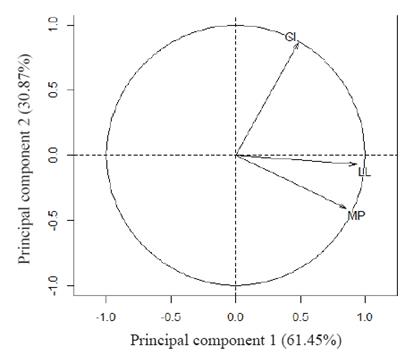
Figure 1 Incidence of vectors milk production (MP), lactation length (LL), and calving interval (CI) on the first two principal components.
Figure 2 Grouping of female buffaloes in cluster 1, 2, and 3 according to the first two principal components.*
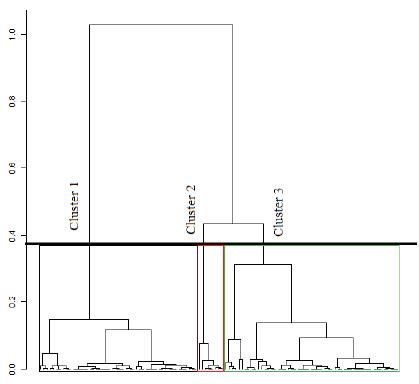
Figure 3 Buffaloes assembled by hierarchical clustering analysis according to MP (milk production per lactation), LL (lactation length), and CI (calving interval) performances.
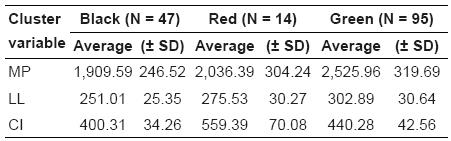
The average values for each one of these groups are shown in Table 3.
Discussion
Taking into account all factors in the production system, the herd showed superiority in milk production per lactation (2,232.86 Kg) and duration of lactation (275.44 d), in addition to lower range of calving interval (420.42 d), when compared to other herds. Rodrigues et al. (2010) studied 1,182 records of female Murrah Buffaloes and their cross-breedings in northern Brazil, finding average milk production per lactation and lactation length of 1,663.84 Kg and 269.89 d, respectively. Aspilcueta et al. (2010) estimated average 1,814 Kg for MP per lactation in southeastern Brazil. In northern Brazil,Pereira et al. (2008) found average of 451 d analyzing the information of 420 calving intervals in female Murrah x Mediterranean Buffaloes.
Table 3 Summary statistics for milk production (MP) per lactation (litters), lactation length (LL), and calving interval (CI) in days of breeding Murrah Buffaloes grouped in three clusters (Figure 2).
Correlation between milk production and lactation length (0.72) was high and positive, indicating that large LL will increases MP. Lower values for this association were reported by Malhado et al. (2009), Afzal et al. (2007) and Barros et al. (2016), who found values of 0.57, 0.62, and 0.59 in Murrah, Nili Ravi, and undefined breed buffaloes, respectively.
Correlation between MP and CI was low and positive (0.10). Therefore, the increase in MP leads to greater CI value. However, higher CI reflects low reproductive performance of buffaloes. Authors such as Ramos et al. (2006), and Malhado et al. (2009) found almost null correlation values between MP and CI, 0.01 and -0.02, respectively, indicating that these traits are phenotypically independent. That is, the variation of one does not imply altering the other.
The association between LL and CI was positive and median (0.35), showing that higher LL leads to increased CI, which is not desirable. In contrast, an increase in LL will contribute to an increase in MP, which is a favorable relation. Aziz et al. (2001) also found a positive and median correlation (0.47) between LL and CI in Egyptian buffaloes.
Considering the results of association between the traits studied, the use of principal components analysis can help interpreting the data, aiding in the decisions aimed to improve animal production. The PC technique allows creating a new set of uncorrelated variables from a set of correlated ones. This new set is able to explain the total variance observed between the data to facilitate the interpretation of interdependence between them.
The first two principal components effectively summarized total sample variance and it was possible to use the data bank study. In accordance with Jolliffe (1972; 1973), only PC3 component presented finding that only the first 4 PCs were necessary to explain the covariance structure of the features. Furthermore, Agudelo-Gómez et al. (2015) reported that the first three PCs from eight reproductive features in dual purpose buffaloes in Colombia presented eigenvalues higher than one, which explained 65.8% of the total variation. Vohra et al. (2015) concluded that the first four components from 13 different body measurements of Gojri Buffaloes were sufficient to explain 70.9% of the total variation.
According to Rencher (2002), at least 70% of the total variation must be explained by the first two principal components. Hence, the first two principal components were enough for the quality of the hierarchical cluster analysis, through the dispersion of scores in graphics which axes are the components (Figure 2) under the conditions of our study.
Figure 2 shows the highest concentration of buffaloes of the green group in the same region where the LL and MP vectors (Figure 1), which exhibited high incidence on the first principal component. These buffaloes are those with the highest potential for LL and MP (Table 3). Regarding CI, the red group buffaloes are mostly found in the same quadrant as the CI vector (Figure 2), which has a higher impact on the second main component (Figure 1). Although the red group buffaloes presented high values for the CI, they do not represent the best performance for this trait. In this particular case, smaller values for the calving interval reflect the best results in a production system.
The green group gathered the buffaloes with the highest milk production per lactation and lactation length. In the red group, the buffaloes have the highest CI, and in this case, the worst performance for CI. On the other hand, the black group gathered buffaloes that showed inferior values of MP and LL, but intermediate values of CI, as seen in Table 3. These results provide buffalo classification that simultaneously takes into account the most important features of the system. The cluster analysis allowed three distinct buffalo groups according to milk production per lactation (Kg), lactation length (days), and calving interval (days), jointly evaluated. Based on buffalo grouping, farmers can take specific decisions on nutritional and reproductive management and culling. Therefore, when animals are separated in groups according to their productive and reproductive potential, they are also separated according to their nutritional or sanitary requirements. This technique also helps with reproductive management during the formation of the mating groups according to farm objectives.

