


 English (pdf)
 Article in xml format
 Article references
 Send this article by e-mail
 Cited by SciELO
  Cited by Google
  Similars in
SciELO
Similars in
SciELO  Similars in Google
 Permalink
Introduction
Genetics association studies (GAS) aim to detect associations between one or more genetic polymorphism and a quantitative or discrete trait by testing for a correlation between a specific trait and a genetic variation (Lewis and Knight, 2012). The number of genetic association studies have increased, and their assessment has become a powerful approach to identify common and rare variants underlying complex diseases (Wu et al., 2012), discovering causative mutations (Schwarzenbacher et al., 2016), or identification of quantitative trait loci (QTLs; Jahuey et al., 2016) on a population. Nevertheless, inconsistencies in GAS due to the combination of factors contribute to spurious or not consistently results (Table 1).
The inconsistencies found in GAS suggest that many original results could be false-positive (type I errors), especially in studies with systematic differences between sample and population, affecting their representativeness (Shingarpure and Xing, 2014). Thus, factors like paternity misidentification, stratification, and population structure are crucial in establishing sample size and its representativeness (Pyo and Wan, 2012). Other important source of inconsistencies in GAS are undetectable small genetic effects (false-negative, type II errors) (Lee, 2015). In this regard, poor design quality of the database usually means high p-values and low recognition of genetic associations (Ioannidis, 2005), especially when genotypes have low frequencies in the population or the study deals with low heritability traits (Satkoski et al., 2011).
Table 1 Results of genetic association studies between CSN3 gene with milk yield in dairy cattle.
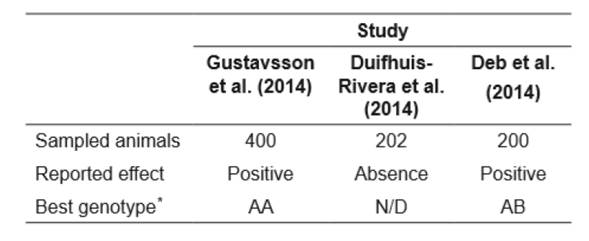
*Best genotype: genotype reported with the best performance for milk yield ; N/D gen-trait association absent.
This lack of reproducibility tends to produce genetic associations of no value for genetic improvement. Ioannidis (2005) defined bias as the combination of design, data, analysis, and presentation factors resulting in findings that otherwise should not be produced. However, most reviews on bias in GAS have focused in the analysis of the genetic factors or address other factors as part of the genetic issues.
Bovine breed(s) considered in the study has been addressed as a genetic source of bias due to intra- and inter-racial diversity in genetic population (Lenstra et al., 2014), especially in the presence of crossbred animals (Dickerson, 1993). Besides, contemporary group factor has been confounded with the pure environment effect as it affects results due to the influence of interaction between genotype and environment (Ramírez-Valverde et al., 2008). Additionally, genomic factors of bias are associated with the gene loci governing expression, and are confused with environmental or residual variance (Burgueño et al., 2012), especially if those factors have an epigenetic nature such as genomic imprinting (Manolio et al., 2009), or influences more than one marker like the linkage disequilibrium, pleiotropy or polygenic effect (Pereira et al., 2016).
Lastly, even when the statistical model used in GAS is not usually confounded or assessed as a genetic factor of bias, its importance as a possible source of bias is remarkable since there are models that can work with just few markers at the same time (Pärna et al., 2012) and methods to determine the associations of thousands of markers at once. The variability resulting from the use of so different assessment methods could then be confounded with genetic or sampling factors of bias. Thus, it is necessary to classify bias in GAS according to its nature to better understand and reduce possible spurious results. Therefore, the objective of this study was to identify and classify potential sources of bias and determine possible strategies to avoid it in genetic association studies.
Sources of bias in genetic association studies
Different approaches, based on related or non- related individuals, have been used to carry out GAS (Table 2). The literature reports that some widely cited associations cannot be replicated due to inaccuracies in the approaches used to determine them (Sagoo et al., 2009). In this sense, inconsistencies in GAS could be attributable to factors such as genetic, genomic, sampling-related, or statistical, which influence production traits, and contribute to the risk of false- positive results (Pärna et al., 2012)
Genetic factors
The breed(s) used in the study could be a source of bias due to intra- and inter-racial bovine genetic population diversity (Figure 1). Besides, the presence of crossbred populations confers changes in the behavior of offspring, relative to that of the parents. Modifications can be evaluated by direct, maternal effects and heterosis of breeds and their crosses, with enough precision to predict the expected behavior of several breeding alternatives and mating systems (Dickerson, 1993). On this regard, Trail et al. (1984) reported direct and maternal effects on economic production traits in crossbred Boran cattle showing differences due to paternal or maternal breed.
Contemporary group (CG) is another genetic factor of bias, affecting results by the influence between genotype and environment interaction. Contemporary group as a fixed effect reduces bias in genetic comparisons, while the variance of the prediction error is reduced when CG is considered random (Ramírez-Valverde et al., 2008).
Genomic factors
Genomic factors of bias are associated with the gene loci governing expression and are confused with environmental or residual variance (Burgueño et al., 2012). Genomic imprinting bias in GAS is related with production traits due to their nature as epigenetic factors (Manolio et al., 2009). Han et al. (2013) mentioned that maternal effects could be confused with genomic imprinting because they produce the same parent-of-origin patterns of phenotypic variation, leading to an over- or underestimation in GAS of traits that include maternal effects. Su et al. (2012) reported a 3.5% bias decrease in genetic association values when additive, dominance, and epistatic effects are included in the analysis model compared to models previously reported that only included the additive effect.
Table 2 Former and current approaches used in genetic association studies.
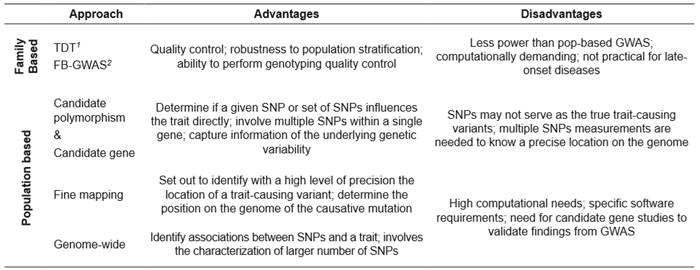
1TDT: transmission disequilibrium test; 2FB-GWAS: family based genome-wide association study (Benyamin et al., 2009; Foulkes, 2009).
The type of markers used in GAS is a potential source of bias due to its effect on the analysis power to determine the linkage disequilibrium (LD) level of the data (Goode and Jarvik, 2005). Additionally, Rosenberg et al. (2010) reported mean information content (IC) differences between microsatellites and biallelic markers across the genome, with a better performance from the second one (Figure 2). Moreover, according with Kinghorn et al. (2010) correct choice of markers could increase the performance of quantitative genotyping.
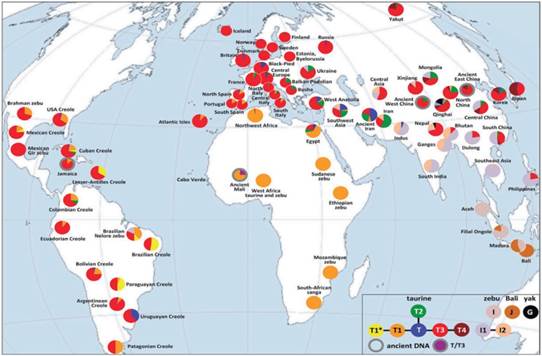
Figure 1 Diversity and distribution of major Bos taurus and Bos indicus haplogroups (taken from Lenstra et al., 2014).
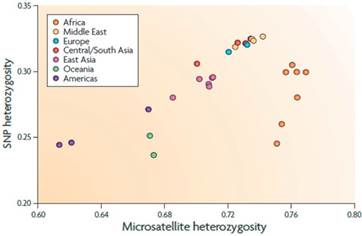
Figure 2 Information content variability for haplotype level in Europeans (taken from Rosenberg et al., 2010).
Monomorphism bias is based on the presence of uninformative markers in GAS (De et al., 2014). Thus, appearance of possible loss of power related with use of inadequate type of marker can occur. Another important genomic factor of bias is the minor allele frequency (MAF), it shows different behavior according to its effect size (Figure 3) and it is related with the Hardy-Weinberg proportions (HWP) potential bias. Therefore, MAF bias could occur if GAS use low density, monomorphic, or incorrect type of markers (Eynard et al., 2015).
Pleiotropic and polygenic effects are other important genetic sources of bias due to the influence over more than one economic trait in cattle (Figure 4).
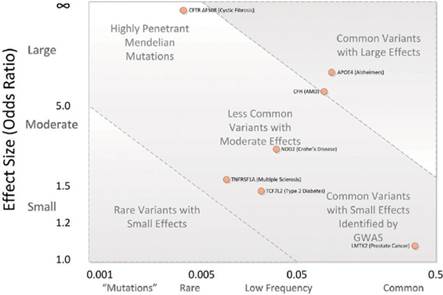
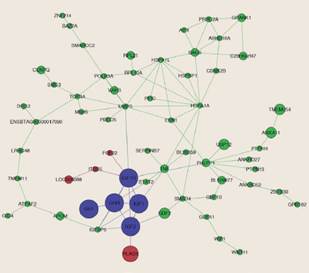
Figure 4 Network of candidate pleiotropic genes for carcass traits in Nellore cattle (taken from Pereira et al., 2016).
Pleiotropic genes, such as PLAG1, operate like satellite regulators of the growth pathway while polygenic effect influences the estimation of genetic values. Segregation factor potential bias is related with the monomorphic and type of marker factors of bias and highly influences the linkage disequilibrium (LD) in the population (Bush and Moore, 2012). Since, LD describes the degree to which an allele of one SNP is inherited or correlated with the allele of another SNP within a population (De et al., 2014), recombination events and type of markers to detect them are critical for the development of this factor bias.
Genomic factors also include heritability bias, which is related with the gap between the phenotypic variance explained by GWAS results and those estimated by classical heritability. Zaitlen and Kraft (2012) mentioned that “missing heritability” could be due to presence of rare variants, epistatic and gene-environment interactions, or structural variation, that are not well captured by current GWAS or their analysis methods.
Sampling-related factors
Sample selection is another source of bias. It is defined asany systematic difference between the sample and the population affecting its representativeness (Shringarpure and Xing, 2014), leading to inaccurate estimation of relationships between variables (Figure 5). According to Pyo and Wan (2012), a larger sample size is required to achieve enough statistical power and to improve the ability of prediction. On the other hand, small sample size increases false negative rates and reduces the reliability of a study.
Paternity misidentification, stratification, and population structure are also factors related to sample size and its representativeness. On this regard, Visscher et al. (2002) determined a proportional selection response decrease of 2 to 3% for each 10% of paternity misidentification rate. Additionally, Sifuentes-Rincón et al. (2006) reported differences of 47% in the genetic values between simulated- and uncertain- paternity populations. Similarly, stratification bias could lead to spurious association that have no value as a tool for genetic improvement. In this sense, Zaitlen and Kraft (2012) mentioned that stratification bias arises when there is a difference in the phenotypic variance between the population.
Statistical factors
Statistical factors of bias are those related with the model and the nature of data used. According to Pyo and Wang (2012), the observed signal for association is considered statistically significant when the p-value is lower than a present threshold value (e.g., 0.05) to reject a null hypothesis of genetic association. Poor design quality of the database usually means high p-values and lower recognition of genetic associations (Ioannidis, 2005), especially if some of the genotypes have low frequency in the population or traits with low heritability (Satkoski et al., 2011).
Odd ratios can be a statistical factor of bias (Figure 6) when they are wrongly used as a weighted average to quantify genetic effects in GAS (Su and Lee, 2016). Due to their non-collapsible nature and tendency towards being null, a quantitative difference between conditional and marginal odd ratios in the absence of confounding is a mathematical oddity, not a reflection of bias (Groenwold et al., 2011).
Another factor that could cause bias is collinearity, which refers to the non-independence of predictor variables, usually in a regression-type analysis (Dormann et al., 2013). Yoo et al. (2014) mentioned that collinearity inflates the variance of regression parameters with a potential misidentification of relevant predictors in a statistical model. Dias et al. (2011) reported multicollinearity in genetic effects related with weaning weight in a Brazilian cattle population. They reported 9.8% of bias in the sum squared deviations, with variance inflation factors of 16 and 5.3 when using least square and ridge regression methodologies, respectively.
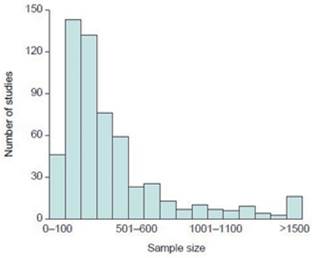
Figure 5 Sample size used in genetic association studies showing type I errors (taken from Ioannidis, 2005).
The presence of collinearity could lead to collider bias (i.e., the reversal paradox), an artificial association created between exposures (A and B) when a shared outcome (X) is included in the model as a covariate (Day et al., 2016). Day et al. (2016) identified over 200 spurious GAS, when the shared outcome was included as a covariate in the model used to analyze the data.
One of the most important sources of bias in GAS is the statistical model chosen due to the differences within obtained results (Figure 7). The first models used in GAS included only fixed effects, causing bias when random effects were ignored (Miciński et al., 2007). On the other hand, mixed models can differentiate between the effects of random error and those from systematic error (Pärna et al., 2012). In the same way, Maximum likelihood (ML) is another procedure used in GAS with potential of bias. Kučerová et al. (2006) determined that ML can estimate genetic associations of casein genes and reported mean differences in protein concentration between 42 and 73% across κ-casein genotypes (AA, AB, AE, BB, and BE). However, when estimating a higher number of associations (e.g. )
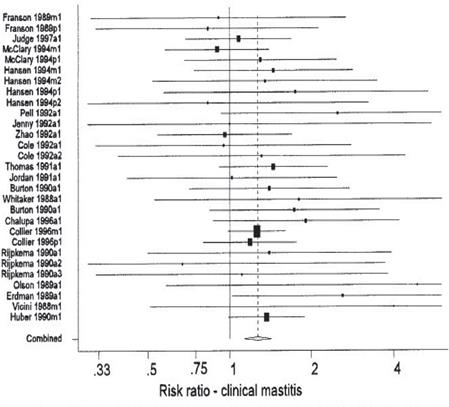
Figure 6 Forest plot of the effects or recombinant bovine somatotropin on the risk ratio of clinical mastitis (taken from Dohoo et al., 2003).
Extensive GAS need methods to determine the associations of thousands of markers at once. On this regard, De los Campos et al. (2009) reported Bayesian regression models (BM) able to adjust for the effects of thousands of markers simultaneously. Tenesa et al. (2003) observed that the differences between estimates obtained with ML and BM were small (about 5%), and both estimation procedures yielded essentially the same results. On the other hand, there are non-Bayesian models (NBM) that use information of genotyped and non-genotyped animals to perform genomic predictions (e.g. single-step genomic model) (Ma et al., 2015). However, due to its ability to estimate genetic association, even with markers lacking information, BM and NBM are under the influence of sample size and require a pedigree as complete as possible (Sahana et al., 2010).
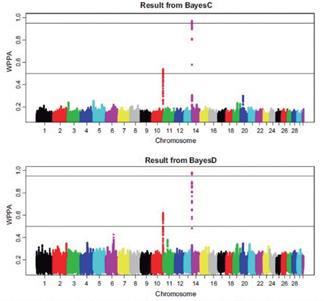
Figure 7 Probabilities of association obtained with two different Bayesian-based methods (taken from Bennewitz et al., 2017).
Strategies to correct biases in GAS
The aim of bias correction in GAS methodologies focuses on bias reduction, rather than its elimination (Pärna et al., 2012). Thus, it is possible to group bias correction into genetic-genomic, statistical, and methodological strategies.
Genetic-genomic strategies
Strategies of genetic-genomic bias correction rest on two aspects: source and conditions of genetic information. The source of genetic information in GAS refers to the approach used to obtain and report genetic information (i.e., single and multi-loci genotype or haplotype). Instead of analyzing the effects of individual alleles, some researchers estimate the effects of haplotypes defined by genes associated with the traits under study (Zhou et al., 2013), while other authors use multi-loci genotypes for the same purpose (Jaiswal et al., 2016).
The use of haplotypes and multi-loci genotypes can reduce bias arising from the way several genes are combined, the polygenic effect of the studied traits, and the position of the analyzed loci within the genome. However, unlike multi-loci genotypes, it has been argued that haplotypes have similar effects on different breeds (Andrés et al., 2007). As a result, a common approach to analyzing the effects of haplotype has been to determine the most likely configuration for each and assume that this allocation of haplotypes is known without error when subsequent statistical analyses are performed. However, precise haplotype construction could be difficult, and often leads to biased estimates and reduced analytical power in GAS (Andrés et al., 2007). In addition, when multiple loci are genotyped, haplotypes are unknown because there is no information about linkage phase of alleles at different loci (Sahana et al., 2010). Sahana et al. (2010) observed a high rate of type I error when using haplotypes as a fixed effect in genetic association models. Zhang et al. (2016) concluded that when there is a lack of tools available to reconstruct haplotypes, the best alternative is to use multi-loci genotypes regardless of whether phase adjustment information is available.
Other factors affecting the reliability of results are the number of markers used for reconstruction and the way that haplotypes and multi-loci genotypes are included in GAS models. For reconstruction, the best results have been obtained using 2 to 5 markers (Abdallah et al., 2004). In this sense, the main benefit of using haplotypes or multi-loci genotypes is their ability to explain most of the additive, dominance, and epistasis effects on the loci studied (Zhao et al., 2012). With respect to inclusion methods, incorporating haplotype as a random effect conveys better performance compared with models that include it as a fixed effect in terms of power, control of type I error, and precision (Boleckova et al., 2012). Hence, some of the probable HWP bias in these studies can be avoided, especially if the nature of the alleles being studied is considered. Kent et al. (2007) concluded that due to the risk of wrong associations, it is best to use common genetic variants greater than 10% as rare alleles generate biases in their association values and equally affect the values of common alleles. Therefore, the conditions needed to establish the use of haplotypes, genotypes, or both in GAS are of utmost importance for devising strategies to correct bias of genetic information.
Sampling-related and statistical strategies
Methodological strategies used to avoid sampling bias are based on grouping individuals or samples that share the same features in order to reduce heterogeneity and increase representativeness of results (Gustavsson et al., 2014). On the other hand, the use of previously reported information becomes important when establishing a methodological bias reduction strategy. Published information enables to use features and results previously validated, and helps to avoid the risk of bias related with transferring results among breeds (Poulsen et al., 2015).
Methodological strategies to reduce bias associated with statistical source are based on reviews, as well as the use of estimates and other literature results to determine the best models and features for the studied phenomenon (Brito et al., 2011). Commonly used association methods are based on family structure (pedigree) and case-control studies with unrelated individuals (De los Campos et al., 2009). However, case-control studies are the most viable to study genetic association because studies based on family structure involve extended testing periods (Kent et al., 2007). The presence of type I errors due to the subjective nature of the estimates (underlying assumptions) could address the risk of under- or overestimation of studied traits (Zoche-Golob et al., 2015). Therefore, the best strategy to reduce statistical bias lies in all aspects related to the predictive power of the approaches since it depends on all elements of bias that might arise.
In conclusion, it is necessary to consider the methodology used in previous GAS to establish a hierarchy of sources of bias and to facilitate better decisions on the use of tools to reduce inconsistencies in the results of future studies.

