


 English (pdf)
 Article in xml format
 Article references
 Send this article by e-mail
 Cited by SciELO
  Cited by Google
  Similars in
SciELO
Similars in
SciELO  Similars in Google
 Permalink
Introduction
High milk yield has been the primary selection emphasis in dairy breeding. However, many non- production traits, such as reproduction traits (Lucy, 2007), are important in minimizing cost and maximizing the net return of the dairy enterprise. Some researchers (Dematawewa and Berger, 1998; Haile-Mariam et al., 2003) mentioned that selection for increased milk yield may reduce reproductive efficiency, and increase susceptibility to certain diseases as well as the risk of culling due to diseases such as milk fever, displaced abomasum, and fatty liver. Milk persistency has been shown to be an economically important trait in dairy cattle (Haile-Mariam et al., 2003). For the same total yield, cows with lower peak yield and greater persistency may experience less energy imbalance and thus less reproductive and health problems than cows with higher peak yield (Haile-Mariam et al., 2003). In addition of these advantages, persistency can minimize feed costs, because the proportion of roughage in the diet of cows with flat lactation curves can be increased (Solkner and Fuchs, 1987). Hence, including PMY and other functional and reproduction traits in addition to production traits is necessary to improve the overall economic performance of dairy herds.
Several studies have been conducted to estimate genetic parameters for milk yield and composition (Sahebhonar, 2007; Ghavi Hossein-Zadeh and Ardalan, 2011), milk yield persistency (Seyed Sharifi et al., 2006), and reproductive traits (Toghiani Pozveh et al., 2009) in Iranian Holstein cows. The heritability and genetic relationship among economic performance traits are needed for planning efficient breeding systems and develop effective genetic evaluations.
One of the main advantages of multivariate analyses is that it increases the accuracy of evaluations. The gain in accuracy is dependent on the absolute difference between the genetic and residual correlations between traits. The larger the differences in these correlations, the greater the gain in accuracy of evaluations (Schaeffer, 1984; Thompson and Meyer, 1986). Also, there is an additional increase in accuracy with multivariate analysis resulting from better connections in the data due to residual covariance between traits (Thompson and Meyer, 1986). Therefore, the objective of this study was to estimate heritabilities as well as genetic and environmental relationships among total milk yield (TMY), persistency of milk yield (PMY), mean somatic cell count (SCC), mean loge somatic cell count (LnSCC), standard deviation of somatic cell count (stdSCC), and calving interval (CI) using two-trait and multi-trait analyses in Iranian Holstein.
Material and methods
Data
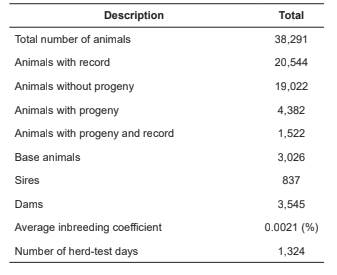
Test-day records of milk yield, somatic cell count and calving date of Holstein cows were obtained from the Animal Breeding Center of Iran. Herds with more than 500 test-day records from daughters of at least four different sires were included. Cows that calved for the first time between 20 and 40 months of age, and those that had at least 6 test-day records were considered in the analysis. Calving intervals between 290 to 600 days were included. Only records of cows with known pedigree were included. The final dataset consisted of records of 25,883 cows with first calving from July 2002 to September 2007 in 97 herds. The average number of daughters per sire was 23.28, and about 6% of the sires had more than 100 daughters. The total number of sires was 1,112. A summary of pedigree information is shown in Table 1.
Statistical methods
Using test-day records of milk yield, the 305-day total milk yield, first 100-day milk yield, and second 100-day milk yield were calculated with Wood’s gamma function. The MATLAB 7.7.1 software (Mathworks, 2008) was used for fitting the Wood’s gamma function and obtaining the corresponding parameters. The gamma function described by Wood (1967) is one of the most popular mathematical models used to describe the lactation curve as follows:
Yt= atbe-ct
where yt = milk yield on day t, a = a scaling factor to represent yield at the beginning of lactation, and b and c are factors associated with the inclining and declining slopes of the lactation curve, and e is the Napier number (~2.71828). Typical lactation curves have positive b and c (Tekerli et al., 2000). Atypical lactation curves were excluded from further analysis.
Two types of persistency measures were used in this study. The first type used ratios of different parts of the lactation, namely P2:1, P3:1 and Pweller. The P2:1 and P3:1 are the ratios of total milk yield in the second and third 100 days to the first 100 days of lactation, respectively. Pweller was introduced by Weller et al. (2006) as the estimated milk production at 180 day after peak, divided by the estimated peak production in percent as follows:
Pweller: = 100% × [PROD (270)][PROD (90)] -1
Where, PROD (270) = is the production at 270 DIM, and calculated by Wood’s function. They assumed peak production at first lactation occur at 90 DIM. Higher values of the above mentioned criteria indicate greater persistency.
The second type of measure for persistency used the Wood’s function as follows:
s = - (b + 1)ln(c)
Estimated genetic and environmental covariance components are sensitive to data amount and structure. In order to control over consistency of these estimates, two types of analysis were performed separately, including two and six-traits analyses. The WOMBAT1.0 software (Meyer, 2007) was used to estimate the variance and covariance components. The fixed part of the model included the effect of region, herd-year-season (four seasons i.e., winter, spring, summer, fall were assumed), age at first calving (months) and percent genetic contribution from the Holstein breed considered as covariate effects. The following linear model was used for data analysis:
Y ijklmn = µ + R i + HYS j + AFC k + bBL l + A m + e ijklmn
Where: Y ijklmn = is the ijklmn observation on TMY, PMY, mean SCC, mean LnSCC and stdSCC; µ = is the population mean; R i = is the fixed effect of region; HYS j is the fixed effect of herd-year-season of calving; AFC k = is the fixed effect of age at first calving; BL l = is the covariate effect of percent genetic contribution from the Holstein breed; b is the linear regression coefficient of traits on percent genetic contribution from the Holstein breed; Am = is the random genetic effect of the animal, and e ijklmn = is the random residual error.
Results
Summary statistics for studied traits are shown in Table 2 (estimated mean and standard deviations of traits). Mean TMY was 9,065 kg. Averages of P2:1, P3:1, Pweller and s were estimated as 1.063, 0.915, 0.803 and 7.709, respectively. Also, means of the test-day SCC and LnSCC were 245.1 and 4.869, respectively.
Table 2 Summary of descriptive statistics for the phenotypic values
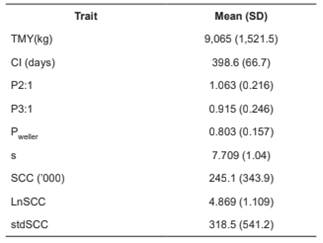
(based on 20,544 first lactation records).
SD: standard deviations; TMY: total milk yield; CI: calving interval; P2:1: [(milk yield second 100 days)(milk yield first 100 days)-1]×100; P3:1: [(milk yield third 100 days)(milk yield first 100 days)-1]×100; Pweller: [(milk yield 270d)(milk yield 90d)-1]×100; s = -(b + 1)ln(c); SCC: mean somatic cell count; LnSCC: mean loge somatic cell count; stdSCC: standard deviation of somatic cell count.
Estimates of variance components and heritabilities using single-trait analyses are shown in Table 3. Heritability of TMY was 0.29. There was not a large difference between estimates of heritabilities by single-trait and six-trait analyses (Tables 3 and 4 ). Among different measures of persistency of lactation, Pweller had the highest h2 (0.104 ± 0.015), and P2:1 had the lowest h2 (0.05 ± 0.011). The highest h2 among measures of SCC was for LnSCC (0.064 ± 0.012). Also, heritability of CI by single-trait and six-trait analyses were 0.044 and 0.041, respectively.
Table 3 Estimates of variance components and heritabilities of the traits obtained from single-trait analyses.
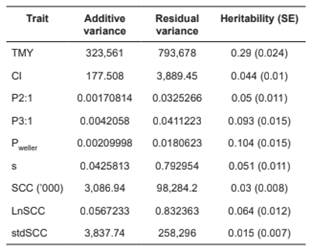
TMY: total milk yield; CI: calving interval; P2:1: [(milk yield second 100 days) (milk yield first 100 days)-1]×100; P3:1: [(milk yield third 100 days)( milk yield first 100 days)-1]×100; Pweller: [(milk yield 270d)( milk yield 90d)-1]×100; s = -(b + 1)ln(c); SCC: mean somatic cell count; LnSCC: mean loge somatic cell count; stdSCC: standard deviation of somatic cell count; SE: standard error of estimates.
Table 4 Heritabilities (bold on diagonal), genetic (above) and environmental correlations (below) for total milk yield (MY), calving interval (CI), P3:1, Pweller, s and LnSCC by six-trait analyses.
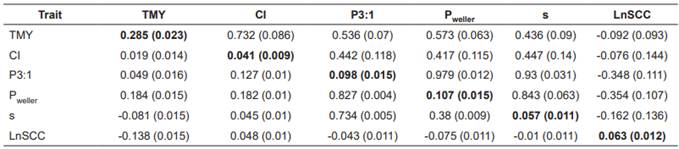
TMY: total milk yield; CI: calving interval; P3:1: [(milk yield third 100 days)( milk yield first 100 days)-1]×100; Pweller: [(milk yield 270d)(milk yield 90d)-1]×100; s = -(b + 1)ln(c); LnSCC: mean loge somatic cell count; SE: standard error of estimates.
Estimates of genetic and environmental correlations (rg and re, respectively) among traits are shown in Table 5. Genetic correlations between TMY and measures of PMY using two-trait and six-trait analyses were ranged from 0.436 (for TMY with s) to 0.573 (for TMY with Pweller). between TMY and CI by two- and six-trait analyses estimated as 0.71 and 0.732, respectively.
Table 5 Genetic (above) and environmental correlations (below) for total milk yield (TMY), calving interval (CI), different criteria of milk persistency and somatic cell count by two-trait analyses.
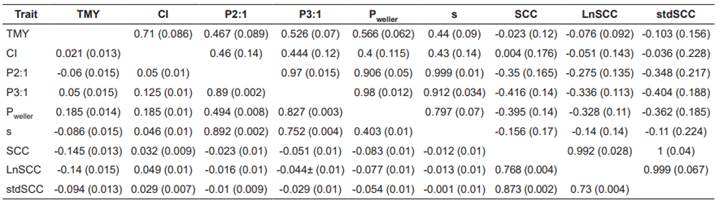
TMY: total milk yield; CI: calving interval; P2:1: [(milk yield second 100 days)(milk yield first 100 days)-1]×100; P3:1: [(milk yield third 100 days)(milk yield first 100 days)-1]×100; Pweller: [(milk yield 270d)( milk yield 90d)-1]×100; s = -(b + 1)ln(c); SCC: mean somatic cell count; LnSCC: mean loge somatic cell count; stdSCC: standard deviation of somatic cell count; SE: standard error of estimates.
Estimates of genetic correlations obtained by six- trait analyses were relatively higher than those of two trait analysis, although none of those correlation coefficients were significantly different from zero. Genetic correlations between measures of PMY and CI estimated by both two- and six-trait analyses ranged from 0.4 to 0.46. Genetic correlations between the measures of PMY and SCC were negative and moderate. Absolute value of rg between measures of PMY and SCC showed that SCC was more correlated with amount of milk production in late lactation rather than other lactation stages.
Discussion
Phenotypic parameters and heritabilities
Mean TMY was (9,065 kg) in the range from 5,558 to 10,881 kg reported by other researchers for Holstein breed (Dematawewa and Berger, 1998; Haile-Mariam et al., 2003; Kadarmideen et al., 2003; Muir et al., 2004; Weller et al., 2006; Bakir and Kaygisiz, 2013). The mean of CI was (398.6 d) slightly longer than that reported (from 382 to 398.3) by Haile-Mariam et al. (2003), Kadarmideen et al. (2003), Muir et al. (2004), and Dong and Van Vleck (1989), but is shorter than that of 406 reported by Ojango and Pollott (2001) for Holstein-Friesian cattle in Kenya. This difference is expected because CI is highly influenced by environment and management factors.
There was not a large difference between heritability estimates of by single-trait and six-trait analyses (Tables 3 and 4). The h2 of TMY (0.29) was in the range of estimates reported for Australian, Canadian and US Holstein cattle (Dong and Van Vleck, 1989; Dematawewa and Berger, 1998; Haile- Mariam et al., 2003; Muir et al., 2004; Weller et al., 2006; Kaygisiz, 2013).
As can be seen (Table 3), heritability estimates for different measures of persistency of lactation were low, averaging 0.075. The heritability of persistency has been reported to be between 0.01 and 0.3 (Gengler, 1996; Swalve and Gengler, 1999), and varied according to the measure used. The highest h2 for measures of SCC was for LnSCC (0.064±0.012). Estimates of Kennedy et al. (1982) for heritability of LnSCC ranged from 0.05 for ≤ 2 years old to 0.10 for mature (≥6 years) cows, and averaged 0.08 over all ages. Other researchers reported the heritability for this trait from 0.04 to 0.44 (Afifi, 1967; Ali and shook, 1980; Reents et al., 1995; Haile-Mariam et al., 2003).
Heritability of CI in this study by single-trait and six-trait analyses were 0.044 and 0.041, respectively. Kadarmideen et al. (2003) obtained h2 for CI as 0.024 for Holsteins in UK that was lower than our result. However, some other estimates of heritabilities for this trait were between 0.04 and 0.15 (Dong and Van Vleck, 1989; Ojango and Pollot, 2001; Haile-Mariam et al., 2003; Muir et al., 2004).
Correlations
Correlation between TMY and PMY. Genetic correlations between TMY and measures of PMY using two-trait and six-trait analyses were relatively high (ranged from 0.436 to 0.573), being in agreement with Solkner and Fuchs (1987), Swalve (1995) and Rekaya et al. (2000), whose estimates of genetic correlations between TMY and measures of s, P2:1 and P3:1 ranged from 0.33 to 0.56. However, the observed values disagreed with Haile-Mariam et al. (2003), and Weller et al. (2006), who reported lower estimates. Gengler (1996) recommended the use of a measure of persistency that is genetically independent of 305-d milk yield. In this study a moderate positive genetic correlation was estimated between yield and measures of persistency, indicating that selection for increased TMY can cause a correlated response for persistency.
Correlation between TMY and CI. The existence of a positive genetic correlation between TMY and CI (~0.7) indicates that selection for increasing TMY would increase CI, therefore it is unfavorable because of the reduced number of calves produced per cow’s lifetime. The rg obtained in the present study is higher than that reported for dairy cattle in Australia (~0.5) (Haile-Mariam et al., 2003), and was inconsistent with Ojango and pollot (2001), who reported a negative rg of -0.64 between calving interval and milk yield in the first lactation. Also, Ojango and pollot (2001) stated that genes that positively affect milk production are likely to reduce calving interval. Muir et al. (2004) reported a strong genetic correlation between TMY and CI (0.51 ± 0.11), and declared that a longer CI is associated with greater TMY in first lactation. The environmental correlation between TMY and CI was close to zero in the present study (0.02). This implies environmental conditions that increase TMY would not increase CI.
Correlation between TMY and SCC. Genetic correlations of TMY with measures of SCC were low. Environmental correlations between TMY and measures of SCC were negative, indicating that cows with higher production probably are experiencing better health and sanitation conditions. The correlation of TMY and stdSCC was slightly stronger than that of TMY and LnSCC (-0.103 vs. -0.076, respectively). It implies that the higher the consistency of SCC over the lactation period, the higher the TMY. Although h2 of stdSCC was lower than that of the mean of SCC and LnSCC, its correlation with other traits was higher; it may be useful and applicable for performing a correlated selection.
Haile-Mariam et al. (2003) estimated a negative genetic relationship between slope of LnSCC with mean MY (-0.27). They remarked that increase in LnSCC later in lactation is associated with reduced MY. However, a positive genetic correlation between SCC and milk yield in the first lactation has been reported by several researchers (Kennedy et al., 1982; Weller et al., 2006). Taking into account that those correlations were not significantly different from zero, it could be concluded that selection on TMY would not increase SCC.
In general, absolute environmental correlations were lower in magnitude than genetic correlations (Table 5). The exceptions was the environmental correlation between TMY and SCC measures. Estimates of phenotypic correlations (not shown) between all traits were also similar in direction to environmental correlations.
Correlation between PMY and CI. Measures of PMY had relatively high genetic correlations with CI (0.4 to 0.46). Estimates of the relationship between PMY and fertility are rare in the literature, though the relationship is assumed to be less antagonistic than that with TMY (Dekkers et al., 1998), as we found (~0.4). Lean et al. (1989) reported that cows with higher than average peak milk yields and poorer than average persistency were less likely to conceive in 1 or 2 services. In agreement with the result of the present study, Muir et al. (2004) reported an unfavorable correlation between PMY and CI (0.17), and expressed that the greater the persistency was in first lactation, the longer the interval was from first to second calving. It is important to know that Weller and Folman (1990) stated that late conception reduced profitability and showed early breeding to be advantageous, especially if the calf has a high value.
The antagonist genetic correlation of CI with P2:1 is higher than that with P3:1 and Pweller, which implies that the higher the ratios of milk production early in lactation to milk production late in lactation, the longer the CI. The main reason is that cows are usually in negative energy balance early in lactation and, as a result, animals with relatively low production are inseminated earlier and will consequently have shorter CI.
Correlation between PMY and SCC. The estimated negative and moderate genetic correlations between PMY and SCC in this study indicate that more persistent cows have lower SCC, healthier udders, and lower incidence of mastitis. Estimates of correlations by six-trait analyses were slightly higher. Absolute value of rg between measures of PMY and SCC showed that SCC was more correlated with milk production in late lactation rather than other stages of lactation. This agrees with Haile-Mariam et al. (2001), who reported that the magnitude of the correlation between milk yield and SCC within parity is relatively higher at the end of lactation. Also, our result was consistent with Haile-Mariam et al. (2003) and Weller et al. (2006), who reported negative rg.
Correlation between CI and SCC. Genetic correlations estimated for CI and measures of SCC were between -0.076 and 0.004. These results are in accordance with findings by Österman et al. (2005), who showed that the LnSCC throughout the lactation does not differ as a result of an extended CI, compared to the traditional 12 months CI, but disagreed with Haile-Mariam et al. (2003), Weller et al. (2006) and Rekik et al. (2008), who reported positive rg between CI and SCC. Rekik et al. (2008) reported that elevated SCS following parturition of heifers lengthened calving to first service and calving to conception intervals by up to 2 days. Estimates of the environmental relationships between CI and SCC are rare in the literature, though estimated correlations in the present study indicate that the factors decreasing SCC are those making CI longer. However, more research is required to clarify this relationship.
In conclusion, regarding the genetic correlation of PMY with TMY, CI and SCC, selection on PMY would result in some increase in the amount of 305- d milk production, improved health status (reduced number of somatic cells), but causes a depletion of fertility traits (increased CI). Among persistency measures, Pweller was easier to compute, had higher h2, higher rg with TMY, lower rg with CI, and lower standard deviation of estimated genetic correlations with measures of SCC. The genetic correlation between TMY and CI (0.71 to 0.732) was unfavorable, suggesting that selection for increased TMY increased CI. The absolute values of the correlations estimated with multiple-trait analyses were slightly higher than those of two-trait analyses.

