


 English (pdf)
 Article in xml format
 Article references
 Send this article by e-mail
 Cited by SciELO
  Cited by Google
  Similars in
SciELO
Similars in
SciELO  Similars in Google
 Permalink
Introduction
Persistency of lactation is typically defined as the ability of a cow to maintain milk production at a high level after the peak yield (Cole and Null, 2009). Although, milk yield is the main source of income in a dairy farm, lactation persistency has a great influence on the health, reproduction and feed costs of dairy cows (Gengler, 1996). Cows with higher lactation persistency require less energy in early lactation, allowing for greater utilization of cheap roughage (Solkner and Fuchs, 1987); therefore, any increase in lactation persistency will increase the profit per cow. Dekkers et al., (1998) reported that cows with greater persistency are more profitable than those with average persistency, and suggested that improving persistency would increase 305-d milk yield and decrease metabolic disorder stress in early lactation. There is not a clear consensus on how best to define persistency, and then many different measures for lactation persistency can be found in the literature (Solkner and Fuchs, 1987; Swalve, 1994; Jamrozik et al., 1998; Swalve and Gengler, 1999; Muir et al., 2004). Lactation persistency is not currently included in genetic evaluation of Iranian Holstein; therefore, the objectives of this study were to estimate (co) variance components and genetic parameters needed for routine genetic evaluations of lactation persistency in Holstein cows in Iran.
Materials and Methods
Data
Data used in this study were Holstein cows records collected from January 2000 to December 2012 by the Animal Breeding Center of Iran (Karaj, Iran). The evaluated herds (n=261) were purebred Holsteins, managed under conditions similar to those used in most developed countries, and were under official performance and pedigree recording. The diet, fed as a TMR, mainly consisted of corn silage, alfalfa hay, barley grain, fat powder, beet pulp, soybean meal and feed additives. Monthly milk yield was recorded by trained technicians from the Animal Breeding Center of Iran, according to guidelines of the International Committee for Animal Recording (ICAR, 2011). Cows with unknown birth date, calving date, birth number, or parity number were omitted. Age at first calving was calculated as the difference between birth and first calving dates, and was restricted to the range of 540 to 1,200 d. Test-day records before 6 d or after 320 d of calving were excluded, and cows were required to have a minimum of five test-day records per lactation. Therefore, the final data set consisted of 691,200 test-day records on 96,263 lactation records on first parity cows, 377,696 test-day records of 52,168 lactation records on second parity cows, and 182,143 test-day records on 24,951 lactation records on third parity cows, distributed in 261 herds.
Trait definition
Lactation persistency is the degree to which peak lactation yield is maintained during the remainder of the lactation period. Lactation persistency can be defined in several ways, as either ratios of yield in different parts of the lactation, to be derived from factors of lactation curves models, or a simple statistical parameter computed from test- day records. Four lactation persistency measures were used: P21: Ratio of milk yield in the second 100 days in milk (DIM) divided by that of the first 100 DIM (Johannsson and Hansson, 1940); P31: Ratios of production in the third 100 DIM divided by that of the first 100 DIM (Johannsson and Hansson, 1940); PW: The lactation persistency measure derived from the incomplete gamma function (Wood, 1967); PJ: The difference between milk yield in the 60th and 280th day of lactation (Jamrozik et al., 1998).
To describe the lactation curve and calculate lactation persistency, the incomplete gamma function proposed by Wood (1967) was used. The function was as follows: yt= atb e-ct, where yt is the daily milk yield in DIM of t. The variable t represents the length of time since calving, e is the Neper´s number, a is a parameter to represent yield at the beginning of lactation, b and c are factors associated with the upward and downward slopes of the curve, respectively. In this study, the incomplete gamma function was transformed logarithmically into a linear form as: , and fitted to monthly lactation yield records using a simple program written in Visual Basic (Microsoft Corp., Redmond, WA).
For each cow in each lactation, milk yields for the first, second, and third 100 DIM, milk yields on 60 and 280 DIM, as well as the 305-d lactation yields were calculated using parameters of incomplete gamma function fitted to monthly lactation yield records (Wood, 1967). The lactation persistency measure derived from the incomplete gamma function was calculated as:(Wood, 1967). Total 305-d milk yield, milk yield in the first, second, and third 100 DIM were estimated as: , where n1 and n2 were 1 and 305, 1 and 100, 101 and 200, and 201 and 305, respectively. Milk yield in the 60th and 280th day of milking was calculated as , and , respectively.
Typical lactation curves have positive a, b, and c, and curves with negative a, b, or c were considered atypical. In this study, 27.36 of cows in first, 26.12 in second, and 24.85% in third lactation had atypical lactation curves and were excluded. The final data set consisted of 532,081 test-day records on 75,583 lactation records on first parity cows, 297,548 test- day records on 41,364 lactation records on second parity cows, and 142,888 test-day records on 19,984 lactation records on 75,583 third parity cows, distributed in 261 herds.
Statistical analysis
(Co)variance components for four measures of persistency (P21, P31, Pw and Pj), 100- and 305-d milk yield were separately estimated for the first, second, and third lactations using single and multiple-trait animal model. The linear model included fixed effects of herd-year-season (HYS), covariate effects of first calving age (FCA), and DIM in both linear and quadratic forms, as well as animal and residual random effects. The following repeatability animal model was used to estimate repeatability of milk yield and lactation persistency:
Where yijk = record of animal k in the jth parity, and belonged to the ith class of HYS effect, HYSi=fixed effect of herd-year-season of calving i, lactj=fixed effect of jth parity, ak= random effect of animal k, pek = random permanent environmental effect of animal k, eijk = random residual error. Genetic evaluations for productive traits were performed using a univariate animal repeatability model through restricted maximum likelihood (REML) method in WOMBAT software (Meyer 2007).
The estimated repeatability (±SE) of different measures of lactation persistency ranged from 0.06 to 0.20, while the corresponding values for 100- and 305-d milk production were 0.30 (±0.005), and (±0.001), respectively. Among the lactation persistency measures, the P31 showed the highest repeatability (0.20), while the Pw was the lowest (0.06). The estimated repeatability (±SE) for lactation persistency measure of P21 and PJ were 0.14 (±0.006) and 0.09 (±0.005), respectively.
Results
Heritability and repeatability
The estimated heritability (±SE) of different lactation persistency measures and lactation performance for the first three parities are presented in Table 1. The estimated heritability (±SE) for lactation persistency in the first, second, and third parity ranged from 0.01 (±0.003) to 0.06 (±0.006), 0.02 (±0.005) to 0.10 (±0.010) and 0.01 (±0.007) to 0.12 (±0.0012), respectively. The heritability for 100- and 305-d milk ranged from 0.08 (±0.012) to 0.24 (±0.010) and 0.08 (±0.014) to 0.28 (±0.001), respectively. The estimated heritability (±SE) for the lactation persistency measures of P21, P31 and PJ increased with advancing parity; while reverse trends were found for lactation persistency measure of Pw, as well as 100- and 305-d milk yield (Table 1).
Table 1 The estimated heritability (±SE) of different lactation persistency measures and lactation performance for the first three parities in Holstein cows in Iran.
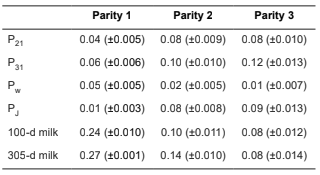
P21: Ratio of milk yield in the second 100 DIM divided by that of the first100 DIM (Johannsson and Hansson, 1940). P31: Ratios of production in the third100 DIM divided by that of the first 100 DIM (Johannsson and Hansson, 1940). PW: lactation persistency derived from the incomplete gamma function (Wood, 1967).PJ: difference between milk yield in 60th and 280th day of lactation (Jamrozik et al., 1998).
The estimated repeatability (±SE) of different measures of lactation persistency ranged from 0.06 to 0.20, while the corresponding values for 100- and 305-d milk production were 0.30 (±0.005), and 0.40 (±0.001), respectively. Among the lactation persistency measures, the P31 showed the highest repeatability (0.20), while the Pw was the lowest (0.06). The estimated repeatability (±SE) for lactation persistency measure of P21 and PJ were 0.14 (±0.006) and 0.09 (±0.005), respectively.
Correlations
Genetic and phenotypic correlations between different lactation persistency measures and lactation performance for the first three parities are presented in Table 2. The genetic correlations between 100-d and 305-d milk yield were 0.96, 0.85 and 0.79 for the first, second, and third lactation, respectively; while the corresponding phenotypic values were 0.80, 0.77, and 0.76, respectively. Genetic correlation between lactation persistency measures and 305- d milk production for the first, second, and third lactation ranged from 0.18 to 0.63, 0.32 to 0.75, and to 0.70, respectively. The corresponding values for 100-d milk were -0.28 to 0.42, -0.21 to 0.37, and -0.13 to 0.14 for the first, second, and third lactation, respectively. Therefore, the genetic correlations of lactation persistency measures with 305-d milk production were much higher than those with 100-d milk production. The lactation persistency measures of Pw and PJ showed the highest and the lowest genetic correlations with either 100- and 305-d milk production, respectively. Phenotypic correlations among lactation persistency measures and 305-d milk production for the first, second, and third lactation ranged from 0.19 to 41, 0.07 to 0.50, and 0.01 to 0.52, respectively. The corresponding values for 100-d milk production ranged from -0.28 to 0.18, -0.41 to-0.13, and -0.43 to -0.11 for the first, second, and third lactation, respectively.
Table 2 Genetic (upper diagonal) and phenotypic (lower diagonal) correlations between different lactation persistency measures, and lactation performance for first three parities.
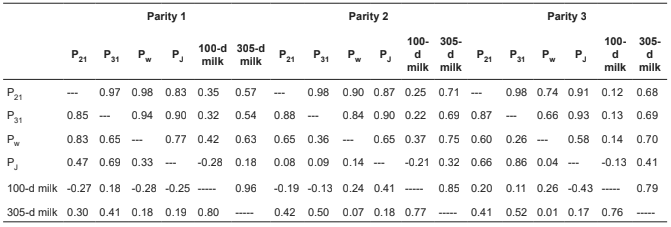
P21: Ratio of milk yield in the second 100 DIM divided by that of the first100 DIM (Johannsson and Hansson, 1940). P31: Ratios of production in the third100 DIM divided by that of the first 100 DIM (Johannsson and Hansson, 1940). PW: The lactation persistency measure derived from the incomplete gamma function (Wood, 1967). PJ: The difference between milk yield in 60th and 280th day of lactation (Jamrozik et al., 1998)
Genetic correlation among lactation persistency measures for the first, second, and third lactation ranged from 0.77 to 0.98, 0.65 to 0.98, and 0.58 to 0.98, respectively. The highest genetic correlation was found between lactation persistency measures of P21 and P31. The phenotypic correlation among lactation persistency measures for the first, second, and third lactation ranged from 0.33 to 0.85, 0.08 to 0.88, and 0.04 to 0.87, respectively.
Discussion
In this study, 27.36 of cows in the first, 26.12 of cows in the second, and 24.85% of cows in the third lactation had atypical lactation curves. Rekik et al. (2003) reported 15 to 42% atypical curves in dairy herds of Tunisia. Tekerli et al. (2000) reported 26.3% (of 1,278) atypical curves in Holstein dairy cows of Turkey. Variability in the quantity and quality of ration as well as physiological and health problems related to harsh environmental conditions (heat in summer) may lead to atypical lactation curves (Rekik and Gara, 2004). Macciotta et al. (2006) considered the time from parturition to the first recorded test, as the most important factor affecting the incidence of atypical lactation curves.
Heritability for lactation persistency in the three first parities of Iranian Holstein cows ranged from 0.01 to 0.06, 0.02 to 0.10, and 0.01 to 0.12, respectively. The estimated repeatability for lactation persistency ranged from 0.06 to 0.20. It is clear that heritability and repeatability of lactation persistency depends upon how persistency is defined (Swalve and Gengler, 1999). These estimates for heritability and repeatability are lower than those reported in the literature (Gengler, 1995; Jamrozik et al., 1998; Strabel et al., 2001; Jakobsen et al., 2002), and may be due to differences in trait definitions. Gengler (1995) reported that heritability and repeatability for lactation persistency of milk yield is 0.14 and 0.26, respectively. Cole and Null (2009) investigated milk yield persistency for five breeds of dairy cattle (Ayrshire, Brown Swiss, Guernsey, Jersey, and Milking Shorthorn) and reported that heritability of lactation persistency ranged from 0.09 (Milking Shorthorn) to 0.18 (Guernsey), and its repeatability ranged from 0.19 (Brown Swiss) to 0.28 (Guernsey).
Atashi et al. (2006) reported that heritability measures for lactation persistency in Holstein cows in Iran ranged from 0.05 to 0.08. Otwinowska-Mindur and Ptak (2015) using the same definitions for lactation persistency in Polish Holstein-Friesian cows, reported that its heritability ranged from 0.03 to 0.07, 0.05 to 0.08, and 0.01 to 0.04, for the first, second, and third lactation, respectively.
The estimated heritability for all lactation persistency measures, except for Pw, increased with increasing lactation number, and its reason might be the higher peak production in second and third lactation compared to that in first lactation (Van der Linde et al., 2000).
In the present study, genetic correlation among lactation persistency measures in the first three parities ranged from 0.77 to 0.98, 0.65 to 0.98, and 0.58 to 0.98, respectively. Jakobsen et al., (2002) reported that genetic correlations between lactation persistency measures ranged from -0.91 to 0.94. Cole and Null (2009) investigated milk yield persistency for five breeds of dairy cattle and reported that genetic correlation between milk yield persistency and 305-d milk yield ranged from -0.25 (Guernsey) to 0.19 (Ayrshire). In addition, Otwinowska-Mindur and Ptak (2015) reported that genetic correlation between lactation persistency measures ranged from 0.66 to 0.99.
Genetic correlation between lactation persistency measures and 305-d milk yield for the first, second, and third lactation ranged from 0.18 to 0.63, 0.32 to 0.75, and 0.41 to 0.70, respectively. The corresponding values for 100-d milk were -0.28 to 0.42, -0.21 to 0.37, and -0.13 to 0.14 for the first, second, and third lactation, respectively. These values confirm that there is a moderate genetic association between milk yield and persistency, indicating that animals having higher level of lactation persistency produce higher level of 100- and 305-d milk yield. Further, although, high genetic correlations were found between 100- and 305-d milk yields in the first three parities, 305-d milk yield showed a stronger genetic correlation with lactation persistency than it did with 100-d milk yield. This finding can be probably explained by the fact that milk yield in early lactation (first hundred days of lactation) has more variation than milk yield in mid (second hundred days of lactation) or late lactation (third hundred days of lactation). Following calving, daily milk yield increases rapidly, reach its peak up to 90 d post calving, remains high for a while and then gradually declined in the later stage of lactation.
Among the measures of lactation persistency, PW showed the highest genetic correlation with 305-d milk yield in all lactations (0.63, 0.75, and 0.70 for the first, second, and third lactation, respectively), while PJ showed the lowest (0.18, 0.32 and 0.41 for the first, second, and third lactation, respectively). Similar trend was found for genetic correlation among lactation persistency measures and 100-d milk yield. Van der Linde et al. (2000) reported that genetic correlations between milk yield and lactation persistency for the first and the second lactation were 0.25 and 0.53, respectively. Previous researchers have reported different ranges for genetic correlation between lactation persistency and milk yield (Jamrozik et al., 1998; Jakobsen et al., 2002; Biassus et al., 2010; Boujenane and Hilal 2012). Jamrozik et al. (1998) reported that genetic correlations between lactation persistency and 305-d milk yield ranged from 0.1 to 0.55. Jakobsen et al. (2002) reported that genetic correlation between 305-d milk yield and lactation persistency ranged from 0.00 to 0.47. Canaza-Cayo et al. (2015) using nine different measures for milk yield persistency reported that heritability and genetic correlation for persistency and 305-d milk yield varied from 0.10 to 0.33, and from −0.98 to 1.00, respectively. Obviously, genetic correlations among various persistency measures as well as their correlations with milk yield vary considerably depending upon how the persistency measure is defined (Swalve and Gengler, 1999).
The results showed that the definition of lactation persistency could affect the estimated heritability, repeatability and the genetic correlations among various persistency measures, as well as their correlations with milk yield. The main objective of this study was to estimate (co)variance components needed for routine evaluations of lactation persistency. Genetic evaluations for productive traits are usually calculated using a repeatability animal model and the same model was used in this study to calculate heritabilities and repeatabilities. The moderate positive genetic correlation between lactation persistency and the 305-d milk yield indicates that selection for increasing milk yield would slightly improve lactation persistency as well.

