


 English (pdf)
 Article in xml format
 Article references
 Send this article by e-mail
 Cited by SciELO
  Cited by Google
  Similars in
SciELO
Similars in
SciELO  Similars in Google
 Permalink
Introduction
Brazil is the third largest dairy producer in the world after the United States and India (Embrapa, 2019). Therefore, the milk production industry plays a vital role in the economic and social development of Brazil, presenting a great potential for expansion (Neves et al., 2010; Okano et al., 2014). As in any specialized industry, the processes involved in milk production use equipment, management techniques and several inputs in multiple farming sectors (Lopes et al., 2004). Productivity and financial efficiency of dairy farms are usually determined by their characteristics, level of specialization, and especially by their management (Solano et al., 2006) and stocking rate (number of cows milked per hectare), which is often associated with higher levels of productivity and profitability (Ma et al., 2020).
Over the years, dairy farms have changed their approach, as additional bonuses are offered for high milk quality, becoming a substantial part of the financial revenues. In Brazil, legislation seeks to raise milk quality standards according to food safety requirements (Brasil, 2018). This has become a challenge for the farmers and a way to increase profitability.
Profitability is an essential factor for dairy farm sustainability (Calker et al., 2005) and is influenced primarily by milk price at the marketplace, feed cost, and average fixed cost per cow or milk sold. Although the scale of production influences profitability, small farms with less than 10 cows can be profitable due to unpaid family labor and low investment in facilities (Hemme and Otte, 2010). Feed represents the greatest cost for producing milk and it is well known that feed intensification is related to farm profitability. Although improving the level of technology increases milk solids and gross margin, it also leads to higher costs, and thus reduces operating profit, operating profit margin, and return on assets (Ma et al., 2018).
Considering the number of factors that can influence farm productivity and profitability, directly affecting the economy of the farmer, the objective of this study was to determine indicators that can predict profitability in three different dairy production systems in Paraná State, Southern Brazil.
Materials and Methods
Milk quality records, production performance, and costs were collected from fifty dairy farms from the database of an extensive cooperative industry system located at the center-eastern region of Paraná State, in southern Brazil (Latitude: 24º 47' 28" S; Longitude: 50º 00' 43" W). A retrospective assessment of monthly data from the period comprising years 2008 to 2010 was performed. The farms were classified into three major categories according to production system: grazing, semi-feedlot and feedlot.
The grazing system (12 farms) included farms that used perennial and annual winter and summer grasses. In addition to pasture, the animals were supplemented with corn silage and concentrate formulated according with milk production, ranging from 20 to 50% of the daily feed intake, according to forage supply. These farmers used family labor. Their herds consisted of mixed breed animals (5/8 Holstein, Jersey or Brown Swiss), and alternating crosses with the zebu Gir breed (ranging from 1/4 to 3/4).
The semi-feedlot system (26 farms) included farms that used perennial and annual winter and summer grasses. In addition to pasture, the animals received supplementation with corn silage, pre- dried oats or ryegrass and concentrate formulated according to milk production, ranging from 50 to 80% of the daily feed intake. Grazing occurred during the winter period (April to October), when temperate species predominated. Pre-dried silage was used during the summer (November to March), when the land was used with other crops. Such farms used both family and hired labor. The herds were mainly composed of Holstein, Jersey and Brown Swiss breeds.
The feedlot system (12 farms) was characterized, not exclusively, by farms that had totally confined herds. Feedlot systems were considered those with a free stall, tie stall or compost barn structure and a structure for housing the animals in production, as well as 100% of the dry matter being provided in the trough. If facilities and equipment were used exclusively for the dairy farm, their capital value was fixed, depreciation was calculated, as well as maintenance and fuel expenses that make up operational costs and appropriately allocated to the activity. When the farm performed more than one activity, such as livestock and agriculture, apportionment criteria were used to immobilize the capital value and operational costs were allocated to the activity that used the asset in the corresponding period (fuel, maintenance and hours/employee during planting and harvesting allocated to agriculture). It also had capital immobilized in assets such as robotic milking, carousel milking system, milk storage silos and chiller, as well as technical assistance and hiring employees to carry out the activities. Animals received preserved forage, generally constituted by pre-dried silage, corn silage, concentrate and minerals offered in a total mixed diet formulated according with milk production. The herd predominantly consisted of Holstein cattle, registered by the Brazilian Association of Holstein Breeders, with monthly milk control.
Monthly cash-flow data were collected for each farm to generate indicators of financial performance, as described by Alves et al. (2009) and Oliveira et al. (2007). The total revenues included milk sales, dividends of the industry, sale of disposal animals, animal sales (lactating cows or dry cows), sale of genetics (embryo and young animals), sale of manure, machines and equipment.
The effective operational cost (EOC) considered the following items: concentrate and minerals, production and purchase of forage, milking services and general management, herd health, artificial insemination, energy, fuels and lubricants, social charges, rent of pastures, repair improvements in facilities, repair of machines, engines, equipment, tools and utensils, other expenses, payment of working capital, management and consulting services, bank fees, and interest. The total operational cost (TOC) was calculated by adding the EOC plus payments. The total cost (TC) considered the TOC plus depreciation.
Gross margin was obtained by discounting the EOC from the total revenues. The net income was obtained as the difference between total revenues and TC. The total cost leveling point for the period was obtained by the following formula: total cost per liter * (daily production/ total revenue per liter).
The value of fixed capital was used to calculate the profitability of the invested capital: (gross margin * (milk sold per day * 365 days) / total fixed capital).
The final milk price paid to the farmers (USD$/L) considered the results of somatic cell count (SCC - Cells/mL), total bacteria cell count (TBC - CFU/mL), and the percent of fat and protein content.
Financial variables were corrected according to economic indicators generated by the General Price Index - Internal Availability of the Fundação Getúlio Vargas (IGP-DI, 2012), using January 31 of 2012 as base day. Thus, dollar monetary values were obtained excluding the effect of the variation caused by the inflation corresponding to the previous years of the period of interest (2008, 2009 and 2010), allowing comparison between variables at the end of the established period.
Statistical analysis
Descriptive statistics were generated for all variables. Since none of the variables presented normality according to the Shapiro-Wilk test, they were compared across the three systems using the Kruskal-Wallis analysis of variance for non-parametric data. Multivariate analyses were conducted by grouping variables according to existing inter-relations and identifying factors related to the production. Factorial analysis results were used for simple liner regression analysis to identify a set of factors able to predict the price of milk paid to the farmer, stratifying by production. Statistical analyses were performed using SPSS® software (2007).
Results
Feedlot herds had larger cattle inventory and milk production than herds in the other systems (p<0.05). They also achieved higher milk yield per lactating cow and annual productivity per area (Table 1).
Generally, variable costs were greater for herds in feedlot systems (p<0.05) than in the other systems (Table 2). The combined feed expenses (concentrate and minerals; and pro- duction and forage purchase) represented the greatest variable costs in all three systems and were greater for the feedlot system (p<0.05). However, costs related to milking services and general management, which had the third great- est contribution for variable costs, were both greater in the grazing system than in the other systems (p<0.05).
The fixed costs in the semi-feedlot system did not differ (p>0.05) from those of grazing and feedlot systems (Table 3). The feedlot system presented greater fixed costs than the grazing system (p<0.05). However, costs with depreciation and payment were greater in the grazing system than in the other two systems (p<0.05).
Operational costs (both effective and total) were the greatest for the feedlot system than for the semi-feedlot and grazing systems (p<0.05). The same scenario was observed for the total costs (Table 4). The total revenue of farms in the feedlot system was greater (p<0.05) than for farms in the other systems, but it was similar (p>0.05) for the grazing and semi-feedlot sys- tems (Table 4). Nevertheless, since the gross margin and net income were greater and the to- tal cost leveling point was lower (p<0.05) the grazing system presented greater profitability (p<0.05) than the other systems (Table 4).
The mean price paid per liter of milk was lower for the grazing system (p<0.05) than for the other systems (Table 5). The lowest total bacteria cell count (TBC) values were observed in milk of the semi-feedlot system (p<0.05), whereas the greatest somatic cell count (SCC) were observed in milk produced in the grazing systems (p<0.05). Milk produced in the feedlot system presented the lowest concentration of both fat and protein (p<0.05).
Table 1 Characterization and production performance of three dairy systems in southern Brazil.
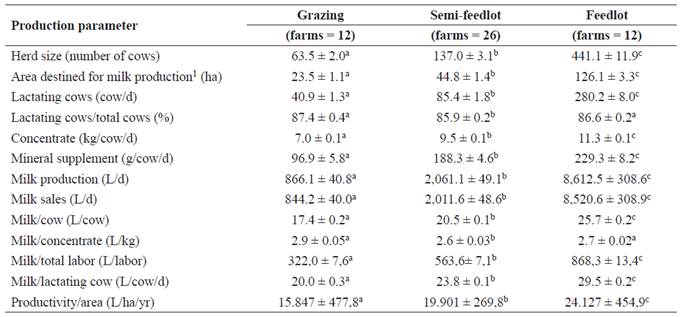
1Area destined for milk production, including silage and pasture production areas. Means ± standard errors with different letters within the same row differ by Kruskal-Wallis test (p<0.05); n: number of animals; AU: animal unit; d: day; L: liter; ha: hectares; yr: year.
Table 2 Variable costs of three dairy systems in southern Brazil.
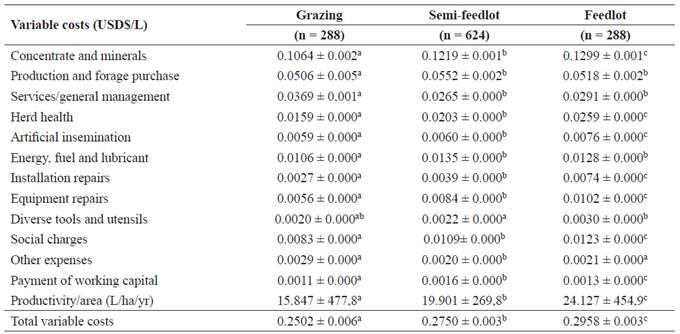
Means ± standard errors with different letters within the same row differ by Kruskal-Wallis test (p<0.05); n: number of animals.
Table 3 Fixed costs of three dairy systems in southern Brazil.
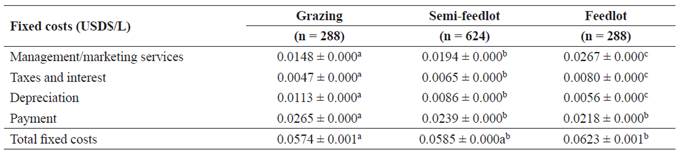
Means ± standard errors with different letters within the same row differ by Kruskal-Wallis test (p<0.05); n: number of animals.
Table 4 Financial performance indicators of three dairy systems in southern Brazil.
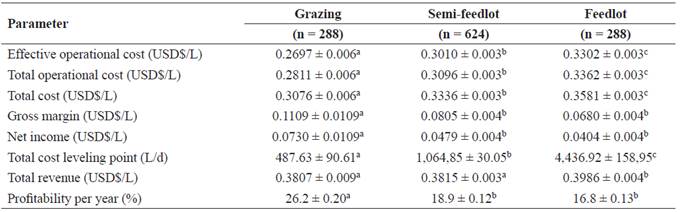
Means ± standard errors with different letters within the same row differ by Kruskal-Wallis test (p<0.05); n: number of animals; L: liter; d: day.
After running the factorial analysis model, the KMO data adequacy was 0.691, and the BST was significant for the null hypothesis that the original matrix is an identity matrix (p<0.05), allowing 17 major components to be obtained (Table 6). However, to compose 70.0% of accumulated variance, only six main components were used. The first major component explained 30.3% of the total variance.
After the rotation, the explanatory power of variance of the first component decreased to 27.6%. However, the cumulative percent re- mained unchanged, explaining 69.5% of the total variance with the first six components identified by the model (Table 6). Thereafter, the 17 major components initially included in the model were grouped according to their common variance. Variables with variance values closer to 1.0 were considered more relevant to be included in the subsequent factorial analysis.
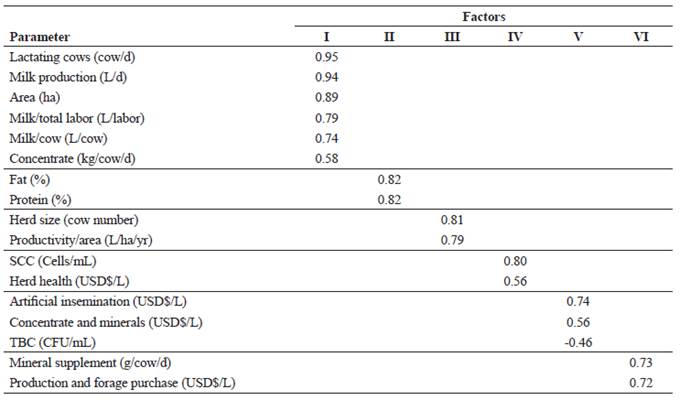
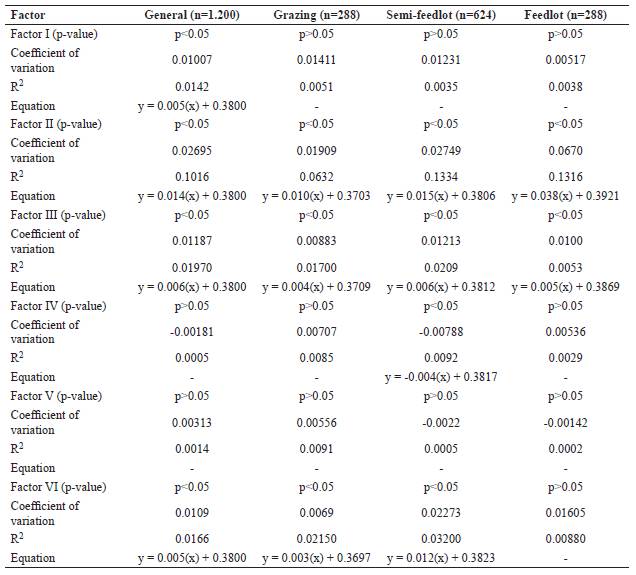
In Factor I, six production-related variables were grouped (Table 7), including three with the greatest common variables: lactating cows, milk production, and area. In Factor II, the loads at tributed to fat and protein concentration were identical and equally high (Table 7). The variables included in Factor III were herd size and annual productivity. The SCC and health relat- ed costs (USD$/L) were included in Factor IV, with the former having a more expressive load than the latter. In factor V, positive values were observed for investment in artificial insemina- tion, and concentrate and mineral supplements, while negative values were observed for TBC (Table 7). In Factor VI, investment in mineral supplements and production and forage purchase were considered, presenting similar values (Table 7). All such factors generated were evaluated in each production system using linear regres- sion analysis, considering milk price (USD$/L) as the response of interest (Table 8). Factors I, II, III, IV and VI showed a positive association with milk price (p<0.05). Factor IV presented a negative association with milk price considering general data (without characterization by pro- duction systems), and specifically considering the semi-feedlot system (p<0.05). However, in both cases, the coefficients of determination (R2) corresponding to those negative association pre- sented extremely low values (Table 8).
Table 5 Quality, price and volume of marketed milk of three dairy systems in southern Brazil.
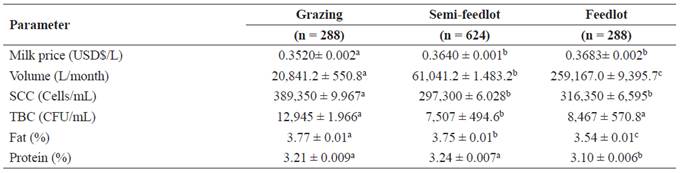
Means ± standard errors with different letters within the same row differ by Kruskal-Wallis test (p<0.05); n: number of animals; L: liter; SCC: somatic cell count; TBC: total bacteria count; CFU: colony forming unit.
Discussion
The dairy bussiness involves a large amount of fixed assets, among which land (area) represents the largest capital value and has low liquidity. Thus, increasing productivity of herd and land becomes necessary to sustain this activity (Marques et al., 2002; Aleixoet al., 2007; Britt et al., 2018). The low annual productivity per area of grazing compared to the feedlot and semi- feedlot systems does not necessarily indicates less use of the invested capital since the available area seems to be intensively used in the studied region. Despite reduced annual productivity of the grazing system, it was higher compared with data from other Brazilian regions: 2,789; 895, and 1,854 liters/ha/year, according to Lopes et al. (2004), Oliveira et al. (2007), and Simões et al. (2009), respectively.
Milk production per kg of concentrate suggest that grazing farms were similar to feedlot farms in terms of using all available resources intensively. Thus, adjusting the amount of concentrate fed to low productive cows would be critical in feedlot herds. Such herds are probably unable to return the investments in genetic improvement. Therefore, costs of intensive milk production do not include less productive animals, even when diets are adjusted to production level.
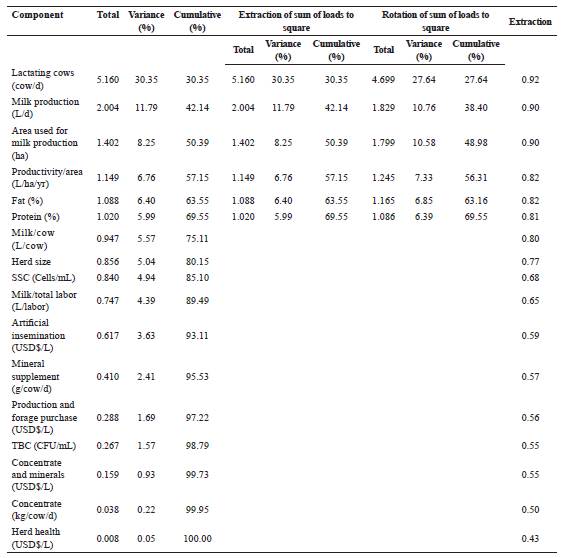
Table 7 Factors related to financial performance of three dairy systems in southern Brazil, grouped according to collinearity between variables.
Milk volume/area/lactating cow and total labor are also important indicators of productivity (Britt et al., 2018) given that labor may account for 20% of the operational costs in a dairy system (Gomes, 2007). Commonly, family labor employed in dairy receives greater payment in grazing compared with the other systems (Lopes et al., 2004; Oliveira et al., 2007; Alves et al., 2009; Simões et al., 2009; Lopes et al., 2010;). The greater labor cost per liter observed in the grazing system in the present study demonstrates that family labor could have as much impact on total cost as hired labor. Therefore, increasing labor costs requires intensification of the labor force to balance the financial performance of production systems (Gomes, 2007; Oliveira et al., 2007). Nonetheless, the grazing systems evaluated in the present study showed greater net income and profitability per year than the semi-feedlot and feedlot systems. However, all capital and expenses were paid at greater levels than fixed-income investments during the same period. Positive net income indicated that the production system might have long term sustainability (Gomes, 2006), becoming attractive to invest in intensifying production and reduce costs during the agricultural off- season.
According to the multivariate analysis, productivity per area was among the six variables explaining the greatest percent of the economic performance variance. However, after load redistribution analysis, it formed Factor III along with herd size, maintaining high loads regardless of other variables. Considering the significant association of Factor III with milk price, annual productivity per area may be considered a relevant predictor of financial performance in dairy systems. Despite the low coefficient of determination, a preliminary regression analysis showed that the base milk price can predict 85 to 90% of the milk price paid. Solano et al. (2006) observed a strong association among pasture management, soil fertility and herd size, suggesting that tight management of such factors would improve productivity and margins per area.
Table 8 Linear regression analysis using six factors as predictors of milk price (USD$/L) for three dairy systems in southern Brazil.
An association between variables related to production was also described by Gomes (2006), observing that annual productivity per area synthesizes the number of lactating cows by the number of animals in the herd, production per lactating cow and herd size.
A negative effect of TBC was observed in the formation of Factor V. This indicates that loss of bonus due to high bacteria count impaires the benefits of artificial insemination, concentrate and mineral supplementation. This suggests a possible relationship between hygiene at milking and investments. However, after linear regression analysis, no effect of Factor V on milk price was observed.
The grazing, semi-feedlot, and feedlot systems resulted in SCC lower to those stipulated by Normative No. 77 currently effective in Brazil (Brasil, 2018), and also in compliance with the levels required in countries with greater productivity (Trevisi et al., 2006; Norman et al., 2011). Nevertheless, Factor IV presented a high load for SCC, and was positively associated with herd health. SCC is used as a marker of udder health, which must be below 200.00 cells/ mL to be considered healthy (Lipkens et al., 2019). Factor VI showed a positive effect on the formation of milk price in the semi-feedlot and grazing systems, as well as in the general data analysis, indicating that mineral supplement and production, and forage purchase affect milk payment. However, if farmers invest too much in mineral and forage, milk price may not compensate for the investment. So, direct association between feed expenses and milk price must be carefully evaluated, and all other factors directly involved should be considered.
Percentage of fat and protein in milk (factor II) contributed to the formation of milk price paid and, consequently, to profitability. Milk fat and protein concentration is related to diet, level of production, and breed (Coldebella et al., 2004). Another relevant variable analyzed in the present study was the farm remuneration for quality, suggesting changes in the milk payment policy, which currently provides greater payment for milk volume than quality.
Productivity and financial efficiency of dairy systems was mainly influenced by six factors: area, lactating cows, productive performance, productivity per area, milk quality, and the use of artificial insemination plus supplementation (concentrate and minerals), which may be negatively associated with investment level in specific areas, such as total bacteria counts. Nearly 13% of the milk price can be attributed to milk fat and protein, herd size, and productivity per area.

