


 English (pdf)
 Article in xml format
 Article references
 Send this article by e-mail
 Cited by SciELO
  Cited by Google
  Similars in
SciELO
Similars in
SciELO  Similars in Google
 Permalink
Introduction
Consumers consider several factors when selecting a beef meat cut. According to MacKinney et al. (1966), the visual aspect is the main factor affecting cut selection and purchase by consumers. Hedrick et al. (1994) stated that one of the most important factors for meat selection is color. Color is strongly influenced by pH and subcutaneous fat thickness (SFT). As meat pH declines from 7.0 to 5.5 after slaughter, light scattering increases within the structure of muscle cells, which is associated with increased paleness of the meat surface (Warner, 2016). In addition, SFT plays a key role in reducing carcass shortening during the cooling processes (Dolezal et al., 1982), which may brown the outside of muscles exposed to cooling giving an undesirable visual appearance (Rotta et al., 2009). Therefore, pH and SFT may be important predictors of color parameters in meat and influence meat cut selection by the consumer.
Changes in pH, SFT, and meat color are associated with biochemical processes that occur during the transformation of muscle into meat (Warner, 2016). This suggests that pH, SFT, and color parameters are not independent. However, the multivariate relationships among these variables have not been studied in bovine meat.
Canonical correlation analysis - a multivariate statistical technique- can be used to quantify the magnitude of interrelations between sets of multiple variables (Akbaş and Takma, 2005; Ventura et al., 2011). The objective of this study was to investigate multivariate relationships among pH, SFT, and color parameters in bovine meat using canonical correlation analysis.
Materials and Methods
Ethical considerations
Pre-harvest handling was in accordance with good animal welfare practices and slaughtering procedures, following the Sanitary and Industrial Inspection Regulation of Animal Origin Products of Brazil (Brasil, 1997).
Data collection
A dataset containing 173 individual records of pH, subcutaneous fat thickness (SFT), and color parameters (a*: intensity of red color, b*: intensity of yellow color, and L*: lightness) from five Brazilian beef cuts (Nellore breed) (i.e., acém, contrafilé, fraldinha, patinho and picanha) was constructed (Table 1). The cuts were selected at the facilities of a commercial butchery with State Inspection System (SIE), located in Parauapebas, Pará State, Brazil.
Beef cuts were obtained from carcasses stored in cold rooms (0o C) for 24 hours after slaughter. The analyses were conducted immediately after deboning and before cuts were displayed at the butchery. The pH was measured using a portable pH meter with a penetrating electrode (FisherbrandTM, Göteborg - Sweden) introduced into the meat cut 2 to 4 cm depth (Dallantonia et al., 2015). The SFT measurements were taken along the ventral length of each meat cut using a Vernier digital caliper (Mitutoyo, Aurora, IL, USA; Ribeiro et al., 2016).
Color was determined as described by Houben et al., (2000) using a colorimeter (CR 300, Minolta Camera Co. Ltd., Osaka - Japan). Intensity of red color (a*), intensity of yellow color (b*), and lightness (L*) were evaluated using the CIELAB System by a standard D65 illuminator and a 10º angle for the observer. Instrument calibration was performed before reading the samples. The a*, b*, and L* values were obtained after thirty minutes of air exposure -for oxygenation of myoglobin- from five replications taken at different points in each meat cut.
Statistical analysis
A canonical correlation analysis was performed using the CANCORR procedure of the Statistical Analysis System Software, version 9.4 (SAS/ STAT, Cary, NC, USA; 2017) to explore multivariate statistical relationships between color variables (a*, b, and L*) and chemical variables (pH and fat thickness) (Hair et al., 2014). This technique estimates the correlation between two canonical variates (i.e., U and V, color and chemical variables, respectively), which are a linear combination of the original variables (U: a*, b*, L* and V: pH and SFT) (Equations (1) and (2), respectively):


Where, aip and biq are the canonical weights, p and q are the number of variables of Ui and Vi, and Ui and Vi are the i-th pair of canonical variates. The total number of pairs of canonical variates is defined by the minimum between the original variable number of each canonical variate. Thus, U1 and V1 form the first pair of canonical variates, and U2 and V2 form the second pair of canonical variates. Therefore, first (r1) and second (r2) canonical correlations are defined as:
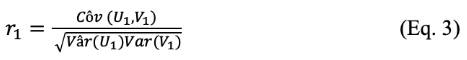
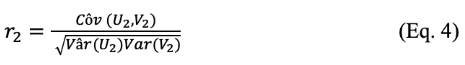
Table 1 Descriptive statistics of beef meat cut parameters (n = 173).
| Variable | Mean | SD | Min | Max |
|---|---|---|---|---|
| Acem | ||||
| a* | 15.9 | 2.91 | 9.59 | 20.5 |
| b* | 5.90 | 2.12 | 3.27 | 9.94 |
| L* | 36.2 | 3.09 | 31.3 | 42.4 |
| pH | 5.51 | 0.06 | 5.36 | 5.69 |
| SFT (cm) | 2.52 | 1.00 | 0.39 | 4.50 |
| Contrafilé | ||||
| a* | 16.5 | 2.77 | 11.7 | 22.0 |
| b* | 7.65 | 1.94 | 3.75 | 12.6 |
| L* | 40.2 | 4.15 | 33.3 | 47.5 |
| pH | 5.52 | 0.11 | 5.39 | 5.74 |
| SFT (cm) | 2.51 | 1.39 | 0.49 | 6.73 |
| Fraldinha | ||||
| a* | 17.8 | 4.36 | 11.7 | 23.7 |
| b* | 7.98 | 2.67 | 3.58 | 10.6 |
| L* | 39.8 | 2.36 | 35.8 | 43.1 |
| pH | 5.65 | 0.13 | 5.36 | 5.90 |
| SFT (cm) | 5.03 | 3.58 | 0.93 | 11.0 |
| Patinho | ||||
| a* | 17.6 | 5.85 | 8.62 | 48.0 |
| b* | 7.20 | 2.50 | 2.14 | 11.7 |
| L* | 41.2 | 3.69 | 35.4 | 57.7 |
| pH | 5.64 | 0.12 | 5.39 | 5.90 |
| SFT (cm) | 2.58 | 1.83 | 0.55 | 9.00 |
| Picanha | ||||
| a* | 17.4 | 2.43 | 12.5 | 22.8 |
| b* | 7.02 | 1.30 | 4.34 | 9.16 |
| L* | 37.4 | 2.12 | 32.0 | 42.6 |
| pH | 5.47 | 0.06 | 5.40 | 5.71 |
| SFT (cm) | 3.22 | 3.60 | 0.31 | 15.1 |
SFT = subcutaneous fat thickness; SD = standard deviation; Min = minimum; Max = maximum.
Wilk’s Lambda and Bartlett tests were used to test the significance of canonical correlations. In addition, a canonical redundancy analysis for each canonical correlation was performed to measure the amount of variance accounted by the canonical variates (U and V; Hair et al., 2014).
Results
The pH was not correlated to SFT, but it was positive and negatively correlated to L* and a*, respectively. The SFT showed a positive correlation with a*, b*, and L*. The L* was positively correlated to b*, and a* was positively correlated to b* (Table 2).
Table 2 Pearson correlations between original variables.
| pH | Fat thickness (cm) | L* | a* | b* | |
|---|---|---|---|---|---|
| pH | 1.0000 | 0.0071 | 0.1585† | -0.1535† | -0.1499 |
| Fat thickness (cm) | 1.0000 | 0.2153‡ | 0.2516‡ | 0.3124‡ | |
| L* | 1.0000 | 0.0843 | 0.5247‡ | ||
| a* | 1.0000 | 0.4668‡ | |||
| b* | 1.0000 |
†p<0.05, ‡p<0.01.).
Canonical correlations between U (i.e. a*, b*, and L*; color variables) and V (i.e. pH and SFT; chemical variables) were significant (p<0.01) (Table 3). The first and second canonical correlations were 0.463 and 0.282, respectively.
Canonical redundancy analysis revealed that canonical variates U1 and U2 accounted for 55.5 and 21.2% of the variance, respectively, representing 76.7% of the cumulative variance. On the other hand, canonical variates V1 and V2 accounted for 49.3 and 50.7% of the variance, respectively, explaining 100% cumulative variance.
Standardized canonical coefficients or canonical weights of original variables represent their relative contribution to the corresponding canonical variates U and V. For the U1 canonical variate the absolute values of standardized canonical coefficient for a* and b* were greater than that for L*, while for the U2 canonical variate, the standardized canonical coefficients for b* and L* were the greatest. For the V1 canonical variate, the absolute value of standardized canonical coefficient for SFT was greater than that for pH, whereas for the V2 canonical variate, the standardized canonical coefficient for pH was the greatest (Table 3).
Table 3 Standardized canonical coefficients of variates (canonical weights), canonical correlation (R) between two sets of variables, and significant test for canonical correlation (P-value) for two canonical variate pairs.
| Variables | Standardized canonical coefficients | |
| Color | U1 | U2 |
| a* | 0.707 | 0.364 |
| b* | 0.406 | -0.898 |
| L* | -0.004 | 1.234 |
| Chemical | V1 | V2 |
| pH | -0.376 | 0.927 |
| SFT | 0.935 | 0.356 |
| R | 0.463 | 0.282 |
| p-value | <0.01 | <0.01 |
SFT = subcutaneous fat thickness.
Canonical loading values describe the correlation between variables and their respective canonical variate, while canonical cross-loadings describe the correlation between variables and the opposite canonical variate. The original variables a* and b* showed the highest canonical loadings with U1, while L* showed the highest canonical loading with U2. On the other hand, SFT showed the highest canonical loading with V1, whereas pH showed the greatest canonical loading with V2. In addition, SFT showed the highest canonical cross-loading with U1, while pH showed the greatest canonical cross-loading with U2. Also, a* and b* showed the highest canonical cross-loadings with V1, and L* showed the greatest canonical cross- loading with V2 (Table 4).
Table 4 Correlation between variables and related canonical variates (canonical loadings), and between variables and the other set of canonical variates (canonical cross-loadings) for color (U) and chemical (V) canonical variates in beef meat cuts.
| Variable | U1 | U1 | V1 | V1 |
|---|---|---|---|---|
| a* | 0.945 | 0.012 | 0.437 | 0.003 |
| b* | 0.820 | -0.014 | 0.379 | -0.004 |
| L* | 0.318 | 0.797 | 0.147 | 0.225 |
| pH | -0.165 | 0.264 | -0.356 | 0.934 |
| SFT | 0.429 | 0.106 | 0.926 | 0.376 |
SFT = subcutaneous fat thickness.
Discussion
The objective of the present study was to explore the multivariate relationships between color, pH, and SFT parameters in Brazilian commercial meat beef cuts of Nellore steers using canonical correlation analysis. Our results suggested that SFT is the main chemical parameter affecting intensity of red (a*) and yellow (b*) colors, while pH was the main chemical parameter affecting lightness (L*) of bovine meat.
Pearson correlations between original variables revealed a significant and positive correlation between pH and L*, and a significant and negative correlation between pH and a* variables. Similarly, SFT showed a high significant and positive correlation with a*, b*, and L*. These associations reveal a preliminary interrelation between color and chemical variables, justifying the use of a multivariate approach.
Color, pH, and SFT are interrelated in the evaluation of bovine meat quality. Indeed, it is known that these parameters are dependent on genetic group, nutrition, and finishing systems (Rotta et al., 2009). Also, these may be influenced by sex and age, considering that nutrient dynamics of ruminants differ between sexes (Souza et al., 2020) and age (Amorim et al., 2020). In addition, color and pH are influenced by post-slaughter biochemical reactions in muscle fibers (Warner, 2016) and are strongly influenced by pre-slaughter handling (Gallo et al., 2003; Adzitey, 2011). This is in agreement with the present study, which revealed significant canonical correlations between color (i.e., a*, b*, and L*) and chemical (i.e., pH and SFT) parameters, and over 76.7% variance of color parameters was explained by pH and SFT. Therefore, canonical correlation analysis is suitable for studying multivariate relationships between color, pH, and SFT in bovine meat.
Regarding canonical weights, we observed that U1 canonical variate was mainly defined by a* and b*, while U2 was mainly defined by L*. In addition, V1 canonical variate was mainly defined by subcutaneous fat thickness, and V2 was mainly defined by pH. Then, SFT was the principal variable affecting a* and b*, and pH was the main variable affecting L* (Figure 1). This suggests that subcutaneous fat deposition in muscle is determinant for the intensity of red and yellow color in bovine meat, whereas pH may be critical in the definition of lightness.
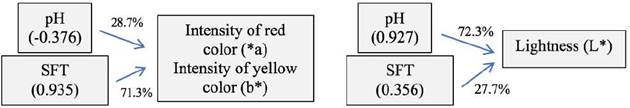
Figure 1 Contributions of pH and SFT to color variables in beef cuts. Values in parenthesis refer to canonical weights (i.e., standardized canonical coefficients); values next to arrows represent pH and subcutaneous fat thickness (SFT) contributions (expressed as canonical weight/sum of canonical weights of pH and SFT × 100) to color variables (a*, b*, and L*).
Canonical weights are important parameters for defining the contribution of original variables to canonical variates. However, the understanding of canonical loadings and cross-loadings is critical because these values describe the correlation between original and canonical variates. From the interpretation of first canonical correlation (i.e., between U1 and V1), our canonical loadings and cross-loadings suggest that an increase in SFT may enhance the intensity of red and yellow colors in beef cuts. Carotenoids, which strictly come from the diet in ruminants (Goodwin, 1992), are the main responsible for yellow color in bovine fatness (Dunne et al., 2009; Ribeiro et al., 2016). So, as meat fat is higher when fat thickness increases (Pflanzer and Felício, 2011), yellow (b*) intensity increases as fat thickness increases.
Regarding red (a*) intensity, it is known that a* is related to the amount of meat myoglobin, which, in turn, depends on several factors, such as breed and age of the animal, maturation of meat and muscle, meat cut or anatomical region of the animal (Rotta et al., 2009; Warner, 2016). After extensive literature search, we did not find reports confirming that SFT changes the a* of meat. In the present study, a significant correlation between a* and b* of meat was observed, then an indirect association between SFT and a* may be expected as well. Therefore, the understanding of multivariate relationships between a*, b*, and subcutaneous fat thickness may be desirable for designing nutritional strategies to improve organoleptic acceptability of beef cuts.
From the second canonical correlation (i.e., U2 and V2), our data of canonical loadings and cross-loading revealed that increased pH in beef cuts increases their lightness. These findings are in accordance with the biochemical changes during muscle-to-meat conversion. As pH declines, light scattering increases within the structure of muscle cells. This increase in scattering is associated with lightness reduction (i.e., increase of paleness) (Warner, 2016). Thus, our data confirms that pH is important to produce meat with attractive organoleptic characteristics.
This control begins with adequate definition of animal slaughter procedures and nutrition protocols.
In conclusion, we found that SFT significantly affects intensity of red and yellow colors, whereas pH significantly affects lightness of beef cuts. Elucidation of the multivariate and quantitative relationships among color, pH, and subcutaneous fat thickness may be useful for a better understanding of the role of muscle metabolism and its implications on organoleptic characteristics of beef cuts. Also, these findings may help to design better nutritional strategies and slaughter practices for enhancing the organoleptic characteristics of beef cuts and derived products.

